Abstract
Interferon-γ (IFN-γ) is an immunoregulatory lymphokine that is primarily produced by T cells and natural killer cells. It has effects on T-cell, B-cell, and macrophage differentiation and maturation. We have developed transgenic mice that express elevated levels of IFN-γ mRNA and protein by inserting multiple copies of murine IFN-γ genomic DNA containing an Ig λ-chain enhancer in the first intron. The founder line carrying eight copies of this transgene has eightfold to 15-fold more IFN-γ–producing cells in the bone marrow and spleen than do nontransgenic littermates. Transgenic mice show a pronounced reduction in B-lineage cells in the bone marrow, spleen, and lymph nodes. In addition, single positive (CD4+,CD8− and CD4−,CD8+) thymocyte numbers are increased twofold, yet the number of splenic T cells is reduced by 50%. There is also a twofold to threefold decrease in the frequency and total number of myeloid progenitors in the bone marrow. Granulomatous lesions and residual degenerating cartilaginous masses are also present in the bones of these mice. Overall, our data show that the abnormal expression of IFN-γ in these transgenic mice results in multiple alterations in the immune system. These animals provide an important model to examine the role of IFN-γ expression on lymphoid and myeloid differentiation and function.
INTERFERON (IFN-γ) is an immunoregulatory cytokine that influences both the growth and differentiation of immunologically active cells. Its effects include but are not restricted to inducing macrophage cytotoxicity,1 enhancing CD4+ T-helper type 1 (Th1) cell growth, inhibiting CD4+ T-helper type 2 (Th2) cell growth,2 upregulating the expression of major histocompatibility complex molecules,3 and stimulating B-cell IgG2a production.4 IFN-γ is produced predominantly by T cells and natural killer (NK) cells,5,6 although macrophages and B-cell lines can also secrete this cytokine.7-10
Changes in IFN-γ expression are associated with numerous clinical conditions (for reviews see Williams et al11 and Halloran12 ). For example, aberrant IFN-γ expression in transgenic mice can result in diabetes,13 hepatitis,14 and retinal degeneration.15 IFN-γ and interleukin-12 (IL-12) play a critical role in maintaining the balance between Th1 and Th2 cytokine-secreting cells in vivo. Studies of parasitic and bacterial infections show that early IFN-γ production determines the host's capacity to mount a protective T-helper cell response.16-26
In this report, we characterize transgenic mice expressing multiple copies of the murine IFN-γ genomic DNA containing an Ig λ-chain enhancer in the first intron of the transgene. Increased IFN-γ mRNA and protein expression was detected in the bone marrow, thymus, and serum from these mice and increased frequency of IFN-γ–producing cells was present in the bone marrow and spleen. Phenotypic studies showed that B-cell and pre-B–cell numbers were significantly reduced in the bone marrow, spleen, lymph nodes, and peripheral blood. There also was significant changes in the number of T cells in these animals, accompanied by a decrease in myeloid progenitors in the bone marrow. Thus, aberrant IFN-γ expression led to marked alterations in the number and frequency of lymphoid and myeloid cells.
MATERIALS AND METHODS
Mice.FVB/NCr and B6D2F1 mice were supplied by the Animal Production Area (National Cancer Institute-Frederick Cancer Research and Development Center, Frederick, MD). Mice were kept in a specific pathogen-free facility and maintained in isolator cages on water and mouse chow ad libitum.
DNA probes.Mouse IFN-γ cDNA was obtained from the DNAX Research Institute (Palo Alto, CA); the mouse Ig λ-chain enhancer was obtained from Dr Ursula Storb (University of Chicago, Chicago, IL).
DNA construction and transgene identification.A plasmid containing the murine Ig λ-chain enhancer, located 15.5 kb downstream of Cλ2-4,27,28 was kindly provided by Dr Ursula Storb. The 412-bp Rsa I DNA fragment containing the λ-chain enhancer was inserted into a single Hpa I site present in the first intron of a 10-kb BamHI genomic DNA fragment containing the murine IFN-γ genomic DNA. The murine IFN-γ genomic DNA was isolated as previously reported29 and includes approximately 3.3 kb of DNA 5′ to the mRNA start site, which has been shown to contain the essential IFN-γ regulatory elements,30 and one copy of the enhancer as determined by polymerase chain reaction (PCR) analysis (data not shown). Transgenic FVB/NCr mice were detected by extraction of tail DNA with proteinase K and phenol-chloroform as described previously,31 digestion of the tail DNA with Bgl II, and analysis of the digested DNA by Southern blot hybridization. One-tenth volume of tail DNA was digested with 40 U of Bgl II (Boehringer Mannheim, Indianapolis, IN) overnight at 37°C in Boehringer Mannheim M buffer. DNA was then subjected to electrophoresis in a 0.8% agarose gel, transferred to Magna graph nylon membrane (MSI, Westboro, MA), and hybridized to murine IFN-γ cDNA (kindly provided by DNAX) using Fastpair hybridization buffer (Digene, Inc, Silver Spring, MD) according to the manufacturer's recommendations. After hybridization, the blots were washed for 10 minutes at room temperature in 2× SSC, 0.1% sodium dodecyl sulfate (SDS) followed by 10 minutes of washing at 65°C in 0.2× SSC, 0.1% SDS. Blots were exposed to Kodak X-OMAT x-ray film (Eastman Kodak, Rochester, NY) for 6 to 18 hours at −70°C.
Production of transgenic mice.Methods for the production of transgenic mice were performed essentially as follows. Female FVB/NCr mice that had been induced to superovulate by intraperitoneal injection with pregnant mare serum gonadotrophin and human chorionic gonadotrophin were bred to FVB/NCr male mice to produce embryos for micromanipulation. Single-cell mouse embryos were flushed from the oviducts of superovulating females with sterile Dulbecco's phosphate-buffered saline (PBS) containing 0.3% bovine serum albumin (BSA) 12 hours post coitus, collected, and maintained in Brinster's modified ova culture (BMOC) medium (pH 7.2) at 37°C until used. Within 2 to 4 hours after harvesting embryos, approximately 200 to 400 copies of linearized DNA per picoliter were introduced into the one-cell stage embryos by pronuclear microinjection, as described by Brinster et al,32 using a Leitz microscope equipped with Leitz micromanipulators (Leica, Inc, Deerfield, IL). Microinjected embryos were cultured overnight in 60-mm2 tissue culture dishes containing BMOC medium in an incubator with a humidified atmosphere containing 5% CO2 at 37°C. Viable embryos that progressed to the two-cell stage were reimplanted into the oviducts of pseudopregnant B6D2F1 female mice mated to vasectomized male B6D2F1 mice.
RNA analysis.Total cellular RNA was isolated from tissues by a single-step phenol/chloroform extraction procedure using RNAsol33 (Cinna Biotecx, Friendswood, TX) according to the manufacturer's instructions. For analysis of thymic stroma and thymocyte RNA, whole thymi were manually dissociated with forceps. Single cells were separated from stromal cells by passing the dissociated tissue through nylon mesh. Tissue remaining on the nylon mesh was considered a crude stromal cell isolation. RNA was extracted from the crude stromal preparation and the single-cell thymocytes as described above. Total cytoplasmic RNA (20 μg per sample) was size-fractionated on a formaldehyde-denaturing 0.8% agarose gel and transferred to a Magna graph nylon membrane (MSI). After UV crosslinking, blots were placed in Fastpair hybridization buffer containing a 32P-labeled murine IFN-γ cDNA probe prepared by random priming using a commercially available kit (Pharmacia, Piscataway, NJ) and incubated for 24 to 36 hours at 42°C. After hybridization, the blots were washed for 10 minutes at room temperature in 2× SSC with 0.1% SDS followed by 10 minutes of washing at 65°C in 0.2× SSC with 0.1% SDS. After hybridization with one probe, the blots were stripped by placing in boiling 0.02× SSC, 0.01% SDS for 20 minutes. Blots were then placed in hybridization buffer for 1 to 2 hours and a chicken β-actin 32P-labeled probe was added. All cDNA probes had a specific activity of 2 to 8 × 10⁸ cpm/μg and all hybridizations were performed with 1 × 10⁶ cpm/mL. Blots were exposed to Kodak X-OMAT x-ray film for 24 to 72 hours at −70°C.
Analysis of IFN-γ production by various tissues.Thymi, spleens, and bone marrow from normal littermate control or transgenic mice were manually dissociated with forceps and cultured individually in the wells of a 6-well plate containing 3 mL of medium (RPMI 1640 [Bio-Whittaker, Walkersville, MD]) containing 10% fetal calf serum (FCS; Intergen Co, Purchase, NY), 1% L-glutamine (200 mmol/L stock; Bio-Whittaker), 1% penicillin/streptomycin (penicillin at 10,000 U/mL and streptomycin at 10,000 μg/mL stock; Bio-Whittaker), 1% nonessential amino acids (10 mmol/L stock; GIBCO-BRL, Life Technologies, Inc, Grand Island, NY), 1% sodium pyruvate (100 mmol/L stock; Biofluids, Inc, Rockville, MD), and 5 × 10⁻⁵ mol/L 2-mercaptoethanol (Sigma Chemical Co, St Louis, MO). Cultures were incubated for 30 hours at 37°C in 5% CO2 . After incubation, culture supernatants were assayed for IFN-γ protein by Clinical Immunology Services (SAIC Frederick, NCI-FCRDC, Frederick, MD) using a murine IFN-γ enzyme-linked immunosorbent assay (ELISA) kit (Genzyme Diagnostics, Cambridge, MA).
Cytokine and IgM ELISA and ELIspot assays.Ninety-six–well Immulon I microtiter plates (Dynatech Laboratories, Inc, Dynatech Corp, Alexandria, VA) were coated with 10 μg/mL of primary anticytokine or anti-IgM antibody (Ab) as described.34,35 Plates were blocked with PBS-5% BSA and washed with PBS-0.025% Tween 20. Serial dilutions of a single cell suspension starting with 105 to 106 cells/well were incubated on these plates for 4 to 6 hours at 37°C in a humidified 5% CO2 incubator.34 35
Plates were washed and then overlaid with 1 μg/mL of secondary biotinylated anticytokine Ab, washed, and treated with a 1:2,000 dilution of avidin-conjugated alkaline phosphatase (Vector Laboratories, Burlingam, CA) or phosphatase-conjugated antimouse IgG or IgM (Southern Biotechnologies, Birmingham, AL). Individual cytokine- or Ig-secreting cells were visualized and quantitated by the addition of 5-bromo-4-chloro-3-indolyl-phosphate/nitroblue tetrazolium (BCIP/NBT; Kirkegaard and Perry Laboratories, Gaithersburg, MD). This reagent yields a purple precipitate (ELIspot) at sites where individual cells had secreted Ab or cytokine. That dilution of cells producing approximately 50 spots/well was used to calculate the total number of cytokine-secreting cells per sample.
Histopathology.Fifteen healthy transgenic mice (3 to 9 months old) and 10 nontransgenic controls (littermates or age-matched) as well as 25 transgenic mice in moribund condition (2 to 13 months old) of both sexes were killed under CO2 anesthesia. Tissue samples were fixed in 10% phosphate-buffered neutral formalin or in Bouin's solution and embedded in paraffin by routine procedures. Sections were cut at 5 μm and stained with hematoxylin and eosin (H&E). Selected sections also were stained with alcian blue-periodic acid Schiff (AB-PAS) and Masson's trichrome. Immunohistochemistry was performed by an avidin-biotin-peroxidase complex (ABC) method with the Vectastain ABC kit (Vector Laboratories). Lymph nodes and bone marrow were fixed in Bouin's fixative or 4% paraformaldehyde/0.1% glutaraldehyde. Sections were treated with 0.3% H2O2 in methanol to block endogenous peroxidase activity and incubated with a rat biotinylated monoclonal antibody (MoAb) to the B-lineage marker B220 (CD45R; 1:100; Boehringer Mannheim) or a rat MoAb to murine Mac-2, a galactose-specific lectin expressed on macrophages in response to specific differentiative signals36 (1:100; ATCC, Rockville, MD). The sections were used with the Vectastain kits reagents, 3,3′-diaminobenzidine-tetrahydrochloride as a chromogen and counterstained with hematoxylin.
Flow cytometric analysis (FCA).Single-cell suspensions of bone marrow cells, splenocytes, and thymocytes were prepared as previously described.37,38 Mature red blood cells in the spleen were removed using ACK lysing buffer (Quality Biological, Inc, Gaithersburg, MD). Cells were washed in Hanks' balanced salt solution and counted. Cell viability was greater than 90%. Immunofluorescence labeling of single-cell suspensions and FCA using a Becton Dickinson FACScan or FACSort (Becton Dickinson, San Jose, CA) were performed as previously described.37 B-lineage cells were detected using a phycoerythrin (PE)-conjugated MoAb to murine B220 (CD45R, clone RA3-6B2, rat IgG2a; PharMingen, San Diego, CA) combined with a fluorescein isothiocyanate (FITC)-conjugated affinity-purified goat antimouse IgM (μ heavy chain-specific) antiserum (FisherBiotech, Fisher Scientific, Orangeburg, NY) to detect immature and mature B cells. Total T cells were detected using a hamster MoAb to mouse CD3 (clone 500A2, IgG39 ) developed with FITC-conjugated affinity-purified goat antihamster IgG Ab (heavy and light chain-specific and mouse serum absorbed; Caltag Laboratories, South San Francisco, CA). T-cell subsets were detected with PE-conjugated rat MoAb to mouse CD4 (clone GK1.5; Becton Dickinson) and biotin-conjugated rat antimouse CD8 MoAb (clone 53-6.72; Becton Dickinson) developed with Streptavidin-RED670 (GIBCO-BRL, Life Technologies, Inc). Myeloid cells were labeled using biotin-conjugated rat antimouse GR1 MoAb that detects granulocytes (rat IgG2b , clone RB6-8C5; PharMingen) developed with Streptavidin-RED670 and combined with FITC-conjugated rat antimouse CD11b MoAb (Mac-1) that detects macrophages (clone M1/70; PharMingen). Erythroid-lineage cells were detected using PE-conjugated rat antimouse TER119 MoAb (PharMingen).
Southern blot of transgenic tail DNA. (A) Schematic representation of the DNA construct used for transgene derivation. (B) Southern blot analysis of transgenic lines. Tail DNA was extracted, digested with Bgl II, and analyzed by Southern blot as indicated in the Materials and Methods. Transgene levels were quantitated on a BioRad Scanning densitometer (BioRad, Richmond, CA) relative to the endogenous IFN-γ gene (upper band, all lanes).
Southern blot of transgenic tail DNA. (A) Schematic representation of the DNA construct used for transgene derivation. (B) Southern blot analysis of transgenic lines. Tail DNA was extracted, digested with Bgl II, and analyzed by Southern blot as indicated in the Materials and Methods. Transgene levels were quantitated on a BioRad Scanning densitometer (BioRad, Richmond, CA) relative to the endogenous IFN-γ gene (upper band, all lanes).
Colony-forming unit-culture (CFU-c) and CFU-granulocyte, erythroid, megakaryocyte, and macrophage colony (CFU-GEMM) assays.Bone marrow cells were flushed from the paired femurs and tibias of transgenic FVB/NCr mice and from their littermate controls using cold RPMI 1640 supplemented with 2% FCS (Biofluids, Rockville, MD), washed twice, and resuspended in α medium (GIBCO) that was supplemented with 20% FCS. Spleen cell suspensions were generated by gently pressing the spleen through a fine mesh screen and suspending the cells in RPMI 1640 containing 2% normal mouse serum, followed by two washes. Bone marrow or spleen cells were plated at 105 or 106 cells/mL, respectively, in 35-mm Lux petri dishes (Miles Laboratories, Inc, Naperville, IL) containing 1 mL of α-medium, 20% FCS, 1% L-glutamine, 2 × 10⁻⁴ mol/L hemin, 5 × 10⁻⁵ mol/L 2-ME (Sigma Chemical Co), 8 U/mL erythropoietin, 100 U/mL human rIL-3, and 0.05 mg/mL gentamicin in 0.35% Seaplaque agarose (FMC Bioproducts, Rockland, ME). Dishes were incubated at 37°C in 5% CO2 for 10 days, at which time the number of colonies was determined. Colonies composed of more than 50 cells were enumerated. Multipotential colonies containing granulocyte, erythroid, megakaryocyte, and macrophage lineages were scored as CFU-GEMM, whereas monocyte (CFU-monocyte [CFU-M]), myeloid (CFU-granulocyte [CFU-G]), erythroid (CFU-erythrocyte [CFU-e] and burst-forming unit-erythrocyte [BFU-e]), and myelomonocytic (CFU–granulocyte-macrophage [CFU-GM]) colonies were designated as CFU-c.40 The data are presented either as CFU per 1 × 10⁵ or 1 × 10⁶ cells from bone marrow or spleen, respectively. The total number of bone marrow CFU per mouse was calculated based on the total cellularity of paired femurs and tibias.
CFU-spleen (CFU-S) assay.FVB/NCr 8-week-old recipient mice were exposed to a total of 9.0 Gy of 137Cesium irradiation (dose rate, 23.2 cGy/min) delivered in two equal doses of 4.5 Gy administered 3 hours apart. Split-dose irradiation was used because more consistent results could be obtained. The CFU-S assay was performed by the intervenous injection of 4 × 10⁴ bone marrow cells from normal littermate control or transgenic mice into irradiated recipients. On days 8 and 12 after transplantation, the spleens from the recipients were removed and preserved in Tellesniczky's fixative and the number of macroscopically visible surface colonies (CFU-S) was counted.41
Statistical analysis.Statistical evaluations for the CFU assay data were performed using computer software (GraphPad Prism for Windows [version 2.0]; GraphPad Software, San Diego, CA). The significance of the differences between groups was evaluated by analysis of variance followed by two-tailed Student's t-test.
RESULTS
DNA construction and generation of the IFN-γ transgenic mouse.The transgene was constructed by inserting the murine Ig λ-chain enhancer into the Hpa I site present in the first intron of the murine IFN-γ genomic DNA (Fig 1). This enhancer was selected because it was initially thought to be specific for λ-producing B cells that appear late in B-cell differentiation and might thereby result in selective IFN-γ production in this subset of B-lineage cells and avoid interference with normal mouse development. This construct was injected into single-cell embryos from FVB/NCr mice. A Bgl II site present in the Ig λ-chain enhancer of the transgene but absent in the endogenous mouse IFN-γ gene resulted in two faster migrating bands detected by hybridization with IFN-γ cDNA compared with the slower migrating single band from the endogenous IFN-γ gene. The transgene was detected in three mice and quantitation by densitometric analysis showed that the mice contained 2, 6, or 8 copies of the transgene (Fig 1). These constructs were integrated into the germline, because F1 births also were found to contain the transgene. The results presented here were obtained from mice with 8 copies of the transgene; however, similar qualitative results were found in the 2- and 6-copy mice.
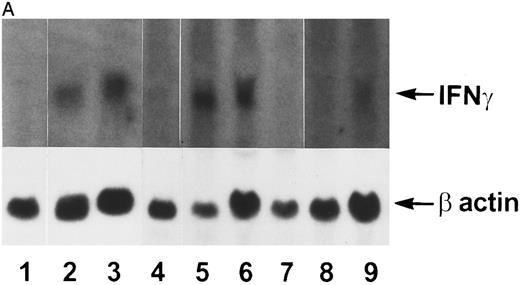
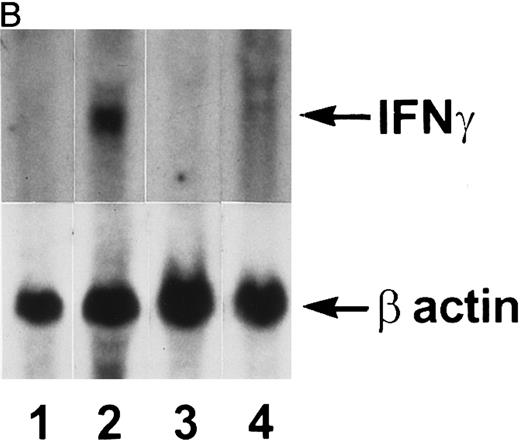
IFN-γ mRNA and protein are expressed in the bone marrow and thymus of IFN-γ transgenic mice.Total cellular RNA was extracted from bone marrow, spleen, thymus, liver, brain, and kidney and analyzed for IFN-γ mRNA expression. As shown in Fig 2A, IFN-γ hybridization was detected in the bone marrow (lanes 2 and 3) and thymus (lanes 5 and 6) of transgenic mice but not from normal (littermate) control mice (lane 1 and lanes 4 and 7, respectively). Very faint hybridization was observed in transgenic mouse spleen RNA (lane 9) compared with controls (lane 8). No hybridizing RNA was detected in liver, brain, or kidney (data not shown). Because both thymocytes and thymic stromal cells were contained in the whole thymus RNA extract in Fig 2A, an additional experiment was performed to determine which of these two components was the major contributor of the IFN-γ mRNA. Figure 2B shows that thymic stromal elements (lane 2) from transgenic mice had a greater expression of IFN-γ mRNA than did thymocytes (lane 4). Neither stromal elements nor thymocytes from littermate control mice expressed detectable levels of IFN-γ mRNA (lanes 1 and 3). Elevated levels of IFN-γ protein also was produced by the thymi and bone marrow of transgenic mice. The results in Table 1 show that thymi and bone marrow tissue from transgenic mice produced 115 ± 41 pg/mL and 86 ± 30 pg/mL of IFN-γ, respectively, in culture. In contrast, spleens from transgenic mice and thymi, bone marrow, and spleens from normal littermate controls failed to produce detectable levels of IFN-γ. Moreover, the serum from transgenic mice contained 165 ± 47 pg/mL of IFN-γ (n = 3) compared with normal littermate controls that had no detectable IFN-γ in their serum.
Northern blot analysis. Tissue RNAs were extracted and analyzed for IFN-γ mRNA after electrophoresis through a formaldehyde-agarose gel as described in the Materials and Methods. (A) Lane 1, normal bone marrow; lane 2, transgenic bone marrow; lane 3, transgenic bone marrow; lane 4, normal thymus; lane 5, transgenic thymus; lane 6, transgenic thymus; lane 7, normal thymus; lane 8, normal spleen; lane 9, transgenic spleen. (B) Lane 1, normal thymic stromal cells; lane 2, transgenic thymic stromal cells; lane 3, normal thymocytes; lane 4, transgenic thymocytes.
Northern blot analysis. Tissue RNAs were extracted and analyzed for IFN-γ mRNA after electrophoresis through a formaldehyde-agarose gel as described in the Materials and Methods. (A) Lane 1, normal bone marrow; lane 2, transgenic bone marrow; lane 3, transgenic bone marrow; lane 4, normal thymus; lane 5, transgenic thymus; lane 6, transgenic thymus; lane 7, normal thymus; lane 8, normal spleen; lane 9, transgenic spleen. (B) Lane 1, normal thymic stromal cells; lane 2, transgenic thymic stromal cells; lane 3, normal thymocytes; lane 4, transgenic thymocytes.
Production of IFN- γ by Thymus and Bone Marrow From Transgenic Mice
| Tissue . | Normal . | Transgenic . |
|---|---|---|
| Spleen | <26 | <26 |
| Thymus | <26 | 115 ± 41 |
| Bone marrow | <26 | 86 ± 30 |
| Tissue . | Normal . | Transgenic . |
|---|---|---|
| Spleen | <26 | <26 |
| Thymus | <26 | 115 ± 41 |
| Bone marrow | <26 | 86 ± 30 |
Manually dissociated spleens, thymi, and bone marrow from littermate controls (normal) or transgenic mice were individually cultured in 6-well plates with 3 mL of culture medium for 30 hours. After incubation, supernatants were removed and assayed for IFN-γ (in picograms per milliliter) by ELISA. Results represent the mean ± SD of three tissues per group.
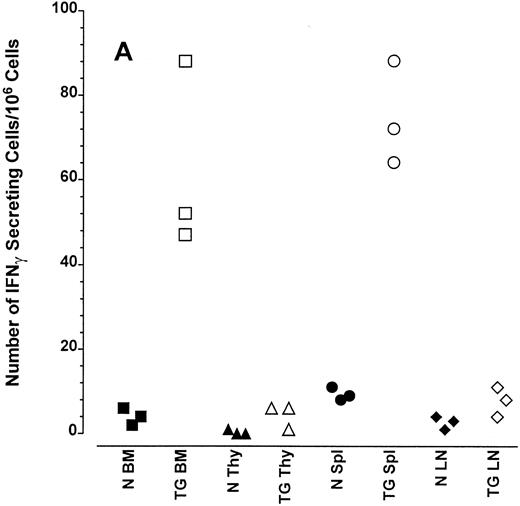
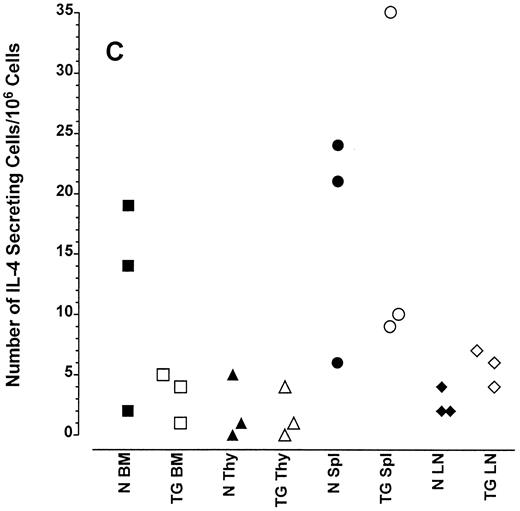
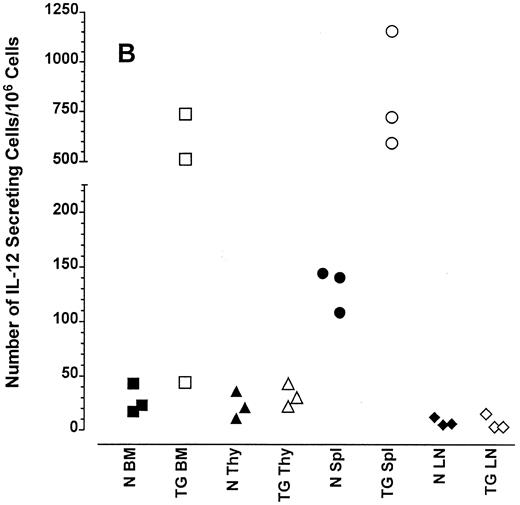
Altered frequency of cytokine-secreting cells in the central lymphoid organs of transgenic mice.ELIspot assays were used to detect and quantitate cells actively secreting IFN-γ in single-cell suspensions from the bone marrow, thymus, spleen, and lymph nodes of transgenic animals. As seen in Fig 3A, the frequency of cells spontaneously producing the type 1 cytokine IFN-γ was eightfold higher in the splenocytes and 15-fold higher in the bone marrow cells of transgenic mice than normal littermate controls. There was no significant increase in the frequency of IFN-γ–producing thymocytes from transgenic mice compared with littermate control thymocytes, which is consistent with the mRNA data in Fig 2B. Furthermore, the frequency of cells spontaneously secreting IL-12 were increased sixfold to 15-fold in the spleens of transgenic mice when compared with normal littermate controls (Fig 3B). The frequency of cells producing the type 2 cytokine IL-4 was more variable (Fig 3C). However, the ratio of IFN-γ– to IL-4–producing cells was greater in the spleens and bone marrow of transgenic mice (range, 1.8:1 to 52.0:1) compared with normal littermate controls (range, 1.0:1 to l:9.5; compare Fig 3A and C).
Frequency of cytokine secreting cells in transgenic mice versus normal littermate controls. ELIspot assays were used to determine the number of cells secreting IFN-γ (A), IL-12 (B), and IL-4 (C) in the bone marrow (BM), thymus (Thy), spleen (Spl), and mesenteric lymph nodes (LN) of transgenic mice (TG) and normal littermate controls (N). Results represent the individual frequencies of cytokine producing cells of 3 mice per group.
Frequency of cytokine secreting cells in transgenic mice versus normal littermate controls. ELIspot assays were used to determine the number of cells secreting IFN-γ (A), IL-12 (B), and IL-4 (C) in the bone marrow (BM), thymus (Thy), spleen (Spl), and mesenteric lymph nodes (LN) of transgenic mice (TG) and normal littermate controls (N). Results represent the individual frequencies of cytokine producing cells of 3 mice per group.
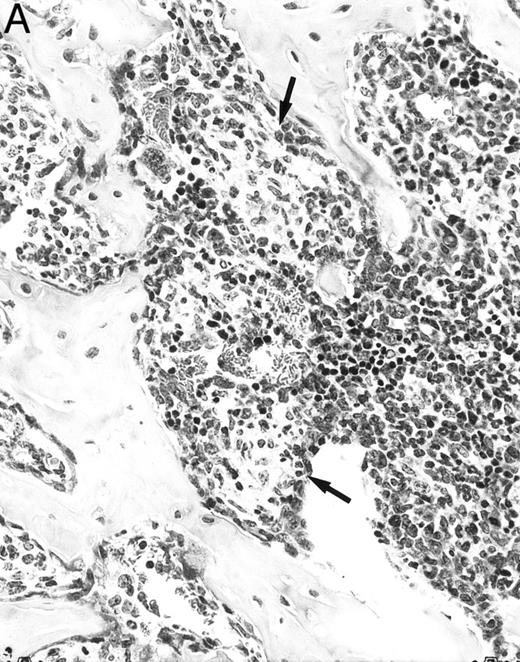
Histologic alterations occur in hematopoietic tissues of IFN-γ transgenic mice.Focal granulomatous lesions were seen in the bone marrow of many of the transgenic mice (Fig 4A) but not in control mice. These lesions were found to contain primarily Mac-2+ mononuclear cells (data not shown). In addition, the marrow cavities of IFN-γ transgenic mice contained residual degenerated cartilaginous masses in the metadiaphyseal (young) or diaphyseal (adult) parts primarily in long bones and ribs (Fig 4B). Moribund transgenic mice often had generalized or local secondary bacterial infectious lesions, including pyelonephritis, meningoencephalitis, endocarditis, bone marrow necrosis, arthritis, and uterine granulomas. Bacteria and bacterial colonies were often seen within the lesions.
Bone marrow alterations in IFN-γ transgenic mice. (A) Tibial bone marrow of a 3-month-old transgenic mouse showing granulomatous lesions (arrows) stained with H&E. The focal lesions were composed of clusters of histiocytes/macrophages (original magnification × 300; Bouin's fixed and paraffin-embedded section). (B) A rib of an 8-month-old transgenic mouse showing a cartilaginous mass in the marrow cavity attached to the cortical bone. Chondrocytes in the mass are degenerative. The mass is covered with a thin osseous layer. (Original magnification × 75; H&E; Bouin's fixed and paraffin-embedded section.)
Bone marrow alterations in IFN-γ transgenic mice. (A) Tibial bone marrow of a 3-month-old transgenic mouse showing granulomatous lesions (arrows) stained with H&E. The focal lesions were composed of clusters of histiocytes/macrophages (original magnification × 300; Bouin's fixed and paraffin-embedded section). (B) A rib of an 8-month-old transgenic mouse showing a cartilaginous mass in the marrow cavity attached to the cortical bone. Chondrocytes in the mass are degenerative. The mass is covered with a thin osseous layer. (Original magnification × 75; H&E; Bouin's fixed and paraffin-embedded section.)
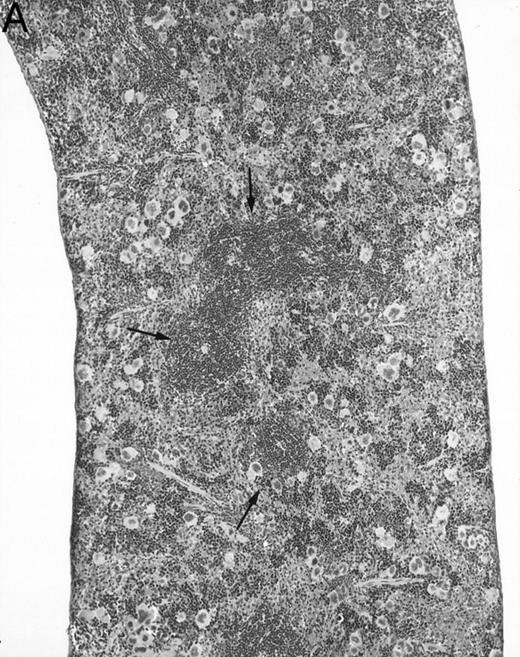
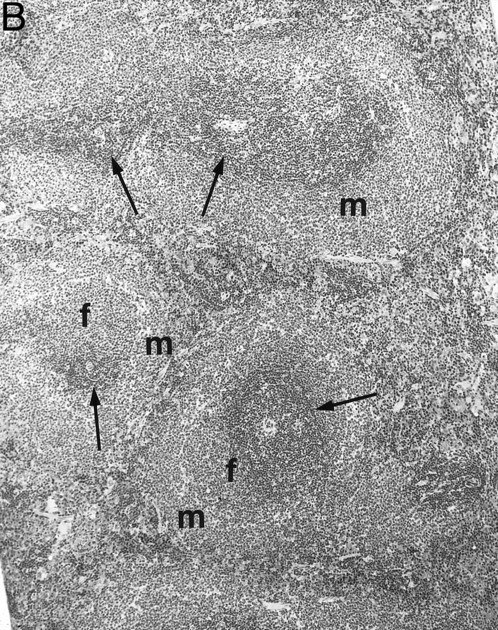
Gross examination of animals at all ages studied showed that transgenic mice had much smaller spleens than those of normal littermates. Histologically, the white pulp areas in the spleens of transgenic mice were composed only of the periarteriolar lymphocytic sheaths (PALS), whereas the primary follicles and outermost marginal zones that typically contain B cells and surround the PALS were absent (Fig 5).
Spleen of a 6-month-old transgenic (A) and an age-matched control (B) mouse. White pulp of the transgenic mouse is composed only of lymphocytes in the PALS (arrows), whereas those areas in control mice are composed of primary follicle (f ) and marginal zone (m). (Original magnification × 75; H&E; Bouin's fixed and paraffin-embedded section.)
Spleen of a 6-month-old transgenic (A) and an age-matched control (B) mouse. White pulp of the transgenic mouse is composed only of lymphocytes in the PALS (arrows), whereas those areas in control mice are composed of primary follicle (f ) and marginal zone (m). (Original magnification × 75; H&E; Bouin's fixed and paraffin-embedded section.)
Generally, the thymi of healthy transgenic mice were histologically normal. Moribund transgenic mice usually showed severe thymic atrophy, probably due to the stress of their illness. Macroscopically, intestinal Peyer's patches of transgenic mice were not readily seen. Histologically, no follicles were observed in Peyer's patches.
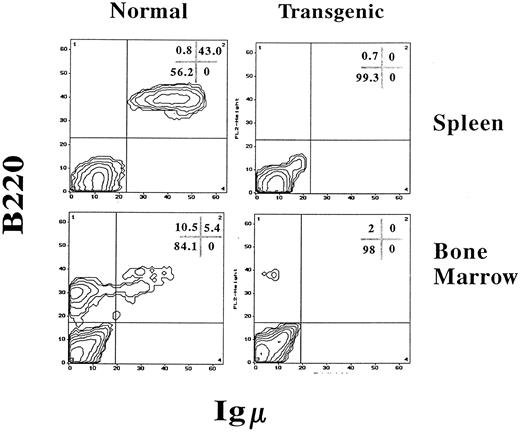
IFN-γ transgenic mice have a massive reduction in B-lineage cells and alterations in T-cell numbers.Because B-cell–dependent regions of the white pulp were absent in the spleens of transgenic mice, splenic B cells were quantitated using FCA. B-lineage cells were quantitated with two-color FCA using an MoAb that detects B220 (CD45R), a molecule present on both immature and mature B-lineage cells, and an antiserum that detects IgM, which is present on more mature B cells. As shown in Fig 6, spleens from normal control littermate mice had 43.0% B220+, IgM+ B cells. However, spleens from IFN-γ transgenic mice were virtually devoid of B-lineage cells. In addition, the total splenocyte numbers of transgenic mice were reduced by 70% compared with normal littermate controls due, in part, to the absence of B cells (Table 2). When analyzed by ELIspot assay, the number of spleen cells actively secreting IgM and IgG in transgenic mice was greater than 100-fold lower than in littermate controls (data not shown).
IFN-γ transgenic mice are virtually devoid of B-lineage cells in the bone marrow and spleen. Splenocytes or bone marrow cells from 2-month-old transgenic mice or normal littermate controls were labeled for immunofluorescence using PE-conjugated B220 (detects B-lineage cells) and FITC-conjugated goat antimouse IgM (detects immature and mature B cells) and analyzed by FCA. The values in the corner grids indicate the percentage of cells in each quadrant.
IFN-γ transgenic mice are virtually devoid of B-lineage cells in the bone marrow and spleen. Splenocytes or bone marrow cells from 2-month-old transgenic mice or normal littermate controls were labeled for immunofluorescence using PE-conjugated B220 (detects B-lineage cells) and FITC-conjugated goat antimouse IgM (detects immature and mature B cells) and analyzed by FCA. The values in the corner grids indicate the percentage of cells in each quadrant.
Phenotypic Analysis of Splenocytes, Thymocytes, and Bone Marrow Cells in IFN-γ Transgenic Mice
| Tissue . | Phenotype . | Normal . | Transgenic . | ||
|---|---|---|---|---|---|
| . | . | % . | No. (×10−6) . | % . | No. (×10−6) . |
| Spleen | CD3+ | 54.6 ± 5.2 | 57.1 ± 10.3 | 92.4 ± 1.6* | 28.9 ± 3.0† |
| CD4+ (CD8−) | 42.7 ± 4.6 | 44.7 ± 9.9 | 71.7 ± 2.8* | 22.5 ± 2.9† | |
| CD8+ (CD4−) | 10.8 ± 1.8 | 11.1 ± 0.9 | 19.4 ± 1.2‡ | 6.1 ± 0.2* | |
| Mac-1+, GR1+ | 2.3 ± 0.7 | 2.4 ± 0.8 | 4.0 ± 1.1 | 1.2 ± 0.2 | |
| Mac-1+, GR1− | 2.1 ± 0.4 | 1.9 ± 0.2 | 0.7 ± 0.2‡ | 0.2 ± 0.0* | |
| TER119+ | 0.2 ± 0.0 | 0.2 ± 0.0 | 1.2 ± 5.8 | 0.2 ± 0.0 | |
| Thymus | CD4−, CD8− | 5.4 ± 0.7 | 4.7 ± 0.8 | 4.2 ± 5.8 | 4.7 ± 1.4 |
| CD4+, CD8+ | 68.6 ± 3.3 | 60.7 ± 10.1 | 55.0 ± 2.0‡ | 63.0 ± 10.6 | |
| CD4+, CD8− | 21.0 ± 2.4 | 18.5 ± 3.4 | 30.9 ± 1.1‡ | 35.3 ± 9.0† | |
| CD4−, CD8+ | 5.0 ± 0.2 | 4.4 ± 0.7 | 9.9 ± 0.9* | 11.2 ± 2.9† | |
| Bone marrow | CD3+ | 1.3 ± 0.2 | 0.4 ± 0.0 | 8.3 ± 1.1* | 1.3 ± 0.1* |
| CD4+ (CD8−) | 1.2 ± 0.1 | 0.3 ± 0.1 | 3.6 ± 0.4* | 0.6 ± 0.1† | |
| CD8+ (CD4−) | 0.3 ± 0.0 | 0.1 ± 0.0 | 2.9 ± 0.4‡ | 0.4 ± 0.0* | |
| Mac-1+, GR1+ | 44.7 ± 13.1 | 13.2 ± 4.2 | 69.2 ± 6.1† | 10.5 ± 1.2 | |
| Mac-1+, GR1− | 0.6 ± 0.2 | 0.6 ± 0.8 | 0.4 ± 0.3 | 0.1 ± 0.0 | |
| TER119+ | 23.6 ± 5.1 | 6.9 ± 1.5 | 22.4 ± 2.0 | 3.5 ± 1.1† | |
Cells from the bone marrow, thymus, and spleen of 3-month-old FVB/NCr IFN-γ transgenic mice or littermate controls were examined for the percentage and number of cells contained within various phenotypic subsets using immunofluorescence labeling and FCA. The number of cells bearing a specific marker was calculated by multiplying the percentage of cells in a particular subset by the total number of cells in the tissue. The values are expressed as the mean ± SD of 3 mice/group. The total number of cells/tissue for normal littermate controls or transgenic mice, respectively, were as follows: bone marrow (1 femur and 1 tibia/mouse), 29.3 × 10⁶ ± 1.0 × 10⁶, 15.3 × 10⁶ ± 2.8 × 10⁶; thymus, 88.3 × 10⁶ ± 13.4 × 10⁶, 114.3 × 10⁶ ± 31.4 × 10⁶; and spleen, 104.3 × 10⁶ ± 13.7 × 10⁶, 31.3 × 10⁶ ± 2.7 × 10⁶.
Significantly different (P < .001) from normal littermate controls.
Significantly different (P < .05) from normal littermate controls.
Significantly different (P < .01) from normal littermate controls.
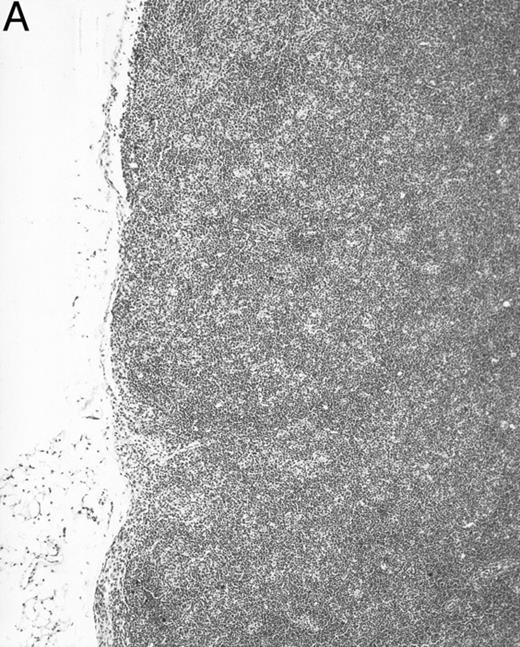
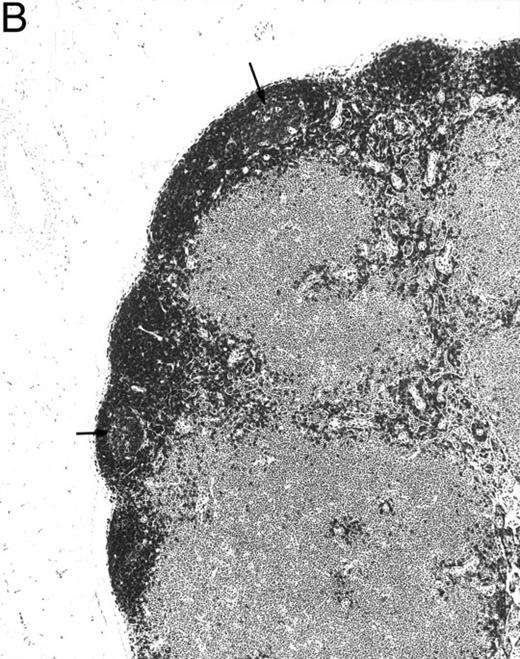
Bone marrow from control mice contained 10.5% progenitor and precursor B cells (B220dull, IgM−) and 5.4% immature and mature B cells (B220dull and bright, IgM+; Fig 6). In contrast, transgenic mouse bone marrow was severely deficient in B-lineage cells as identified by B220 expression (Fig 6). Lymph nodes lacked primary follicles and germinal centers and B220+ B-lineage cells were not found in any part of the tissue (Fig 7A). However, normal littermate controls contained B220+ cells within the primary follicles, germinal centers, cortex, and medulla of the lymph nodes (Fig 7B).
B220 immunoreactivity in mesenteric lymph nodes of a 4-month-old transgenic mouse (A) and a control littermate (B). No follicle structures and no B220-immunoreactive cells are observed in the transgenic mouse. The control mouse has follicles with germinal centers (arrows) immunoreactive for B220. (Original magnification × 75; PGC-fixed and paraffin-embedded section; ABC immunohistochemistry; hematoxylin.)
B220 immunoreactivity in mesenteric lymph nodes of a 4-month-old transgenic mouse (A) and a control littermate (B). No follicle structures and no B220-immunoreactive cells are observed in the transgenic mouse. The control mouse has follicles with germinal centers (arrows) immunoreactive for B220. (Original magnification × 75; PGC-fixed and paraffin-embedded section; ABC immunohistochemistry; hematoxylin.)
Additional FCA was performed on tissues from transgenic mice to determine whether expression of IFN-γ had effects on the numbers of cells contained in other leukocyte populations. Because of the absence of B cells, greater than 90% of the splenocytes from transgenic mice were T cells, as indicated by the expression of CD3 (Table 2). However, spleens from transgenic mice had a 50% decrease in T-cell (CD3+) numbers (28.9 × 10⁶ ± 3.0 × 10⁶) compared with normal littermate control mice (57.1 × 10⁶ ± 10.3 × 10⁶). The reduction in T-cell number occurred in both the CD4+ and the CD8+ T-cell subsets.
Analysis of the thymus showed a twofold increase in the percentage and number of cells in the CD4+, CD8− and CD4−, CD8+ subsets (Table 2). In contrast, the number of CD4+, CD8+ thymocytes in transgenic mice was equivalent to controls. Although there was a decrease in the percentage of CD4+, CD8+ thymocytes in transgenic mice, this simply reflected the increase in the CD4 and CD8 single-positive thymocytes.
There also were partial changes in the percentages and/or numbers of myeloid and erythroid cells as detected by the phenotypic markers Mac-1 and GR1 or TER119, respectively, in the bone marrow and spleen of IFN-γ transgenic mice (Table 2).
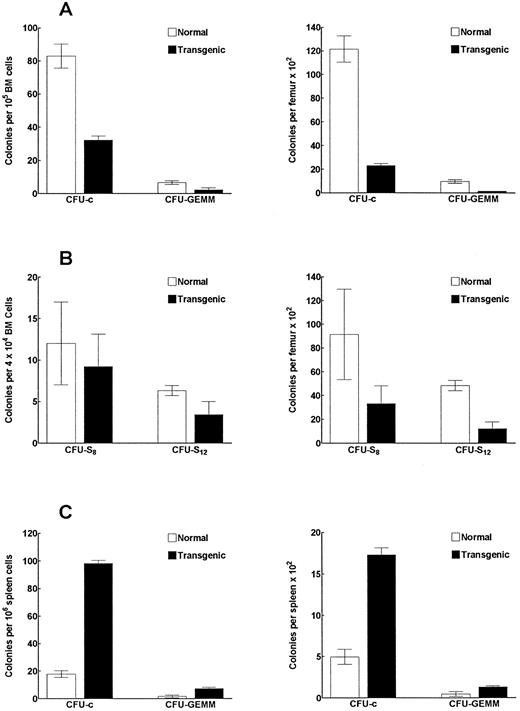
IFN-γ transgenic mice have reduced numbers and frequencies of bone marrow myeloid progenitor cells.We observed a 51% decrease in bone marrow cellularity (P < .002; determined by counting cells flushed from the femurs and tibias) in transgenic mice compared with littermate controls. In Fig 8A, bone marrow colony-forming assays showed a 60% and 81% decrease (P < .001) in the frequency and number, respectively, of single-lineage myeloid progenitors (CFU-c). More immature multilineage myeloid progenitors (CFU-GEMM) also were reduced both in frequency and in number in transgenic mouse bone marrow by 66% and 84% (P < .001), respectively, compared with controls. In contrast, the frequency and number of CFU-c and CFU-GEMM colonies in the spleen were significantly increased (Fig 8C). The frequency of CFU-c and CFU-GEMM colonies were increased by 5.6-fold and 4.4-fold (P < .001), respectively, over that of the littermate controls. Similarly, we found a 3.5-fold and a 2.8-fold increase (P < .001), respectively, in the total number of CFU-c and CFU-GEMM in the spleen compared with control mice. These data suggest that the increased number of myeloid progenitors in the spleen might be at least partially due to enhanced migration of these progenitors from the bone marrow to peripheral organs. The analysis of late primitive myeloid progenitors (CFU-S8 assay) in transgenic mouse bone marrow showed a significant (P < .002) 64% decrease in the total number of these progenitors in the bone marrow (Fig 8B). The analysis of early primitive myeloid progenitors (CFU-S12 ) showed that the frequency and the total number of these progenitors were reduced by 54% (P < .02) and 75% (P < .001), respectively, in the bone marrow of transgenic mice (Fig 8B).
IFN-γ transgenic mice have altered frequencies and numbers of myeloid progenitor cells. Bone marrow cells (A) or spleen cells (C) from transgenic or control mice were assayed to determine the frequency (left graph) and total number (right graph) of CFU-c– and CFU-GEMM–producing myeloid progenitors. (B) Bone marrow cells from transgenic or control mice were also assessed for the frequency and number of CFU-S progenitors. The data represent the mean ± SD of three replicates per group.
IFN-γ transgenic mice have altered frequencies and numbers of myeloid progenitor cells. Bone marrow cells (A) or spleen cells (C) from transgenic or control mice were assayed to determine the frequency (left graph) and total number (right graph) of CFU-c– and CFU-GEMM–producing myeloid progenitors. (B) Bone marrow cells from transgenic or control mice were also assessed for the frequency and number of CFU-S progenitors. The data represent the mean ± SD of three replicates per group.
DISCUSSION
Although T cells and NK cells are the major producers of IFN-γ in vivo and in vitro,5,6 other leukocytes such as B cells have been shown to transcribe IFN-γ mRNA and produce IFN-γ protein.8 It was the purpose of this study to determine whether enhanced IFN-γ production by B cells in vivo would result in a skewing of Ab subclasses to those dependent on IFN-γ and to determine the role of IFN-γ produced by B cells on leukocyte differentiation and function. Therefore, we attempted to target B cells for increased IFN-γ production by using the λ-chain enhancer (shown to be more specific for B cells than the heavy chain enhancer27 28 ) in our IFN-γ transgenic mice. Surprisingly, the use of this construct to generate IFN-γ transgenic mice resulted in a virtual absence of B-lineage cells as detected by the absence of surface B220+ or Ig+ cells and a greater than 100-fold reduction in the number of Ig-secreting lymphocytes in these animals. Increased numbers of IFN-γ–producing cells were observed in the bone marrow and other lymphoid organs. As a likely consequence of this IFN-γ production, increased numbers of IL-12–secreting cells also were observed. Studies are underway to use FCA analysis to identify the IFN-γ– and IL-12–producing cells; they have not yet been successful. However, the data presented showing increased IFN-γ mRNA and protein expression (Fig 2A and Table 1, respectively) in total thymus from transgenic mice, compared with the ELIspot data on thymocyte suspensions (Fig 3A), suggest that stromal elements may be producing the elevated levels of IFN-γ in the thymus of transgenic mice. This possibility is supported by the results in Fig 2B that show that the bulk of the IFN-γ mRNA in the thymus of transgene mice was contained in the stromal elements.
Although our Northern blot data show that IFN-γ mRNA levels were significantly less in spleen compared with bone marrow, the ELIspot data show equal numbers of cells producing IFN-γ in these two tissues. This difference can be explained by the fact that the ELIspot assay detects IFN-γ production in cells that are producing ≥85 to 100 molecules/second.42 Therefore, one possibility is that many of the transgenic bone marrow cells are producing less than 85 to 100 molecules/second and thus remain undetected in the ELIspot assay, whereas the majority of the spleen cells produce IFN-γ at levels detectable by this assay. In contrast, Northern blot analysis detects the sum total amount of IFN-γ mRNA in the organ regardless of the amount present per individual cell. In addition, the relative increase in secreting cell numbers in the Elispot assay was higher in the bone marrow (15-fold) than in the spleen (8-fold; consistent with mRNA expression). Although the mechanism by which the λ enhancer element promotes the increased IFN-γ production has not yet been defined, transgenic mice produced with the same genomic DNA construct minus the λ enhancer do not have any lymphoid cell number abnormalities (C. Wilson, personal communication, March 1996), supporting a role for this enhancer in altering IFN-γ expression. However, regardless of the specific mechanism of enhancer action, the phenotype and biologic consequences of increased IFN-γ production in this animal are both surprising and of great interest. Preliminary FCA data show that, if the few B220+ cells present in the bone marrow of IFN-γ transgenic mice are of the B-cell lineage, they are arrested before the expression of the BP-1 antigen (unpublished observations). Alternatively, some of these B220+ cells may represent natural killer (NK) cells, because a subpopulation of B220+ cells in murine bone marrow contains NK progenitors.43 Furthermore, PCR analysis of bone marrow DNA using 5′ V-region, 5′ DH , and 5′ JH primers in conjunction with 3′ JH4 primers shows that low levels of DH and JH rearrangements can be detected but not VH to DHJH rearrangements (manuscript in preparation). Thus, the B cells appear to be arrested as early pro-B cells (B220+, CD43+, HSAlow, BP-1−) as defined by Hardy et al.44 Preliminary bone marrow transplantation experiments show that sublethally irradiated normal animals that receive bone marrow from these transgenic mice also are deficient in donor-origin B cells, suggesting that B-lineage precursor cells, not the developmental milieu, may be defective. Studies designed to rescue the B-cell population in this mouse via the injection of anti–IFN-γ/anti–IFN-γ receptor Ab are underway, but have not yet been successful.
In an effort to expand any B-cell precursors contained in the remaining B220+ cells present in the bone marrow, we have administered IL-7, a potent pre-B–cell growth factor45 to these transgenic mice in a manner similar to that described in our previous work with IL-7.46 Examination of the spleen and bone marrow of IL-7–treated transgenic mice using FCA detected no increase in the numbers of B220+ cells. In contrast, control mice had large increases in B220+, IgM− cells in the bone marrow and spleen. Therefore, if the few B220+ cells in the transgenic mice contain B-lineage cells, they are either unable to respond to IL-7 or they respond but die soon thereafter, resulting in no net increase in B220+ cells.
One hypothesis for the lack of B cells in these IFN-γ transgenic mice is that the B-cell loss is a consequence of the expression of IFN-γ in the pro-B–cell population, resulting in rapid apoptosis of the cells via intracellular or autocrine/paracrine effects of IFN-γ or IFN-γ–induced cytokines. This possibility is supported by previous work showing that murine pre-B cells undergo apoptosis in vitro in response to IFN-γ47,48 and that the 412-bp λ-chain enhancer used in these studies is active in pre-B cell lines (U. Storb, personal communication, January 1994). In addition, Garvy and Riley49 have shown that IFN-γ abrogates IL-7–dependent proliferation of pre-B cells that coincides with the onset of apoptosis.
Another possible hypothesis to explain the loss of B cells is that the IFN-γ production has resulted in enhanced macrophage scavenging of the B-cell population. This scavenging is an important macrophage function in the bone marrow, as has been elegantly described by Osmond et al.50 Consistent with this possibility is the observation that the bone marrow macrophages in these IFN-γ transgenic mice appear to be primed in that they require only lipopolysaccharide for inducible nitric oxide synthase (iNOS) expression (manuscript in preparation). Further studies using in situ hybridization combined with surface marker staining will be required to dissect these possible mechanisms. We also cannot rule out the possibility that other as yet unidentified proteins, induced as a consequence of the IFN-γ expression, are responsible for the paucity of B-lineage cells.
The effects on T-cell development in these IFN-γ transgenic mice are less obvious than the B-cell effects. The increased IFN-γ expression in the bone marrow, thymus, and other lymphoid organs may be a consequence of the increased IFN-γ copy number or due to some as yet unknown effects that the λ-chain core enhancer may have on the IFN-γ promoter. The increase in the numbers of cells contained in the CD4+,CD8− and CD4−,CD8+ thymic subsets suggests that aberrant IFN-γ expression in the thymus may result in enhanced expansion or inefficient exportation of these more mature thymic subsets. Inefficient exportation also could explain the reduction of T-cell number in the spleens of these transgenic mice. The correlation between thymic expression of IFN-γ and alterations in subset phenotype is supported by studies in Down's syndrome individuals. Thymi from these individuals have a constitutive expression of IFN-γ and TNF-α mRNA and altered proportions of thymic subsets and may have inefficient release of mature TcR α,β T cells into the periphery.51-54
The results show that the IFN-γ transgenic mice have an increased expression of IFN-γ and that the frequency of IFN-γ– and IL-12–producing cells are increased. This increased frequency could be due to an increase in the proportion of certain leukocyte subsets that produce these cytokines. However, it is likely that this is only a partial explanation. For example, the bone marrow has a 15-fold increase in the frequency of IFN-γ cells, yet the proportion of T cells increases only sixfold and Mac-1+ cells actually decrease by 50%. The λ-chain enhancer also may be influencing a particular cell's production of IFN-γ. Whereas cells from the transgenic mice are skewed towards the spontaneous production of type 1 cytokines, they also are capable of spontaneously producing IL-4. It will be of interest to determine if predominant Th1 or Th2 populations arise after immunization of these animals with specific antigens. It may be that the increased IFN-γ copy number may result in a shift of the T-cell population towards a Th1 phenotype. The increase in IL-12–producing cells also is of particular interest. Although IFN-γ itself does not by itself induce IL-12 production, it has been observed that IFN-γ can synergize with IL-2 and induce IL-12 production by human monocytes (I. Espinoza-Delgado, personal communication, August 1996). Thus, it is likely that bone marrow expression of IL-2 (or possibly IL-15) synergizes with the bone marrow IFN-γ and is responsible for the IL-12 expression.
There are no clinical conditions that mimic the loss of B cells as seen in these IFN-γ transgenic mice. However, other transgenic mice that lack B cells have been reported, although the stages at which B-cell development is blocked differ in these various models.55-57 Additionally, increased bone marrow expression of IFN-γ has been observed in aplastic anemia and is thought to be a factor in disease progression.58 The fact that the IFN-γ transgenic mice had reduced numbers of CFU-c and CFU-GEMM colonies that could be cultured from the bone marrow further support a negative role for IFN-γ during bone marrow differentiation. The in vivo consequences of bone marrow expression of IFN-γ are supported by in vitro studies. It has been shown in vitro that IFN-γ is a very potent inhibitor of myeloid colony formation.59,60 It has been further noted that IFN-γ preferentially inhibits proliferation rather than the commitment of granulocyte-macrophage progenitors from mouse bone marrow.61 In contrast, other studies reported a bifunctional potential of IFN-γ on murine hematopoietic progenitors. Specifically, it has been found that IFN-γ acts synergistically with stem cell factor to increase the growth of primitive and mature progenitors, whereas it inhibits IL-3–dependent GM colony formation.62 Because of this finding, it will be of interest to determine if expanded progenitor populations of Sca-1+/Lin− and c-kit+/Lin− cells are present in the spleen and bone marrow of transgenic mice. If so, these mice might serve as a unique model to dissect the consequences of constitutive IFN-γ expression on numerous hematologic events in the bone marrow, including progenitor development and maturation. Our preliminary data on very immature progenitors (CFU-S8 ) suggest that these cells and probably some subpopulations of stem cells were not altered by overexpression of the IFN-γ gene. The CFU-S assay detects the capacity of hematopoietic progenitors to home into and form macroscopic colonies in the spleens of lethally irradiated animals. CFU-S12 represents a more immature subset of progenitors than CFU-S8 .63-65 Long-term repopulating ability of hematopoietic stem cells corresponds poorly with the CFU-S assay, suggesting that cells forming CFU-S represent predominantly progenitors with a certain lineage commitment.66-69 Therefore, experiments focused on stem cells as well as the interactions of IFN-γ with other growth factors are in progress. Despite the reductions in myeloid progenitor frequency and number in the bone marrow, the number of mature myeloid cells in transgenic mice appears to be relatively unaffected. This may be due to the ability of the increased frequency and number of myeloid progenitors in the spleen to adequately compensate for the bone marrow reductions.
We have observed that older transgenic animals (20 to 26 weeks) tend to die of nonspecific bacterial infections of the kidneys and other tissues, and preliminary analysis has identified Proteus morganii as at least one of the infectious micro-organisms. The reasons for this are unclear, especially because the animals are housed in isolator cages and other immunodeficient animals housed in the same facility do not generally die in a similar manner. It is possible that the apparent decreased NK activity seen in these animals (data not shown) is at least partially responsible for this susceptibility to infection or that the macrophages in these animals are somehow altered. Furthermore, production of prostaglandins by activated macrophages could at least partially explain the observed decrease in NK activity. Studies are currently underway to measure macrophage function and to determine if these animals are more sensitive to bacterial endotoxins.
In summary, thymus and bone marrow expression of murine IFN-γ has resulted in the development of a line of transgenic mice that lack mature B cells and B-cell precursors, have reduced T-cell numbers, and have altered hematologic differentiation. These animals are thus a novel in vivo model for analyzing the consequences of abnormal IFN-γ expression on immune system development and maturation.
ACKNOWLEDGMENT
The authors thank Dr U. Storb (University of Chicago) for the murine λ-chain enhancer, Dr C. Wilson (University of Washington, Seattle, WA) and Dr I. Espinosa-Delgado for providing unpublished information, Drs D. Longo and S. Durham for critical review of this manuscript, DNAX Inc for the murine IFN-γ cDNA, H. Rager and E. Johnson (Clinical Immunology Services, SAIC Frederick, NCI-FCRDC), and S. Charbonneau and J. Vincent for typing and editing this manuscript.
The contents of this publication do not necessarily reflect the views or policies of the Department of Health and Human Services, nor does mention of trade names, commercial products, or organizations imply endorsement by the US Government.
Animal care was provided in accordance with procedures outlined in the “Guide for the Care and Use of Laboratory Animals” (NIH Publ. No. 86-23, 1985).
Address reprint requests to Howard A. Young, PhD, NCI-FCRDC, Bldg 560, Room 31-93, Frederick, MD 21702-1201.



This feature is available to Subscribers Only
Sign In or Create an Account Close Modal