Abstract
The proliferative responsiveness of granulocyte colony-stimulating factor (G-CSF )–mobilized blood was studied in uni-directional mixed leukocyte cultures. Unfractionated mononuclear cells from mobilized blood obtained by leukapheresis at day 4 after initiation of G-CSF (G-PBMC) were hyporesponsive (31.5% ± 9.2% response, P = .003) compared to mononuclear cells obtained from the peripheral blood before administration of G-CSF (preG-PBMC). There was great variability among donors when purified preG- and G-CD4 cells were compared. In eight of 10 donors, G-CD4 cells were equally responsive or moderately hyporesponsive; in two of 10 donors, G-CD4 cells were more strikingly hyporesponsive. CD14 cells derived from leukapheresis products (G-CD14 cells) suppressed alloantigen-induced proliferation by 48.6% ± 7.5% when added to preG-PBMC or preG-CD4 cells at responder-CD14 ratios of 2:1 (P < .001). Suppression was evident (14.4% ± 5.0%) even at responder-CD14 ratios of 8:1 and was largely contact-independent. PreG- and G-CD14 cells had equivalent potency in suppressing proliferative responses. Given that G-CSF–mobilized blood cell grafts contain 50-fold more CD14 cells and only 10-fold more T cells than marrow, we propose that suppression of donor T cells by the large proportion of monocytes present in leukapheresis products could contribute to the unexpectedly low incidence and severity of graft-versus-host disease after peripheral blood stem cell transplantation.
GRANULOCYTE colony-stimulating factor (G-CSF ) mobilized peripheral blood mononuclear cells (G-PBMC) have been widely used for autologous hematopoietic reconstitution after myeloablative therapy.1-3 The rapidity of engraftment and the ease of harvest have made this stem cell source a very attractive alternative to autologous marrow. In allogeneic transplantation, the use of G-PBMC has followed a much slower pace because of concern that the large number of T cells in G-PBMC could increase the incidence and severity of graft-versus-host disease (GVHD).4-7 Based on early clinical reports,8-12 however, the incidence and severity of acute GVHD were not worse than observed with unmodified marrow.
The unexpectedly low incidence of GVHD after allogeneic G-PBMC transplantation can be interpreted in several ways. First, the correlation between T-cell number and risk of GVHD might not be linear such that an increase above the numbers present in aspirated marrow confers no additional risk. Second, G-CSF treatment of normal donors might alter T-cell function as suggested recently by studies showing a polarization of murine T cells toward type-2 cytokine production after treatment of the donor with G-CSF.13 Third, G-PBMC could contain populations capable of suppressing allogeneic T-cell responses. Previously published data indicate that there are significant differences in both the absolute and relative numbers of CD14 and CD4 cells in G-PBMC compared to marrow.14 Given that the cells from both sources could have comparable function, differences in clinical outcome might be attributed to these quantitative variables. However, the potential for qualitative differences remains. To address this issue, functional comparisons were made between PBMC obtained before and during treatment of the donor with G-CSF. Our results suggest that suppression of donor T-cell responses by large numbers of monocytes and monocyte progenitors in leukapheresis products could contribute to the unexpectedly low incidence of GVHD following HLA-identical G-PBMC transplantation.
MATERIALS AND METHODS
Donors, G-CSF–mobilization, and PBMC processing.Samples were collected after written informed consent using forms approved by the Institutional Review Board of the Fred Hutchinson Cancer Research Center (Seattle, WA). Donors were treated by subcutaneous injection with rhG-CSF (Amgen, Inc, Thousand Oaks, CA) at a dose of 8 μg/kg twice daily for 4 to 7 days. Leukapheresis was performed using a continuous flow blood cell separator (Cobe Laboratories, Lakewood, CO) on 2 consecutive days beginning on day 4 of rhG-CSF administration. Heparinized peripheral blood (PB) samples obtained before the first administration of G-CSF (preG) and samples from the first leukapheresis (G) were used for comparative experiments. PreG-PBMC were isolated over Ficoll (Accu-Prep; Accurate Chemicals, Westbury, NY; 1.077 g/mL) step gradients, hemolysed (ammonium chloride 150 mmol/L; sodium bicarbonate 12 mmol/L) and washed three times in Hanks' balanced salt solution (HBSS)/1% bovine serum albumin (BSA). G-PBMC were suspended in HBSS/1% BSA and centrifuged at 200g for 10 minutes to remove platelets. All cells were cryopreserved to allow simultaneous testing.
Isolation of CD4 and CD14 cells by fluorescence-activated cell sorting (FACS).Cells were stained with LeuM3 (anti-CD14-phycoerythrin [PE]; Becton Dickinson, San Jose, CA) and Leu-3a (anti-CD4-fluorescein isothiocyanate [FITC]; Becton Dickinson). Staining for both CD14 and CD4 allowed clear separation of populations and minimized cross-contamination, since some CD14 cells coexpress CD4. After incubation with antibody conjugates for 20 minutes on ice, cells were washed twice in HBSS/1% BSA and sorted as described previously.14 Purity of CD4 and CD14 cells was always greater than 97% after sorting. Cells were counted, resuspended in RPMI 1640 medium supplemented with 15% pooled human serum, penicillin (100 U/mL), and streptomycin sulfate (100 μg/mL). Viability always exceeded 95% as determined by trypan blue exclusion.
Immunofluorescent staining and flow cytometric analysis.Cells were stained with Leu-3a (anti-CD4-PE, Becton Dickinson) plus 25.3 (anti-CD11a-FITC, Immunotech, Westbrook, ME), Leu-28 (anti-CD-28-FITC, Becton Dickinson), or Leu-5b (anti-CD2-FITC, Becton Dickinson). Additional samples were stained with LeuM3 (anti-CD14-PE, Becton Dickinson) plus 84H10 (anti-CD54-FITC, Immunotech), anti-HLA-DR-FITC (Becton Dickinson), MAB104 (anti-CD80[B7/BB1]-FITC, Immunotech), FUN-1 (anti-CD86[B70/B7-2]-FITC, Pharmingen, San Diego, CA), or AICD58 (anti-CD58-FITC, Immunotech). Samples were analyzed with use of a FACScan (Becton Dickinson) flow cytometer. At least 10,000 CD4 or CD14 events were collected to analyze staining intensity with the FITC-conjugated antibody. Isotype-matched antibodies of irrelevant specificity were used as negative controls.
Mixed leukocyte cultures (MLC).Cultures were established in round-bottom 96-well plates (Costar, Cambridge, MA). Responder PBMC (5.0 to 1.25 × 10⁴) or sorted CD4 cells (2.5 to 0.625 × 10⁴) were cultured with 1.0 × 10⁵ irradiated (30 Gy), allogeneic, DR-mismatched PBMC stimulators in 200 μL RPMI 1640 medium supplemented with 15% pooled human serum, L-glutamine (0.4 mg/mL), penicillin (100 U/mL), and streptomycin (100 μg/mL). In some experiments, fetal calf serum (FCS) (15%) was used instead of human serum. At 120 hours, cultures were pulsed with 3H-thymidine (1.0 μCi/well) for the final 18 hours. For monocyte-suppression studies, sorted CD14 cells were added to the cultures on day 0. At 138 hours, cells were harvested on glass fiber filters, and 3H-thymidine incorporation was measured by liquid scintillation counting.
Polyclonal stimulation assay (immobilized anti-CD3 plus interleukin-2 [IL-2]).Flat-bottom 96-well plates (Costar) were precoated overnight at 4°C with monoclonal antibody 38.1 (anti-CD3; IgM)15 at concentrations up to 10 μg/mL in bicarbonate buffer (pH 9.6). Plates were washed three times with HBSS/1%BSA before adding cells. Sorted preG- and G-CD4 cells were suspended in RPMI/15% FCS containing 10 IU/mL recombinant human IL-2 (R&D Systems, Minneapolis, MN) and seeded at 2.5 to 0.625 × 10⁴ cells per well. At 72 hours, cultures were pulsed with 3H-thymidine for the final 18 hours.
Evaluation of contact requirements for monocyte-suppression.To analyze whether suppression of T-cell proliferation by CD14 cells required direct contact, cultures were established in 24-well plates (Costar). To adjust for increased surface area and volume, 2.5 × 10⁵ preG-PBMC responders were cultured with 5.0 × 10⁵ irradiated (30 Gy) allogeneic, DR-mismatched PBMC stimulators on 0.45 μm-micropore membranes (Millicell-CM; Millipore, Bedford, MA). G-CD14 cells (2.5 × 10⁵) were added to responders and stimulators on the membrane or were separated by placing them under the inserts on the bottom of the well. Wells without CD14 cells added were used as controls. Cells were pulsed, procured, and counted as described above.
RESULTS
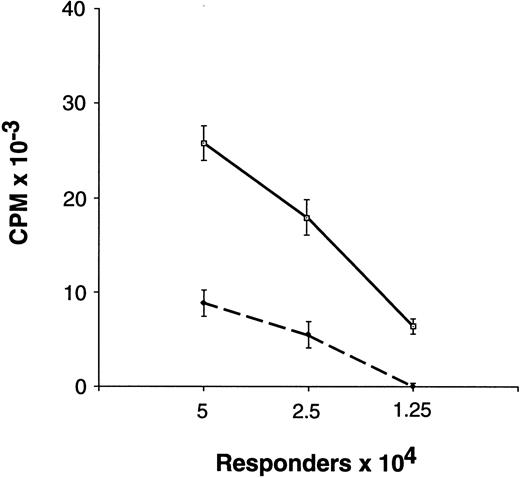
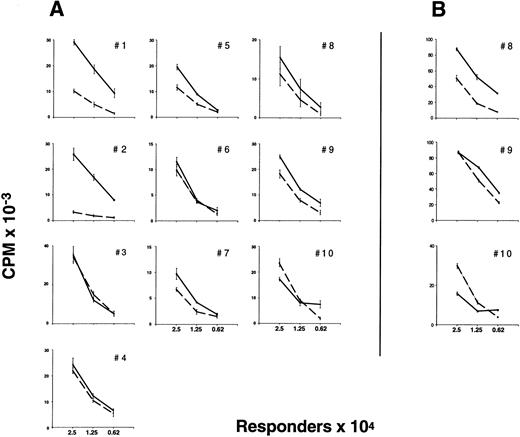
Proliferative responsiveness of preG- and G-PBMC and T cells.Unfractionated G-PBMC showed substantially lower proliferative responses in MLC as compared to equivalent numbers of unfractionated preG-PBMC (Fig 1). To evaluate T-cell responses, CD4 cells were sorted from PBMC obtained from healthy individuals before the first administration of G-CSF (preG-CD4) and from leukapheresis products at day 4 after initiation of treatment with G-CSF (G-CD4). Cells were cryopreserved and then thawed for simultaneous testing. Results with cells from ten different donors summarized in Fig 2A showed considerable variation. In eight of 10 donors, G-CD4 cells were equivalently responsive or moderately hyporesponsive. In two of 10 donors, G-CD4 cells were more strikingly hyporesponsive. Analysis of variance (ANOVA) indicated that G-CD4 cells were significantly hyporesponsive even when the analysis was controlled for the number of responder cells (P < .0001). However, because of great variability between donors, the use of an average value as a summary of the differences would not be meaningful.
Proliferative response of unfractionated preG-PBMC and G-PBMC to allogeneic, DR-mismatched PBMC in unidirectional MLC. Different numbers (5.0, 2.5, and 1.25 × 10⁴) of preG-PBMC (solid lines) or G-PBMC (dashed lines) responders were cultured with 1.0 × 10⁵ irradiated (30 Gy) allogeneic, DR-mismatched PBMC stimulators in round-bottom 96-well plates. Values for 3H-thymidine incorporation represent the mean counts per minute (cpm) ± SEM from quadruplicate cultures with values from autologous background controls subtracted. Results from one of five representative experiments are shown.
Proliferative response of unfractionated preG-PBMC and G-PBMC to allogeneic, DR-mismatched PBMC in unidirectional MLC. Different numbers (5.0, 2.5, and 1.25 × 10⁴) of preG-PBMC (solid lines) or G-PBMC (dashed lines) responders were cultured with 1.0 × 10⁵ irradiated (30 Gy) allogeneic, DR-mismatched PBMC stimulators in round-bottom 96-well plates. Values for 3H-thymidine incorporation represent the mean counts per minute (cpm) ± SEM from quadruplicate cultures with values from autologous background controls subtracted. Results from one of five representative experiments are shown.
Proliferative response of preG- and G-CD4 cells to allogeneic, DR-mismatched PBMC in unidirectional MLC and to immobilized CD3-specific IgM in the presence of IL-2. (A) Different numbers (2.5, 1.25, and 0.625 × 10⁴) of preG-CD4 responders (solid lines) or G-CD4 responders (dashed lines) obtained from 10 different donors were cultured with 1.0 × 10⁵ irradiated (30 Gy) DR-mismatched allogeneic PBMC in round-bottom 96-well plates. Values for 3H-thymidine incorporation represent the mean cpm ± SEM from quadruplicate cultures with values from autologous background controls subtracted. (B) Proliferation of preG- and G-CD4 cells in response to immobilized CD3-specific IgM in the presence of IL-2. Different numbers (2.5, 1.25, and 0.625 × 10⁴) of preG-CD4 responders (solid lines) or G-CD4 responders (dashed lines) obtained from three donors were seeded into flat-bottom 96-well plates precoated with antibody 38.1 at a concentration of 3 μg/mL. Values for 3H-thymidine incorporation represent the mean cpm ± SEM for triplicate cultures.
Proliferative response of preG- and G-CD4 cells to allogeneic, DR-mismatched PBMC in unidirectional MLC and to immobilized CD3-specific IgM in the presence of IL-2. (A) Different numbers (2.5, 1.25, and 0.625 × 10⁴) of preG-CD4 responders (solid lines) or G-CD4 responders (dashed lines) obtained from 10 different donors were cultured with 1.0 × 10⁵ irradiated (30 Gy) DR-mismatched allogeneic PBMC in round-bottom 96-well plates. Values for 3H-thymidine incorporation represent the mean cpm ± SEM from quadruplicate cultures with values from autologous background controls subtracted. (B) Proliferation of preG- and G-CD4 cells in response to immobilized CD3-specific IgM in the presence of IL-2. Different numbers (2.5, 1.25, and 0.625 × 10⁴) of preG-CD4 responders (solid lines) or G-CD4 responders (dashed lines) obtained from three donors were seeded into flat-bottom 96-well plates precoated with antibody 38.1 at a concentration of 3 μg/mL. Values for 3H-thymidine incorporation represent the mean cpm ± SEM for triplicate cultures.
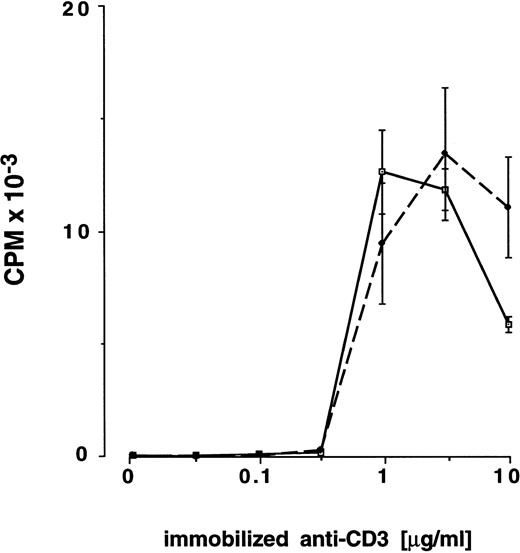
Proliferation of preG- and G-CD4 cells in response to immobilized CD3-specific antibody and IL-2.As a further test of T-cell activation, preG- and G-CD4 cells were stimulated by T-cell receptor cross-linking with immobilized CD3-specific IgM in medium containing IL-2 (10 IU/mL). Antibody immobilized at a threshold concentration of approximately 0.32 μg/mL induced IL-2 responsiveness in CD4 cells from either source (Fig 3). Responses with preG- and G-CD4 cells peaked with antibody immobilized at concentrations between 1.0 and 3.2 μg/mL. Both types of cells showed decreased responses with antibody immobilized at concentrations >3.2 μg/mL. For three donors (no. 8 through 10) T-cell responsiveness was directly compared in MLC and anti-CD3/IL-2 assays by using maximal stimulating concentrations of immobilized CD3-specific IgM (3 μg/mL). As shown in Fig 2A and B, G-CD4 cells were hyporesponsive in both assays in two of the three donors. In one donor, hyporesponsiveness was evident only at the lowest responder cell numbers.
Proliferation of preG- and G-CD4 cells in response to increasing concentrations of immobilized CD3-specific IgM in the presence of IL-2. PreG- (solid lines) or G-CD4 (dashed lines) cells (2.0 × 10⁴/well) were seeded into flat-bottom 96-well plates precoated with antibody 38.1 at the concentrations shown. Values for 3H-thymidine incorporation represent the mean cpm ± SEM for triplicate cultures.
Proliferation of preG- and G-CD4 cells in response to increasing concentrations of immobilized CD3-specific IgM in the presence of IL-2. PreG- (solid lines) or G-CD4 (dashed lines) cells (2.0 × 10⁴/well) were seeded into flat-bottom 96-well plates precoated with antibody 38.1 at the concentrations shown. Values for 3H-thymidine incorporation represent the mean cpm ± SEM for triplicate cultures.
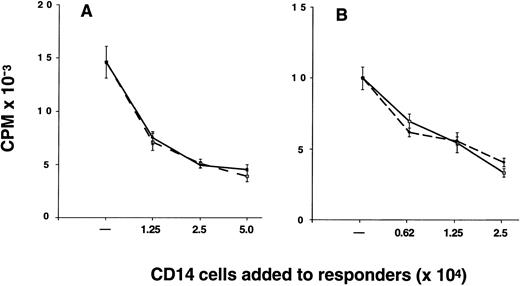
Suppression of alloantigen-induced T-cell proliferation by CD14 cells.The proportion of CD14 cells in G-PBMC (26.1% ± 2.2%) was considerably greater than in marrow (2.0% ± 0.3%) and preG-PBMC (9.5% ± 1.2%) (Table 1). As a consequence, the mean T cell-monocyte ratio is 4.8 for marrow, 6.3 for preG-PBMC, and only 0.9 for G-PBMC. The relatively large number of CD14 cells in G-PBMC led us to investigate whether G-CD14 cells could suppress T-cell responses in vitro. Results from one of nine experiments are shown in Fig 4. Results summarized from all nine experiments showed that G-CD14 cells consistently suppressed the proliferative response of preG-PBMC (48.6% ± 7.5% suppression; P < .001) in cultures containing 2.5 × 10⁴ G-CD14 cells (responder-CD14-ratio 2:1). Increasing the numbers of G-CD14 cells to 5.0 × 10⁴ (responder-CD14 ratio 1:1) did not produce significantly greater suppression. The addition of 1.25 × 10⁴ G-CD14 cells suppressed the maximum response by 36.5% ± 5.8% (responder-CD14 ratio 4:1), and 6.25 × 10³ G-CD14 cells lead to 14.4% ± 5.0% suppression (responder-CD14 ratio 8:1). In three experiments, side-by-side comparison showed that preG and G-CD14 cells had equivalent suppressive activity, and suppression also occurred when purified CD4 cells were used as responders (Fig 4).
Relative Numbers of T-Cell Subsets and CD14 Cells in Normal Marrow, Peripheral Blood Mononuclear Cells Before G-CSF Mobilization (preG-PBMC), and G-CSF–Mobilized Peripheral Blood Mononuclear Cells (G-PBMC)
| . | n = . | % CD3 . | % CD4 . | % CD8 . | % CD14 . | Ratio CD3/CD14 . |
|---|---|---|---|---|---|---|
| Marrow | 14 | 9.7 ± 0.7 | 4.7 ± 0.4 | 3.5 ± 0.4 | 2.0 ± 0.3 | 4.8 |
| preG-PBMC | 7 | 59.7 ± 3.3 | 41.2 ± 3.9 | 16.3 ± 1.6 | 9.5 ± 1.2 | 6.3 |
| G-PBMC | 14 | 24.3 ± 2.2 | 14.7 ± 1.3 | 8.8 ± 1.1 | 26.1 ± 2.2 | 0.9 |
Values represent means ± SEM based on flow cytometric analysis.
CD14 cells inhibit the proliferative response of autologous preG-PBMC or preG-CD4 cells. Cultures were established with 5.0 × 10⁴ preG-PBMC (A) or 2.5 × 10⁴ preG-CD4 responders (B) and 1.0 × 10⁵ irradiated (30 Gy) allogeneic PBMC stimulators in the absence or presence of responder-derived preG- (solid lines) or G-(dashed lines) CD14 cells at the indicated numbers. Values for 3H-thymidine incorporation represent the mean cpm ± SEM from quintuplicate cultures with values from autologous background controls subtracted. Results from one of nine representative experiments are shown (three experiments for side-by-side comparison of preG- and G-CD14 cells).
CD14 cells inhibit the proliferative response of autologous preG-PBMC or preG-CD4 cells. Cultures were established with 5.0 × 10⁴ preG-PBMC (A) or 2.5 × 10⁴ preG-CD4 responders (B) and 1.0 × 10⁵ irradiated (30 Gy) allogeneic PBMC stimulators in the absence or presence of responder-derived preG- (solid lines) or G-(dashed lines) CD14 cells at the indicated numbers. Values for 3H-thymidine incorporation represent the mean cpm ± SEM from quintuplicate cultures with values from autologous background controls subtracted. Results from one of nine representative experiments are shown (three experiments for side-by-side comparison of preG- and G-CD14 cells).
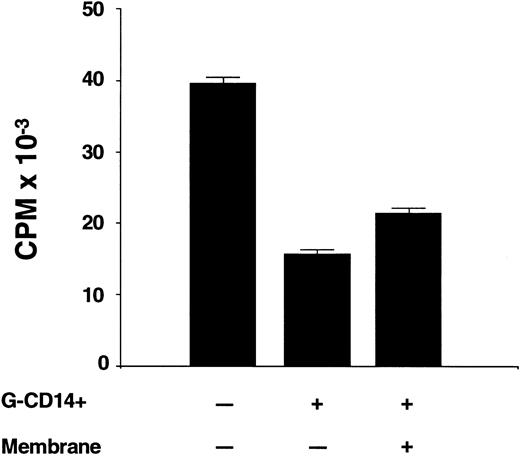
Contact requirements for suppression by CD14 cells.Experiments were conducted to determine whether suppression occurred when CD14 cells were physically separated from the responder and stimulator population. The experiment summarized in Fig 5 shows that the addition of G-CD14 cells to preG-PBMC in a 1:1 ratio suppressed the maximum response by 61.4 ± 0.3% (P < .001). Suppression was only slightly reduced (46.2% ± 0.4%) when G-CD14 cells were separated from responders and stimulators by a 4.5 μm micropore membrane. Thus, at least one mechanism of suppression was largely contact-independent.
Contact requirements for suppression of T-cell proliferation by CD14 cells. Responder-derived G-CD14 cells were added directly to MLC or were separated by a 0.45 μm porous polycarbonate membrane (+ membrane). Values for 3H-thymidine incorporation represent the mean cpm ± SEM from sextuplicate cultures with values from autologous background controls subtracted.
Contact requirements for suppression of T-cell proliferation by CD14 cells. Responder-derived G-CD14 cells were added directly to MLC or were separated by a 0.45 μm porous polycarbonate membrane (+ membrane). Values for 3H-thymidine incorporation represent the mean cpm ± SEM from sextuplicate cultures with values from autologous background controls subtracted.
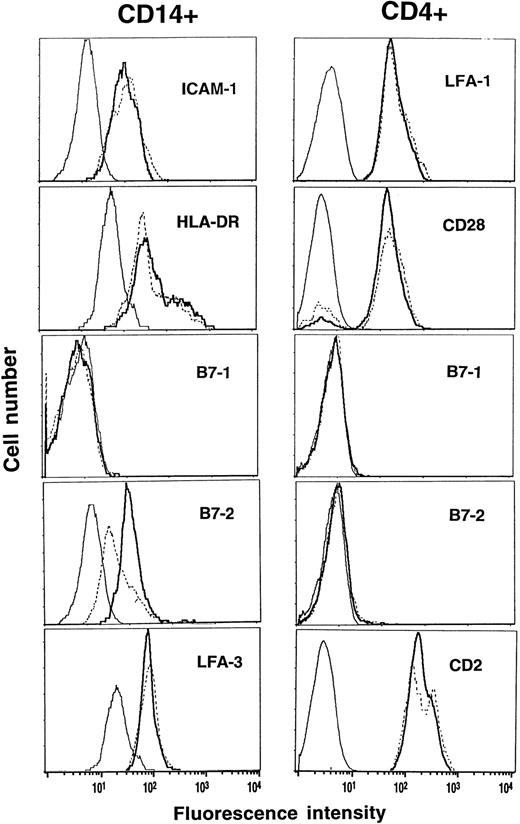
Expression of costimulatory molecules and HLA-DR before and during G-CSF.PreG- and G-CD4 cells and -CD14 cells were characterized for expression of costimulatory molecules and HLA-DR. CD11a/18 (LFA-1), CD28 and CD2 (LFA-2) were comparably expressed on preG- and G-CD4 cells (Fig 6). PreG- and G-CD14 cells had comparable expression of CD54 (ICAM-1), HLA-DR, and CD58 (LFA-3). CD80 (B7-1), a ligand for CD28 on T cells, was not detectable on CD14 cells. Expression of CD86 (B7-2), another CD28 ligand, however, was reduced by 60% to 70% on G-CD14 cells as compared to preG-CD14 cells. CD80 and CD86 were not detectable on preG- and G-CD4 cells.
Phenotypic analysis of preG- and G-CD4 and CD14 cells. PreG-PBMC (solid lines) and G-PBMC (dashed lines) from the same donor were stained with anti-CD4-PE or anti-CD14-PE plus FITC-conjugated antibodies against the indicated costimulatory molecules or HLA-DR. Samples were analyzed by gating on the CD4- or CD14-positive population, and fluorescence intensities were compared between preG- and G-CD4 and CD14 cells relative to isotype-matched control antibodies (thin lines). Results from one of three representative experiments are shown.
Phenotypic analysis of preG- and G-CD4 and CD14 cells. PreG-PBMC (solid lines) and G-PBMC (dashed lines) from the same donor were stained with anti-CD4-PE or anti-CD14-PE plus FITC-conjugated antibodies against the indicated costimulatory molecules or HLA-DR. Samples were analyzed by gating on the CD4- or CD14-positive population, and fluorescence intensities were compared between preG- and G-CD4 and CD14 cells relative to isotype-matched control antibodies (thin lines). Results from one of three representative experiments are shown.
DISCUSSION
In this study we show that (1) G-CD4 cells are moderately but variably hyporesponsive to allogeneic, DR-mismatched mononuclear cells; (2) in relation to the number of T cells, CD14 cells are fivefold more frequent in G-PBMC than in marrow; (3) preG- and G-CD14 cells in sufficient numbers suppress T-cell proliferation in a contact-independent fashion; and (4) G-CD14 cells express significantly lower levels of the costimulatory molecule CD86 (B7-2) compared to preG-CD14 cells.
The variability in MLC proliferative responses of purified CD4 cells isolated before and during mobilization with G-CSF was a consistent finding when cells were stimulated by immobilized CD3 antibody in the presence of IL-2. In the three individuals tested in MLC and anti-CD3/IL-2 stimulation simultaneously the results were comparable. These results suggest that IL-2 receptor expression or the coupling between IL-2 signal transduction and cell cycling might be altered by G-CSF. However, in the majority of the cases a striking difference in MLC responsiveness between preG- and G-CD4 cells was not detectable.
The clinical follow-up for patients receiving these products did not show any obvious correlation between the in vitro results and development of acute GVHD (data not shown). In the in vitro assays, lymphocyte proliferation was stimulated by major histocompatibility antigens, whereas GVHD after HLA-identical transplantation is caused by disparity for minor histocompatibility antigens. Hence, our experimental system can only serve as a general indicator of T-cell proliferative responsiveness after alloantigen stimulation. At least in some donors treatment with G-CSF could have induced qualitative changes in cytokine production by T cells as described previously in murine models.13
Monocytes not only enhance immune reactions as antigen-presenting cells,16,17 but can also inhibit T-cell proliferation by contact-dependent and -independent mechanisms.18-25 Our results suggest that CD14 cells from leukapheresis products suppress responder cell proliferation in a dose-dependent and largely contact-independent fashion. The contact-independent nature of suppression suggests a nonspecific mechanism. Talmadge et al26 reported similar suppressive activity in leukapheresis products after GM-CSF–mobilization. We did not find any differences in suppressive activity when preG- and G-CD14 cells were compared. Thus, the low proliferative response of G-PBMC can best be explained by the large number of CD14 cells as compared to unmobilized blood or marrow.14 In relation to the number of T cells, CD14 cells are fivefold more frequent in G-PBMC than in marrow.
To be of potential relevance in vivo, the suppressive effects caused by high numbers of monocytes in the graft would have to be long-acting to explain reduced GVHD after transplantation. The reconstitution of CD14 cells following allogeneic G-PBMC transplantation and marrow transplantation has not been systematically studied and compared. Based on immunophenotypic analysis, the number of monocyte precursors (defined as CD34+ cells coexpressing CD13, CD33, or CD14) is considerably greater in G-PBMC than in marrow.27 This could result in increased monocyte production with quantitative differences sustained for extended periods of time after transplantation. Despite a circulatory half-life of approximately 3 days, monocytes may live for months or even years after entering peripheral tissues and differentiating into macrophages.28,29 Like monocytes, tissue macrophages can secrete factors that suppress lymphocyte proliferation in vitro.30-32 The extent to which additional qualitative differences, such as downregulated expression of the costimulatory molecule B7-2 on G-CD14 cells, might play a contributory role, is unclear.33-35
In conclusion, our results suggest that the unexpectedly low incidence of GVHD after HLA-identical G-PBMC transplantation might be explained primarily by the suppressive effects of large numbers of monocytes and monocyte progenitors in leukapheresis products. In keeping with this conclusion, Bensinger et al36 found that 12 of 14 patients (86%) with advanced hematologic malignancies developed grades 2-4 acute GVHD after transplantation of CD34-selected G-PBMC containing a relatively low number of residual T cells (median 0.73 × 10⁶/kg). CD34 enrichment also leads to a 2 to 3 log depletion for monocytes.37 These clinical data must be interpreted with caution because the mean age of the patient population (48 years) was high, and 5 of 14 evaluable patients received cyclosporine alone for GVHD prophylaxis. Nonetheless, the unexpectedly high incidence of acute GVHD following transplantation of CD34-selected G-PBMC could be consistent with a loss of suppressor cell function associated with removal of monocytes in the graft.
ACKNOWLEDGMENT
We thank Gretchen Johnson for technical assistance, Harriet Childs for preparing the manuscript, and Wendy Leisenring for performing the statistical analysis.
Supported by in part by Grants No. CA18221, CA18029, DK34431, DK51417, and HL36444 from the National Institutes of Health, Department of Health and Human Services, Bethesda, MD.
Address reprint requests to Marco Mielcarek, MD, Fred Hutchinson Cancer Research Center, 1124 Columbia St, M-318, Seattle, WA 98104.

This feature is available to Subscribers Only
Sign In or Create an Account Close Modal