Abstract
The mechanisms involved in the mobilization of progenitor cells into the blood by granulocyte colony-stimulating factor (G-CSF ) and other cytokines are poorly understood. To identify important influences on this complex process, in vivo murine models were used. Granulocyte-macrophage colony-stimulating factor (GM-CSF ) transgenic, Max41 transgenic, W/WV, Mpl-null, GM-CSF receptor (β chain)-null mice, wild-type littermate controls, and six inbred strains of mice were injected with 200 μg/kg/d G-CSF for 5 days. Three parameters of response were monitored: white blood cell count (WCC), peripheral blood progenitor cell (PBPC) numbers, and spleen weight. In all genotypes studied, G-CSF induced increases in these three parameters. However, PBPC mobilization in W/WV and Mpl-null mice was only 30% and 9%, respectively, of that observed in wild-type mice. In contrast, perturbations of GM-CSF signalling had no demonstrable effect on in vivo responses to G-CSF. Broad variability was evident between inbred strains for each parameter of the response to G-CSF. A 10-fold range in response was observed for circulating progenitor cell numbers, similar to that observed for normal human subjects receiving G-CSF. The interstrain differences were in the distribution of mature and progenitor cells between peripheral blood, bone marrow, and spleen rather than in the total numbers of these cells in the body. Results of an F2 intercross of low-responding C57BL/6 and intermediate-responding SJL mice indicated that regulation of progenitor cell mobilization is a complex genetic trait, that there is a correlation between this trait and WCC response (r2 = .5), and that this approach may serve as a useful model for the identification of genes involved in the mobilization process.
THE MECHANISMS underlying the mobilization of progenitor cells into the blood in response to granulocyte colony-stimulating factor (G-CSF ) remain unknown. In common with other hematopoietic growth factors (granulocyte-macrophage colony-stimulating factor [GM-CSF ],1,2 interleukin-3 [IL-3],3,4 and stem cell factor [SCF ]5), G-CSF induces a 10- to 100-fold increase in the numbers of circulating progenitor cells and stem cells in both humans6-9 and mice.10-12 In both species, the two most prominent features of the response to G-CSF are neutrophil leukocytosis and progenitor cell mobilization. These responses are both time- and dose-dependent.10,11,13 The neutrophilia is evident within hours,14 but the increase in progenitor cell numbers in the blood is delayed by 2 to 3 days.7,13 Although the neutrophil response (which comprises both emigration of preformed neutrophils and enhanced production and maturation of neutrophil progenitors and precursors) is well understood,15,16 many aspects of the progenitor cell response remain enigmatic. Current evidence suggests that the induction of progenitor cell egress from the marrow into the blood by G-CSF (and the other hematopoietic growth factors) is not likely to be solely a direct effect of G-CSF on progenitor cells. In addition to the time lag between injection and response, a significant proportion of the peripheral blood progenitor cells do not express detectable levels of G-CSF receptors.17 These observations, together with the fact that different growth factors with varying specific target cells mobilize similar spectra of progenitor cells (albeit with different efficiencies),1-13 suggest that G-CSF acts indirectly, perhaps by triggering the occurrence of a common series of events that lead to progenitor cell egress.
It is probable that changes in the adhesive interaction of progenitor cells with the cellular and noncellular stromal environment are pivotal. Similarly, changes in phenotype reflecting an increased capacity of these cells to remain in the circulation seem likely. These processes are complex and impossible to model fully in vitro. As an approach to identifying the key processes involved, we have investigated a number of in vivo models. In vivo, single hematopoietic growth factors do not appear to act in isolation, but rather in concert with other regulators to mediate net effects on hematopoietic cell populations.18 It is well established that adhesive interactions between CD34+ cells and components of the hematopoietic microenvironment, including elements of the extracellular matrix such as fibronectin, modify responses to cytokines.19-21 Recently, it has been shown that specific cytokines (GM-CSF, IL-3, and SCF ) can rapidly and transiently modify the function of very late antigen-4 (VLA-4) and VLA-5 expressed on CD34+ cells to promote adhesion to fibronectin.22 With these considerations in mind, we initially chose to examine the in vivo responses to G-CSF in mutant mice with perturbations in specific cytokine or cytokine receptor systems. The data indicate that, although signalling via the receptors for SCF and thrombopoietin (TPO) influences responses to injected G-CSF, GM-CSF is not essential for progenitor cell mobilization. We have also identified major differences in responses between inbred strains of mice, suggesting significant contributions by as yet undetermined genetic loci to the regulation of G-CSF–induced progenitor cell mobilization.
MATERIALS AND METHODS
Mice.The following inbred strains of mice were used in this study: C57BL/6J, BALB/c/An/Bradley/WEHI, DBA/2/WEHI, C3H/HeJ, 129SV, and SJL. All mice were reared and maintained under specific pathogen-free conditions, with the exception of W/WV mice. Male (C57BL/10-DBA/2)F1-W/WV mice and wild-type littermates (purchased from Flinders Medical Centre, Adelaide, Australia) were maintained in a standard animal house and analyzed at approximately 16 weeks of age. In all other experiments, male mice aged 6 to 10 weeks were used and, wherever possible, matched for weight with controls. The generation of GM-CSF transgenic mice23 and Max 41 transgenic mice24 has been described previously, as has the generation of mice with null mutations in the genes encoding the TPO receptor, c-Mpl,25 and the common β subunit (βc ) of the receptors for GM-CSF, IL-3, and IL-5.26 The βc -null mice used in this study were from a pure 129SV background.
Distribution of Neutrophils, Neutrophil Precursors, and Progenitor Cells by Strain Type in Response to G-CSF at 200 μg/kg/d for 5 Days
| Organ . | Cell Type . | Total Cell Numbers . | ||
|---|---|---|---|---|
| . | . | C57BL/6 . | BABL/c . | DBA/2 . |
| Baseline | ||||
| PB | Neutrophils (×10−6) | 1.8 ± 0.6 | 2.0 ± 0.8 | 2.2 ± 0.7 |
| Myeloid CFC (×10−3) | 0.06 ± 0.1 | 0.05 ± 0.1 | 0.2 ± 0.2 | |
| BM | Neutrophils (×10−6) | 132 ± 4 | 100 ± 10* | 124 ± 3 |
| Neutrophil precursors (×10−6) | 187 ± 6 | 175 ± 15 | 150 ± 9 | |
| Myeloid CFC (×10−3) | 645 ± 103 | 658 ± 233 | 768 ± 173 | |
| Spleen | Neutrophils (×10−6) | 4 ± 1 | 11 ± 3 | 5 ± 2 |
| Neutrophil precursors (×10−6) | 8 ± 1 | 17 ± 3* | 9 ± 2 | |
| Myeloid CFC (×10−3) | 4 ± 4 | 3 ± 3 | 5 ± 4 | |
| Total body | Neutrophils (×10−6) | 138 ± 5 | 113 ± 13 | 131 ± 7 |
| Neutrophil precursors (×10−6) | 195 ± 7 | 192 ± 18 | 159 ± 11 | |
| Myeloid CFC (×10−3) | 651 ± 107 | 663 ± 236 | 773 ± 177 | |
| Post G-CSF | ||||
| PB | Neutrophils (×10−6) | 38 ± 1 | 35 ± 12 | 65 ± 18* |
| Myeloid CFC (×10−3) | 2 ± 1* | 9 ± 3* | 24 ± 3* | |
| BM | Neutrophils (×10−6) | 233 ± 24* | 107 ± 10 | 130 ± 3 |
| Neutrophil precursors (×10−6) | 368 ± 34* | 221 ± 30 | 186 ± 10 | |
| Myeloid CFC (×10−3) | 590 ± 263 | 533 ± 167 | 447 ± 66 | |
| Spleen | Neutrophils (×10−6) | 90 ± 34 | 82 ± 28 | 125 ± 36 |
| Neutrophil precursors (×10−6) | 117 ± 25 | 142 ± 30 | 164 ± 46 | |
| Myeloid CFC (×10−3) | 214 ± 172 | 493 ± 152 | 860 ± 312* | |
| Total body | Neutrophils (×10−6) | 361 ± 69 | 224 ± 50 | 320 ± 57 |
| Neutrophil precursors (×10−6) | 486 ± 68 | 367 ± 58 | 350 ± 56 | |
| Myeloid CFC (×10−3) | 806 ± 436 | 1,035 ± 332 | 1,331 ± 378 | |
Values represent means ± SD of results from three mice per group at baseline and four mice per group after G-CSF. The numbers of neutrophils, neutrophil precursors (metamyelocytes, myelocytes, promyelocytes, and myeloblasts), and myeloid progenitor cells per tissue were calculated from the total cellularity of each tissue and the relative frequencies of each cell type within these populations, as described in the Materials and Methods. The peripheral blood volume was assumed to be 2 mL per mouse and a whole femur to be equivalent to 6% of the total bone marrow.28 Progenitor cell cultures were stimulated by SCM.
Abbreviations: PB, peripheral blood; BM, bone marrow.
Results were significantly different from the results of other strains. Results were initially compared by ANOVA; if P < .01, pairwise analyses (Student-Newman-Keuls test) were performed and considered significant if P < .05.
Parameters of response.The following parameters of response to G-CSF were routinely measured using previously described techniques: peripheral blood white blood cell count (WCC), spleen weight, and the number of nonerythroid progenitor cells per volume of blood.13,27 Briefly, peripheral blood progenitor cells (PBPCs) were enumerated as the number of colonies formed after 7 days in quadruplicate cultures of 10, 20, or 30 μL of blood in 1-mL cultures containing modified Dulbecco's modified Eagle's medium, 0.3% agar, and 20% bovine newborn calf serum (BCS; HyClone, Logan, UT). Spleen-conditioned medium (SCM)27 was used routinely as the culture stimulus. In specific experiments, additional cultures were established and stimulated with recombinant cytokines. Colony counts were performed on intact fixed and dried cultures at 40 to 200× magnifications after staining in sequence for acetylcholinesterase, Luxol Fast Blue, and hematoxylin. In some experiments, the numbers of nucleated cells and nonerythroid progenitor cells were also measured for whole femurs and spleens. To measure the number of progenitor cells per femur and per spleen, triplicate 1-mL cultures of 25,000 bone marrow cells and either 50,000 spleen cells (from cytokine-injected animals) or 100,000 spleen cells (from uninjected animals) were established using identical conditions to those used for peripheral blood cultures. The numbers of nonerythroid (myeloid) progenitor cells per femur or spleen were then calculated from the frequency of these cells per nucleated cell and the total cellularity of each tissue. Differential cell counts were performed by counting 200 cells on peripheral blood smears and cytocentrifuge preparations of bone marrow or spleen cell suspensions stained with May-Grünwald-Giemsa.
To estimate the size of the total body pools of neutrophils, neutrophil precursors (metamyelocytes, myelocytes, promyelocytes, and myeloblasts), and myeloid progenitor cells, the sum of cell counts for each population from the peripheral blood (assumed to be 2 mL volume per mouse), bone marrow (1 femur equivalent to 6% of total bone marrow28 ), and spleen were used. Baseline values for each parameter refer to results for uninjected mice. For experiments involving the injection of G-CSF, results for uninjected mice are similar to results for mice injected with carrier control.27
Cytokines.Lyophilized recombinant human G-CSF (rhG-CSF; lenograstim; AMRAD, Melbourne, Australia) was dissolved in sterile water for injection as per the manufacturer's instructions and diluted in sterile normal saline for injection (Delta West, Melbourne, Australia) with 5% BCS. Mice were injected twice daily intraperitoneally with 2.5 μg rhG-CSF in 0.2 mL volume (200 μg/kg/d for a 25-g mouse). For in vitro cultures, the concentration of recombinant mouse (rm) IL-3 (PeproTech, Rocky Hill, NJ), rmGM-CSF (Schering, Kenilworth, NJ), and rmM-CSF used was 10 ng/mL; rmSCF was used at a concentration of 100 ng/mL. Both rmM-CSF and rmSCF were produced as previously described.25
Statistics.Results are expressed as means ± standard deviations (SD). Student's t-test was used to compare data for responses to G-CSF between mutant mice and wild-type mice. Initial comparisons between the three groups in Table 1 were made by analysis of variance (ANOVA). Only if the null hypothesis was rejected (P < .01) were further pairwise comparisons performed using the Student-Newman-Keuls test.
RESULTS
Influence of GM-CSF, c-kit, and c-Mpl signalling on G-CSF responses.To determine the effects of preventing GM-CSF and IL-5 signalling on in vivo responses to G-CSF, the responses in βc -null mice and wild-type littermate controls were compared. After 5 days of G-CSF injections, wild-type mice showed a marked neutrophil leukocytosis, a 200-fold increase in PBPC (210 ± 17 colony-forming cells [CFC]/30 μL), and splenomegaly. As shown in Fig 1A, no differences in either absolute or fold increases in PBPC, WCC, neutrophil count (data not shown), spleen weight, or number of splenic CFC (data not shown) were observed between βc -null mice and wild-type littermate controls. Next, the effects of chronic overexpression of GM-CSF on G-CSF responses were determined in GM-CSF transgenic mice. The effects are depicted in Fig 1B and, as was the case for the βc -null mice, no differences in responses were observed when compared with wild-type littermate controls. As previously described, both βc -null26 and GM-CSF transgenic mice23 have essentially normal baseline hematopoiesis.
In vivo responses induced by G-CSF in (A) βc -null mice and littermate controls and (B) GM-CSF transgenic mice and littermate controls. Progenitor cell cultures were stimulated with IL-3 and SCF in (A) and SCM in (B). Mean results at baseline and after G-CSF at 200 μg/kg/d for 5 days; four mice per group in (A) and three mice per group in (B). Error bars represent SD.
In vivo responses induced by G-CSF in (A) βc -null mice and littermate controls and (B) GM-CSF transgenic mice and littermate controls. Progenitor cell cultures were stimulated with IL-3 and SCF in (A) and SCM in (B). Mean results at baseline and after G-CSF at 200 μg/kg/d for 5 days; four mice per group in (A) and three mice per group in (B). Error bars represent SD.
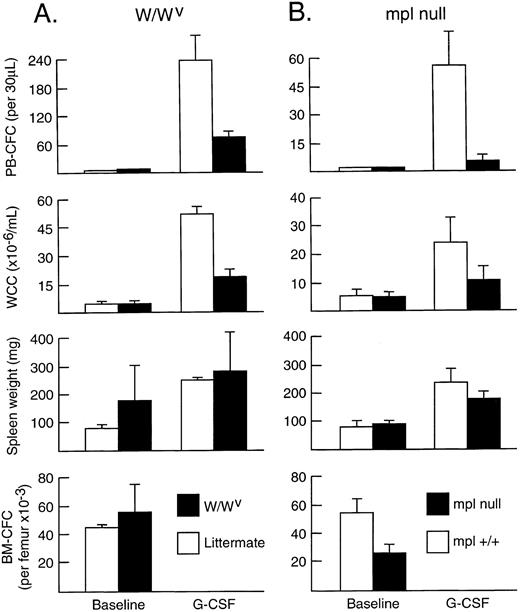
To assess whether signalling through the receptor for SCF (c-kit) influenced progenitor cell mobilization induced by G-CSF, adult W/WV mice (with mutations of c-kit that significantly impair signal transduction) were injected with G-CSF for 5 days. As shown in Fig 2A, WCC (19.1 ± 4.0 × 10⁶/mL) and PBPC numbers (72 ± 15/30 μL) increased in response to G-CSF. However, when compared with wild-type littermates injected with G-CSF, both WCC and PBPC responses were significantly reduced. Although having normal numbers of total white blood cells (4.8 ± 0.4 × 10⁶/mL) and neutrophils (1.3 ± 0.2 × 10⁶/mL) in the blood and normal numbers both of nucleated cells (20.7 ± 5.7 × 10⁶) and IL-3–dependent nonerythroid progenitor cells in the bone marrow at baseline, the numbers of PBPC per milliliter of blood induced by G-CSF were only 30% of levels in G-CSF–treated wild-type littermate controls (P < .01). Similarly, the induced leukocytosis was 37% of that induced in control mice (P < .01). Spleen weights were similar to those of littermates after G-CSF injections, although the mean fold increase over baseline was less (1.5- v 3.2-fold), as was the progenitor cell content of the spleen (371 ± 77 × 103 CFC v 635 ± 34 × 103 CFC; P < .01).
In vivo responses induced by G-CSF in (A) W/WV mice and littermate controls and (B) Mpl-null mice and littermate controls. Progenitor cell cultures were stimulated with IL-3 alone in (A) and SCM in (B). Mean results at baseline and after G-CSF at 200 μg/kg/d for 5 days; three mice per group in (A) and four mice per group in (B). Error bars represent SD.
In vivo responses induced by G-CSF in (A) W/WV mice and littermate controls and (B) Mpl-null mice and littermate controls. Progenitor cell cultures were stimulated with IL-3 alone in (A) and SCM in (B). Mean results at baseline and after G-CSF at 200 μg/kg/d for 5 days; three mice per group in (A) and four mice per group in (B). Error bars represent SD.
To assess whether signalling through the TPO receptor (c-Mpl) influenced the development of in vivo responses to G-CSF, Mpl-null mice and their wild-type littermate controls were studied. Although G-CSF induced increases in PBPC, WCC, and spleen weight in Mpl-null mice, the responses were significantly less than in wild-type controls (Fig 2B). For PBPC, the elevations in Mpl-null mice were only 9% of those observed in wild-type mice (P < .01 for the comparison). For the other parameters of response (leukocytosis and spleen weight), the elevated levels were 44% and 72% of those of controls (P < .05 and P = .06, respectively). At baseline, Mpl-null mice exhibited normal numbers of nucleated cells in blood and bone marrow, but reduced progenitor cell numbers in bone marrow and spleen.25
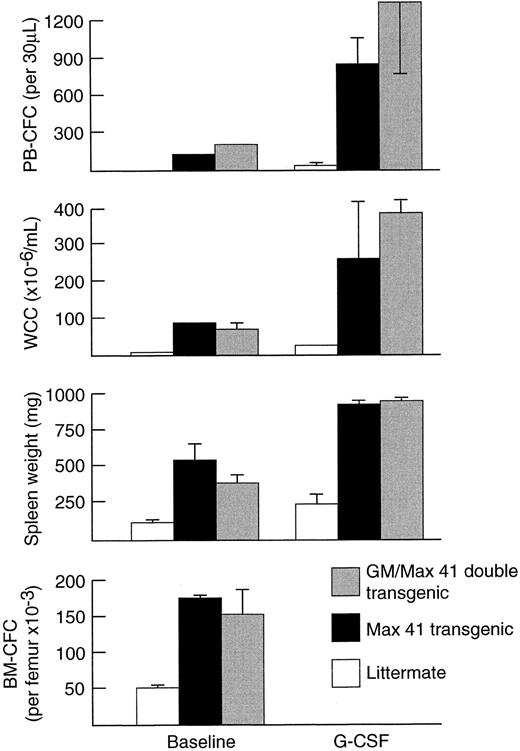
Effect of Max 41 mutation and GM-CSF overexpression on G-CSF response.To determine whether elevated numbers of progenitor cells at baseline influence progenitor cell mobilization by G-CSF, Max 41 transgenic mice were studied. Max 41 transgenic mice carry an unidentified insertional mutation that results in a marked (approximately 4-fold) increase in the steady-state myeloid progenitor cell pool and a 20- to 50-fold elevation of blood neutrophil levels.24,29 30 At baseline, Max 41 transgenic mice displayed a leukocytosis and elevated PBPC (110 ± 73 CFC per 30 μL) in the range typically seen in normal mice injected with G-CSF (Fig 3). The absolute increases in WCC, PBPC, and spleen weight in Max 41 mice greatly exceeded that in normal littermates. The mean fold increase in WCC after 5 days of G-CSF (3.3-fold) was similar to that for littermates (3.6-fold); the mean fold increase in progenitor cells per milliliter of blood (8-fold) and spleen weight (1.7-fold) were less than observed in littermates (36-fold increase for PBPC and 2.4-fold increase for spleen weight). In double transgenic Max 41/GM-CSF mice, chronic overexpression of GM-CSF did not augment responses to G-CSF.
In vivo responses induced by G-CSF at 200 μg/kg/d for 5 days in GM-CSF/Max41 double transgenic mice (n = 3), Max41 transgenic mice (n = 6), and their wild-type littermate controls (n = 6). Progenitor cell cultures were stimulated with SCM. Mean results are presented and error bars represent SD.
In vivo responses induced by G-CSF at 200 μg/kg/d for 5 days in GM-CSF/Max41 double transgenic mice (n = 3), Max41 transgenic mice (n = 6), and their wild-type littermate controls (n = 6). Progenitor cell cultures were stimulated with SCM. Mean results are presented and error bars represent SD.
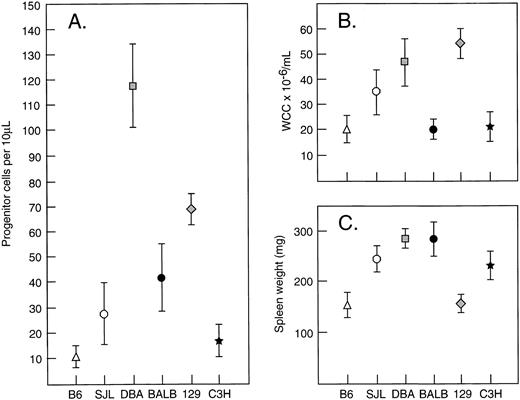
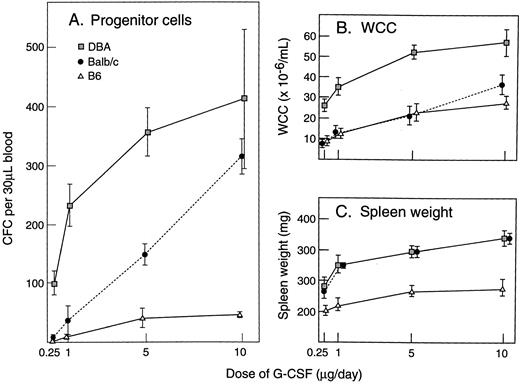
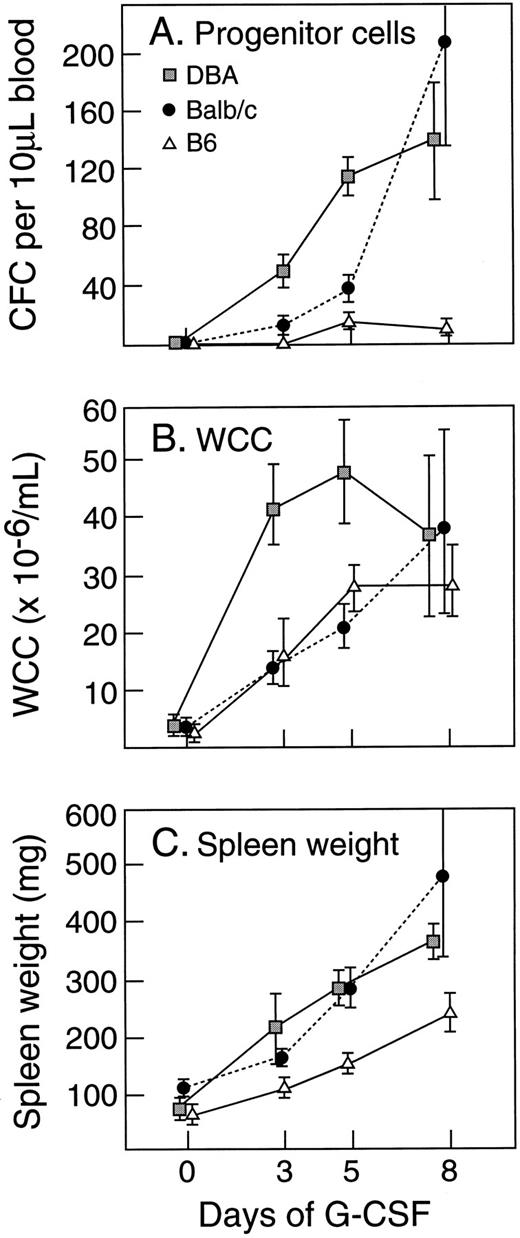
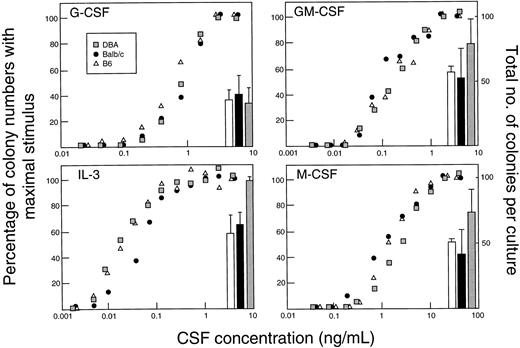
Effect of strain difference on G-CSF response.Within the species mus musculus, marked differences in magnitudes of responses to G-CSF were apparent between individual strains. Figure 4 illustrates the absolute levels of PBPC, WCC, and spleen weight induced by 5 days of injections of G-CSF at 200 μg/kg/d. In comparison with the differences observed after G-CSF, differences at baseline were minor and differences in absolute increases generally reflected similar variability in fold rises. C57BL/6 showed the lowest (or equal lowest) absolute increases in all three parameters. DBA/2 showed nearly 10-fold greater PBPC response, a twofold to threefold greater WCC response and a twofold greater increase in spleen weight than observed in C57BL/6 mice. Other strains showed intermediate responses for PBPC mobilization. Between the strains, the patterns of the three measured responses were not necessarily concordant. These differences between strains (C57BL/6, BALB/c, and DBA/2) were present over a 40-fold dose range of G-CSF (Fig 5) and were evident after 3, 5, and 8 days of G-CSF injections (Fig 6). In contrast to the marked differences in in vivo responses, bone marrow progenitor cells from different strains showed closely similar responsiveness to stimulation in vitro by G-CSF, GM-CSF, M-CSF, and IL-3 (Fig 7). Figure 7 also shows that colony-forming cells were present at similar frequencies in bone marrow populations from the different strains tested.
Strain variations in (A) PBPC, (B) WCC, and (C) spleen weight in response to G-CSF at 200 μg/kg/d for 5 days. Progenitor cell cultures were stimulated with SCM. Mean results of 4 to 12 mice per group. Error bars represent SD.
Strain variations in (A) PBPC, (B) WCC, and (C) spleen weight in response to G-CSF at 200 μg/kg/d for 5 days. Progenitor cell cultures were stimulated with SCM. Mean results of 4 to 12 mice per group. Error bars represent SD.
In vivo dose-response curves for (A) PBPC, (B) WCC, and (C) spleen weight in mice injected with G-CSF for 5 days. Progenitor cell cultures were stimulated with SCM. Mean results of four mice per group. Error bars represent SD.
In vivo dose-response curves for (A) PBPC, (B) WCC, and (C) spleen weight in mice injected with G-CSF for 5 days. Progenitor cell cultures were stimulated with SCM. Mean results of four mice per group. Error bars represent SD.
Time course of G-CSF (200 μg/kg/d for 5 days) -induced responses in different strains of mice. Progenitor cell cultures were stimulated with SCM. Mean results of four mice per group. Error bars represent SD.
Time course of G-CSF (200 μg/kg/d for 5 days) -induced responses in different strains of mice. Progenitor cell cultures were stimulated with SCM. Mean results of four mice per group. Error bars represent SD.
In vitro responses to four CSFs by bone marrow cells from three mouse strains. Each panel shows the dose-response curves and number of CFC stimulated per 50,000 cells (100,000 cells for G-CSF ) with maximal stimulus for a single CSF.
In vitro responses to four CSFs by bone marrow cells from three mouse strains. Each panel shows the dose-response curves and number of CFC stimulated per 50,000 cells (100,000 cells for G-CSF ) with maximal stimulus for a single CSF.
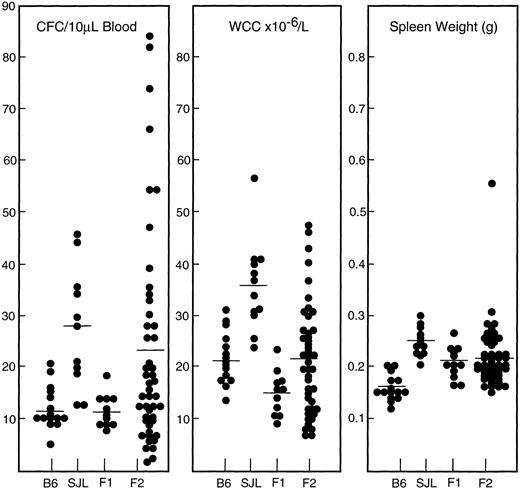
Genetics of strain differences.In preliminary studies to establish the genetic basis of these strain differences, intercrosses of low-responding C57BL/6 and SJL, an intermediate-responding strain, were performed. The results for the three parameters of response are summarized in Fig 8. F1 mice displayed similar WCC and PBPC responses to the low-responsive C57BL/6 strain. For progenitor cell mobilization, mice of the F2 generation showed a wide range of responses, with the highest responders approaching the levels observed for DBA/2 mice. For the G-CSF–induced leukocytosis, F2 mice also showed a broad range of responses. In contrast, increases in spleen weight for both F1 and F2 generations were more tightly distributed around mean levels midway between than those of the parental strains. For individual F2 animals, there was a moderate correlation between the number of circulating progenitor cells and the WCC (r2 = .5, P < .0001) but no correlation between either of these parameters and spleen weight (r2 < .05, P > .4).
In vivo responses to G-CSF at 200 μg/kg/d for 5 days in the parental strains and progeny of an intercross between C57BL/6 and SJL mice. Results for individual mice are presented and the mean for each group is indicated by a straight line.
In vivo responses to G-CSF at 200 μg/kg/d for 5 days in the parental strains and progeny of an intercross between C57BL/6 and SJL mice. Results for individual mice are presented and the mean for each group is indicated by a straight line.
Total body responses to G-CSF.To investigate whether the wide variations between mouse strains in the elevated circulating leukocyte and progenitor cell numbers induced by G-CSF reflected major quantitative differences in the total body populations of these cells after stimulation by G-CSF, estimates were made of total body neutrophil, neutrophil precursor, and nonerythroid progenitor cells for each strain before and after G-CSF. Table 1 indicates that the strain differences were in the distribution of neutrophils and progenitor cells between the three measurable compartments rather than in the total numbers of these cells in the body.
DISCUSSION
The present observations suggest that both SCF and TPO play significant roles in the generation of both the leukocytosis and progenitor cell mobilization induced by G-CSF. Cynshi et al31 documented diminished neutrophilia and reduced neutrophil GM-CFC in the spleen of W/WV mice in response to low doses of G-CSF. The present results for W/WV mice confirm this reduced responsiveness and document, in addition, that these mice exhibited a poor capacity to elevate circulating progenitor cell numbers. The models we have used reflect chronic deficiency states of signalling by the cognate receptors for SCF and TPO. They cannot discriminate between the relative contributions of long-standing perturbations of baseline hematopoiesis and acute disturbances of responses to G-CSF. Despite having normal numbers of circulating leukocytes and clonogenic progenitor cells in the bone marrow during steady-state hematopoiesis, W/WV mice are anemic and have a depleted functional stem cell reserve.32,33 Mpl-null mice maintain normal mature erythropoiesis and myelopoiesis but display a 50% to 70% reduction in the size of the bone marrow progenitor cell pool.25 It is probable that these diminished stem and progenitor cell reserves are at least partially responsible for the reductions in leukocytosis and PBPC numbers after the administration of G-CSF. For W/WV mice, reductions in responsiveness to erythropoietin have also been reported.34
However, more direct roles for both cytokines in the mobilization process can also be inferred. In Mpl-null mice, the reduction in mobilized PBPC numbers was 11-fold, greatly exceeding the deficiency in total body progenitor cell numbers at baseline (2.3-fold lower than littermates) and after G-CSF for 5 days (2.7-fold, data not shown). Evidence implicating SCF as an important modulator of progenitor cell mobilization comes from two other streams of investigation. SCF alone is a relatively weak mobilizing agent.35 However, in mice35,36 and humans,37 the effect of combining SCF with G-CSF is a supra-additive increase in circulating progenitor cell levels. Furthermore, studies of the surface expression of c-kit by mobilized PBPC have showed a marked reduction in expression per CD34+ cell.38 An inverse relationship between efficacy of mobilization and c-kit expression was also reported, suggesting that SCF:c-kit interactions may play adhesive as well as proliferation-inducing roles in the mobilization process.
In a clear contrast, GM-CSF appears not to be necessary for the generation of the in vivo responses to G-CSF monitored in this study. Data from the experiments with βc -null mice also suggest that IL-5 does not play a significant role. Max 41 transgenic mice with expanded baseline hematopoiesis showed increased absolute increases in both WCC and PBPC, but somewhat lower fold increases when compared with littermate controls. This suggests that, in Max 41 mice, it is the chronic basal elevation that is important for determining the high absolute levels of response, rather than any direct effects of the genetic defect altering responsiveness to G-CSF. In keeping with this interpretation, bone marrow progenitor cells from these mice and their littermates showed equivalent responsiveness to G-CSF in clonal culture.29 A most intriguing observation was the 50- to 150-fold increase of PBPC in uninjected Max 41 mice. This greatly exceeds the threefold to fourfold increase in bone marrow progenitor cells and the fourfold to fivefold increase of total body progenitor cells in these mice30 and may reflect increased competition for niches within the bone marrow microenvironment.
Striking quantitative differences in in vivo responses to G-CSF were observed between inbred strains of mice. Because the mice were maintained in a controlled and uniform environment and were matched for age and body weight, these phenotypic differences are likely to be based on genetic differences between the strains. The largest differences (>10-fold) were evident for progenitor cell mobilization, and this degree of variation is similar to that observed between individual normal human subjects injected with G-CSF.39
The phenotypic differences observed cannot be explained by variations in direct responsiveness to G-CSF (as judged by in vitro proliferation), and previous work has indicated no significant differences in the number of G-CSF binding sites between strains.40 Further evidence that argues against strain variations in the responsiveness of granulopoietic populations to stimulation by G-CSF being responsible for the phenotypic differences is the comparison of estimates for total body neutrophil, neutrophil precursor, and progenitor cell numbers between strains. No major differences in total quantity were observed; rather, the differences were in the distribution of cells between peripheral blood, bone marrow, and spleen.
Preliminary investigations into the genetics of the strain differences involved a generation of F1 hybrids and subsequently an F2 intercross between the lowest responding strain, C57BL/6, and an intermediate responding strain, SJL. The C57BL/6 phenotypes for WCC and PBPC parameters were dominant over the SJL phenotype. For the spleen weight parameter, the parental phenotypes were codominant. In mice of the F2 generation, none of the parameters displayed a pattern indicative of a Mendelian (ie, single gene) trait. For PBPC, a broad range of phenotypes was observed in the F2 generation, with the highest responders having a phenotype quantitively approaching that of DBA/2 mice, the most highly responsive mouse strain. This spread of PBPC counts was reminiscent of the pattern observed for normal human subjects.39 The pattern suggests that the PBPC mobilization phenotype is a complex trait with multiple genetic loci involved. For WCC, a range of phenotypes spanning the phenotypes of both parental strains was observed, again consistent with this being a complex genetic trait. The moderately strong correlation observed between WCC and PBPC is in agreement with results for the same correlation in normal human subjects receiving G-CSF (r2 = .52)39 and suggests that there may be at least one genetic locus in common modulating both progenitor cell and mature leukocyte mobilization.
Further investigations are required to determine the number and identity of genes involved in each trait. Because it is likely that the genetic factors responsible for the observed interstrain differences will include rate-limiting and other key steps in the mobilization process, definition of these genes and their products should help explain this complex phenomenon and may suggest strategies to improve current clinical protocols for progenitor cell mobilization.
ACKNOWLEDGMENT
We are grateful to Sandra Mifsud and Ladina Di Rago for careful technical assistance and to AMRAD for donating G-CSF for injection into mice.
Supported by the National Health and Medical Research Council of Australia, the Carden Fellowship Fund of the Anti-Cancer Council of Victoria, the Wellcome Trust, and Grant No. CA22556 from the National Institutes of Health (Bethesda, MD).
Address reprint requests to Donald Metcalf, MD, The Walter and Eliza Hall Institute of Medical Research, Post Office, Royal Melbourne Hospital, 3050 Victoria, Australia.


This feature is available to Subscribers Only
Sign In or Create an Account Close Modal