Abstract
To evaluate the effects of long-term, high-dose exposure to thrombopoietin (TPO), lethally irradiated mice were grafted with bone marrow cells infected with a retrovirus carrying the murine TPO cDNA. Mice were studied for 10 months after transplantation. In plasma, TPO levels were highly elevated (104 U/mL) throughout the course of the study. All mice developed a lethal myeloproliferative disorder evolving in two successive phases. During the first phase (7-9 weeks posttransplant), platelet and white blood cell (WBC) counts rose four- and ten-fold, respectively, whereas hematocrits decreased slightly to 29% ± 3%. The WBC were mainly mature granulocytes, but myeloid precursor cells were invariably observed as well as giant platelets with an irregular granule distribution. The striking features were a massive hyperplasia of megakaryocytes and granulocytes in the spleen and bone marrow and a hypoplasia of erythroblasts in bone marrow. Total numbers of megakaryocyte colony-forming cell, burst-forming unit-erythroid, and granulocytemacrophage colony-forming cells were increased but colony-forming unit-erythroid numbers decreased. From 10 weeks posttransplant and thereafter, WBC, platelets, and red blood cell numbers declined dramatically. The absolute numbers of progenitor cells were very low in the spleen and bone marrow, but sharply increased in the blood and peritoneal cavity. Extramedullary hematopoiesis was observed in several organs. Histologic sections of the spleen and bones revealed severe fibrosis and osteosclerosis. The mean survival time was 7 months posttransplant and mice died with severe pancytopenia. Notably, two mice died between 3 and 4 months posttransplant with a leukemic transformation. This disorder was transplantable into secondary recipients who developed an attenuated form of the disease similar to the one previously described (Yan et al, Blood 86:4025, 1995). Taken together, our data show that high and persistent TPO production by transduced hematopoietic cells in mice results in a fatal myeloproliferative disorder that has a number of features in common with human idiopathic myelofibrosis.
THE PHYSIOLOGIC regulator of megakaryocytopoiesis and thrombocytopoiesis (designated Mpl ligand, thrombopoietin [TPO], megakaryocyte growth and development factor [MGDF] or megapoietin)1-7 has been identified as the ligand for the c-mpl proto-oncogene.8-10 In vitro, TPO promotes the proliferation and differentiation of megakaryocyte colony-forming cells (MK-CFC), the ploidization and maturation of MKs, and proplatelet formation.11 However, the action of TPO is not restricted to the megakaryocytic lineage. TPO acts additively or synergistically with several early and late-acting cytokines to promote the growth of primitive stem cells,12-15 as well as progenitor cells giving rise to burst-forming unit-erythroid (BFU-E),16,17 granulocyte-macrophage colony-forming cells (GM-CFC), and pluripotent colony-forming unit-granulocyte erythroid megakaryocyte macrophage (CFU-GEMM) colonies. In vivo, TPO is the most potent stimulator of platelet production. As demonstrated by several animal and human studies, TPO/pegylated (PEG)-MGDF (a truncated version of the TPO protein covalently attached to a polyethylene glycol tail to increase the circulating half life of the protein and its in vivo potency) injections result in a dose-dependent increase of platelets and MK.4,18-20 TPO administration also expands the pool of BFU-E and GM-CFC in mice21 and increases the concentration of marrow CFU-GEMM in monkeys.19 Moreover, while platelets are the only mature blood cells affected by the inactivation of the TPO or c-mpl genes, the absolute number of megakaryocytic, erythroid, granulocyte-macrophage progenitor cells and the primitive progenitors producing blast colonies in vitro (CFU-blast), decreased by 50% in hematopoietic tissues from both types of mice.22,23 Finally, in myelosuppressed mice, TPO injections24,25 or TPO delivery using an adenoviral vector26 accelerated not only platelet recovery27 but also red blood cell and neutrophil recovery.
TPO is a hormone, produced primarily by the liver and the kidney,1,2 acting on target cells present in hematopoietic tissues. Before the cloning of the TPO gene, it was demonstrated that the TPO plasma level was inversely correlated to the platelet mass and that TPO clearance might occur by binding to platelets.7,28 Recent data have shown that transcriptional regulation of the TPO gene does not occur in the liver or kidney following alteration of the platelet mass.29-32 In addition, it was shown that platelets bind radioiodinated TPO via the MPL receptor and then internalize and catabolize the molecule.31 Furthermore, experimental models of platelet variation in mice,32 analysis of plasma TPO levels in NF-E2 knock-out mice,33 or measurement of plasma TPO levels in human disease,34 strongly suggest that both the platelet and megakaryocyte mass influence the circulating TPO level.
It has recently been suggested that TPO might be involved in human diseases, notably as an autocrine growth factor for leukemic cells,35,36 and in essential thrombocythemia.37 To evaluate the pathology associated with a long-term exposure to high doses of TPO in vivo, we introduced and expressed the murine TPO cDNA in murine long-term repopulating hematopoietic stem cells using a retroviral vector. As previously described by others using a similar experimental approach,38 39 mice developed a thrombocytosis associated with myelofibrosis, osteosclerosis, and extramedullary hematopoiesis, a syndrome closely related to idiopathic myelofibrosis in humans.
However, in contrast to previous studies,38 39 we show that dysregulation of TPO production also affected the erythroid and granulocyte-macrophage lineages, induced a severe anemia, abnormal platelets, a late thrombocytopenia and finally ended in lethal pancytopenia or blast transformation. Our study demonstrates that chronic exposure to high doses of TPO induces a pathology similar to the fatal one observed in the clinical evolution of human idiopathic myelofibrosis.
MATERIALS AND METHODS
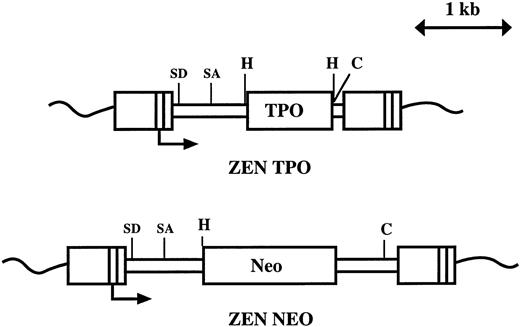
Construction and production of retroviruses. The viruses (Fig 1) are based on the MPZen2 vector containing a 3′ myeloproliferative sarcoma virus LTR.40 To construct the MPZenTPO retrovirus, a 1.07-kb Xho I-Xho I fragment encoding the murine TPO cDNA was inserted into the polylinker site of the MPZen2 plasmid. A 0.5-kb fragment of the virus located between the polylinker and the ClaI sites was excised. To construct the MPZenNeo vector, a HindIII-EcoRI fragment encoding a neomycin phosphotransferase (Neo) cDNA was inserted into the polylinker site of the MPZen2 plasmid DNA.
Structure of the MPZenTPO and MPZenNeo retroviruses. SD and SA indicate the positions of the splice donor and acceptor sites; H and C are the positions of the cleavage site for HindIII and Cla I, respectively. The transcription initiation site in the LTR is indicated with an arrow.
Structure of the MPZenTPO and MPZenNeo retroviruses. SD and SA indicate the positions of the splice donor and acceptor sites; H and C are the positions of the cleavage site for HindIII and Cla I, respectively. The transcription initiation site in the LTR is indicated with an arrow.
The GP+E-86 packaging cell line41 (kindly supplied by Dr A. Bank, Columbia University, New York, NY) was plated at 2 × 10⁶ cells in 10 mL Dulbecco's Modified Eagle's Medium (DMEM) (GIBCO-BRL, Grand Island, NY) containing 10% fetal calf serum (FCS) (Eurobio, Paris, France), 1 day before transfection. The MPZenTPO plasmid DNA (15 μg) was transfected with the pKJ-1 plasmid DNA (0.5 μg)42 carrying the Neo gene under the control of the phosphoglycerate kinase (PGK-1) gene promoter by the calcium phosphate precipitation method. One day after transfection, the GP+E-86 cells were plated in 192 wells (8 × 24 well plates, 1 mL/well) in the presence of 400 μg/mL G418 (GIBCO-BRL). After 15 days, G418-resistant clones (around 200) were isolated and expanded. Conditioned media (CM) from confluent cultures were assayed for TPO production and the ten best TPO-producer clones were tested for virus production.
The relative viral titer of the ten selected GP+E-86 clones was determined by comparing their ability to convert TPO-dependent FDC-P1/MPL-R cells, FDC-P1 cells expressing the MPL receptor, to growth factor independence. Briefly, 2 × 10⁵ FDC-P1/MPL-R cells were cocultivated in a 1/1 ratio with irradiated (20 Gy) GP+E-86 cells of each clone. After 2 days, nonadherent FDC-P1/MPL-R cells were collected, washed, and plated at 200 cells per dish in conventional agar cultures either in the presence of recombinant murine (r-mu) TPO (10 ng/mL, obtained from D. Foster, Zymogenetics, Seattle, WA) or no growth factor. The percentage of cells giving rise to a colony in nonstimulated cultures was calculated after 1 week of incubation.
Infection of bone marrow cells. The infection procedure has been previously described.43 Briefly, 4 days after 5-fluorouracil (5-FU) treatment (one injection of 150 mg/kg administered intravenously [IV]), bone marrow cells from two femurs were cocultivated for 4 to 5 days in 20 mL DMEM, 20% FCS, 10% pokeweed mitogen-stimulated spleen cell conditioned medium (PWM-SCM), with 1 × 10⁵ MPZenTPO or MPZenNeo virus-producing GP+E-86 cells each in a 100-mm tissue culture petri dish. Nonadherent cells were removed and injected into lethally irradiated mice.
Mice. Specific pathogen-free C57BL/6J female mice between 2 and 4 months of age were purchased from Janvier (Lyon, France) and maintained in sterile housing. For transplantation studies, lethally (9.5 Gy, 60Co gamma rays) irradiated animals were injected IV with 1 to 5 × 10⁶ infected cells. Mice, grafted with bone marrow cells resulting from five separate infections with either MPZenTPO or MPZenNeo viruses, were analyzed from 1 week to 1 year after transplantation.
Peripheral blood collected from the retro-orbital plexus of anesthetized animals was used to analyze nucleated cells, platelets, hematocrits, progenitor cells, and plasma TPO levels. Bone marrow cells were removed by flushing both femurs. Spleens were weighed and single cell suspensions were prepared.
CFU-S and secondary recipients. To evaluate MPZenTPO virus transduction frequencies in primitive stem cells, individual spleen colonies derived from day 13 CFU-S were dissected from nonconfluent spleens of mice grafted with 2.5 or 20 × 104 infected marrow cells. Single cell suspensions were prepared and 10% of the cells were plated in 1 ml nonstimulated liquid cultures to prepare conditioned media (CM). The frequency of day 9 CFU-S present in the blood, bone marrow, spleen, and peritoneal cavity of mice repopulated either with MPZenTPO- or MPZenNeo-infected cells was compared using a standard method. Secondary recipients were grafted with either 1.5 to 0.75 × 10⁶ spleen cells or 2.5 × 10⁴ bone marrow cells taken from primary recipients 1, 2, or 6 months after transplantation.
Progenitor cell assays. Conventional 1 mL agar medium cultures44 were used to determine the numbers of GM-CFC, MK-CFC, and BFU-E in hematopoietic tissues. Duplicate cultures were maximally stimulated with PWM-SCM and rhuEPO (2 U/mL; Amersham, Les Ulis, France). Colonies (>50 cells) were scored after 7 days of incubation at 37°C in a fully humidified atmosphere of 10% CO2 in air. Cultures were fixed with 2.5% glutaraldehyde, transferred to glass slides, and stained for acetylcholinesterase to identify MK colonies and hematoxylin for erythroid, granulocyte, and macrophage colonies. CFU-E frequency was determined in 1 mL methylcellulose cultures stimulated with 1 U/mL rhuEPO as previously described.44 Colonies were scored under an inverted microscope after 2 days incubation at 37°C in a fully humidified atmosphere of 5% CO2 in air. Cultures were initiated with 5 × 10⁴ cells/mL for bone marrow and 1 × 10⁵ cells/mL for spleen, peritoneal, or light density peripheral blood cells (separated on a Ficoll-Hypaque gradient, density 1.077; Pharmacia, Uppsala, Sweden).
For each determination, hematopoietic tissues from mice transplanted with MPZenTPO virus-infected cells were cultured in parallel with those from mice transplanted with MPZenNeo virus-infected cells as a control. Total marrow progenitor cell numbers were calculated from the bone marrow cellularity assuming that one femur represented 6% of the total marrow. Total numbers of progenitor cells in the spleen or peritoneal cavity were calculated from the number of cells isolated from these tissues. Total numbers of circulating progenitor cells were calculated assuming that 2 mL was the total blood volume.
TPO level determination of reconstituted mice. TPO levels in plasma or CM were measured using a microwell assay in Terasaki plates45 with the murine Ba/F3-muMPL-R cell line (200 cells/well).5 TPO concentrations were calculated by assigning 1 U/mL to the concentration resulting in 50% cell survival after 2 to 3 days of incubation. Dose-response curves performed using rmuTPO, 1 U TPO was equal to 100 pg of rmuTPO. To ensure that the activity measured in this assay corresponded to TPO, two controls were used. First, plasma collected 30 days and 152 days following reconstitution of mice with MPZenTPO-infected cells were assayed in parallel using the parental Ba/F3 cell line, which proliferates in response to mu-IL-3. Second, plasma diluted 1/1,000 in DMEM was assayed in the presence of recombinant soluble muMPL-R (obtained from Dr S. Lok, ZymoGenetics).
Southern blot analysis. DNA from the bone marrow, spleen, thymus, or blood cells of reconstituted mice was isolated by overnight digestion with proteinase K (0.3 mg/mL) in a 50 mmol/L Tris solution (pH 8) containing sodium dodecylsulfate (SDS 0.6%), EDTA (1 mmol/L) and NaCl (100 mmol/L). DNA (30 μg/point) was digested by HindIII (GIBCO-BRL). The digests were size-fractionated by electrophoresis in 1% agarose gels, and the gels were blotted to Hybond N+ membranes. The blots were hybridized with the 32P-labeled 1.07-kb TPO cDNA fragment. Blots were washed four times in 2X SSC/0.1% SDS at room temperature and three times in 0.1X SSC/0.1% SDS at 65°C. Autoradiography was performed using Kodak X-OMAT AR film (Kodak Pathé, Marne La Vallée, France). Quantification of the bands was performed with a phosphorimager system (Molecular Dynamic, MACBAS program).
Northern blot analysis. Total RNA from the liver, kidney, and spleen of normal mice and mice transplanted with MPZenTPO or MPZenNeo virus-infected marrow cells was extracted as described by Chomczynsky and Sacchi.46 Total RNA (20 μg) was electrophoresed through a 1% agarose gel in the presence of 2.2 mol/L formaldehyde and transferred to GeneScreen hybridization transfer membranes (NEN Dupont) in 0.025 mol/L phosphate buffer (pH 6.5). Hybridization was carried out for 16 hours at 42°C with a 32P randomly labeled (Rediprime, Amersham) Pst I/Nco I fragment of the murine TPO cDNA (nucleotides 380 to 949 of the coding sequence).47 The membranes were washed twice with 2× SSC/0.1% SDS at room temperature, and twice with 0.1X SSC/0.1% SDS at 56°C.
Histology. Tissue samples of liver, spleen, kidney, and bone marrow were routinely fixed in Bouin's fluid or in 10% (vol/vol) phosphate-buffered formalin. Bones were decalcified before processing using DCLMR (CellPath, England). Fixed tissues were processed using standard histologic methods and paraffin embedded. Four to 5 micron sections were routinely stained with hematoxylin eosin, periodic acid Schiff (PAS), Giemsa, or silver-stained according to Gordon-Sweet.
Ultrastructural studies. Blood was withdrawn into ACD buffer (6.8 mmol/L citric acid, 11.2 mmol/L trisodium citrate, 24 mmol/L glucose, pH 6.5) and centrifuged. Platelets overlaying the buffy coat were fixed with 3% glutaraldehyde in phosphate buffer 0.1 mol/L, pH 7.4 for 1 hour, postfixed in 1% osmium tetroxide, dehydrated, and embedded in Epon. Thin sections were stained with uranyl acetate and lead citrate and observed with a Philips CM 10 electron microscope (Philips, Eindoven, The Netherlands).
RESULTS
Selection of a MPZenTPO high titer virus-producing clone. To study the effect of dysregulated TPO production by hematopoietic cells, TPO was expressed from the MPZen retrovirus LTR (Fig 1) in transplanted bone marrow cells. GP+E-86 virus-producing clones were selected for their ability to secrete high amounts of TPO in their supernatants and to convert a large percentage of FDC-P1/MPL-R cells to growth factor independence. The selected clone (GP122) secreted approximately 6 × 10³ U/mL of TPO (48-hour CM of confluent cultures) and infected a mean of 75% of FDC-P1/MPL-R cells after 2 days of co-culture. Randomly selected autonomous FDC-P1/MPL-R clones (20 clones studied) secreted between 2,000 and 10 U/mL of TPO (48-hour CM initiated with 1 × 10⁵ cells/mL).
TPO expression in mice transplanted with MPZenTPO-infected cells. To determine if multipotential hematopoietic progenitors were infected with the MPZenTPO virus, spleen colonies were isolated on day 13 (day 13 CFU-S) after transplantation and analyzed for TPO production as described in Materials and Methods. TPO activity (from 1 to 128 U/mL) was found in the CM of 7 of 13 randomly selected colonies. In contrast, no TPO activity was detected in 10 of 10 colonies isolated from mice transplanted with bone marrow cells infected with the MPZenNeo virus.
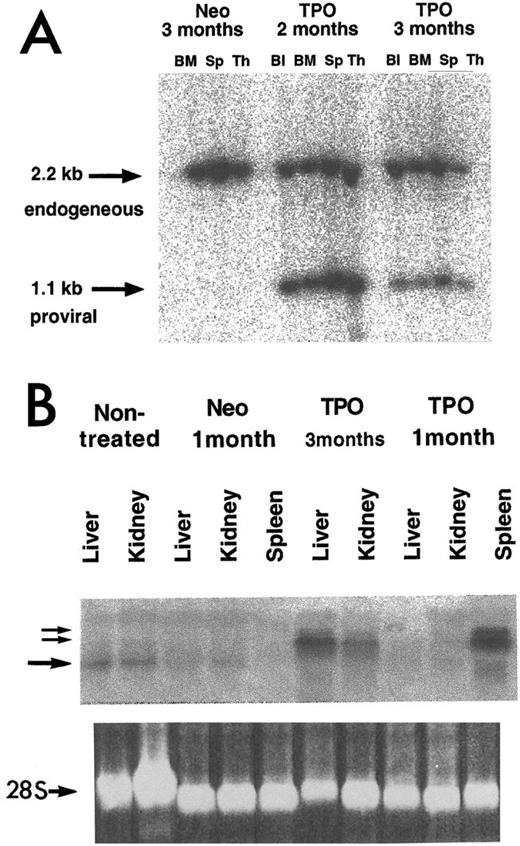
To estimate the proportion of transduced cells in hematopoietic organs, Southern blot analysis was carried out on HindIII-digested genomic DNA. HindIII cuts twice in the MPZenTPO provirus removing the complete TPO cDNA (Fig 1). Provirus (1.1 kb) was clearly detected in the blood, bone marrow, spleen, and thymus (Fig 2A). The intensities of the bands corresponding to the provirus gene represented 80% to 100% or 20% to 60% of those corresponding to the endogenous TPO gene (2.2 kb) in the different tissues harvested from mice analyzed 2 and 3 months posttransplantation, respectively. To analyze further the levels of provirus transcription, Northern analyses of total RNA was performed 1 and 3 months after transplantation. Extremely high levels of TPO transcripts encoded by the MPZenTPO virus were seen in the spleen 1 and 3 months after transplantation (Fig 2B). In mice studied 3 months after transplantation, retroviral transcripts were also found in the liver and kidney (Fig 2B). As revealed by histologic examination (see below), this was likely due to an infiltration of these organs by hematopoietic cells. Together, these data show that the hematopoietic system of the transplanted mice was repopulated with cells that had stably integrated the provirus and that transcription of TPO mRNA encoded by the virus occurred for several months.
Analysis of integrated provirus and mRNA expression in tissues from MPZenTPO (TPO) or MPZenNeo (Neo) recipient mice studied 1, 2, or 3 months after transplantation. Analyses were carried out using a phosphorimager. (A) Proviral integrants were detected using HindIII-digested DNAs from blood (Bl), bone marrow (BM), spleen (Sp), and thymus (Th). The membrane was hybridized with a full-length muTPO cDNA probe. The 1.1-kb band arises from a fragment of the ZenTPO provirus (Fig 1) and the 2.2-kb arises from a fragment of the endogenous TPO gene. (B) Total RNA (20 μg/lane) was extracted from the liver, kidney, or spleen of normal (nontreated), MPZenNeo (Neo) or MPZenTPO (TPO) reconstituted mice. The two small arrows indicate TPO mRNAs transcribed from the retroviral LTR via a cryptic splicing (≈2.2- and ≈2.6-kb bands). The large arrow indicates the endogenous TPO transcripts (≈1.7 kb). The lower panel shows the ethidium bromide-stained 28S RNA band.
Analysis of integrated provirus and mRNA expression in tissues from MPZenTPO (TPO) or MPZenNeo (Neo) recipient mice studied 1, 2, or 3 months after transplantation. Analyses were carried out using a phosphorimager. (A) Proviral integrants were detected using HindIII-digested DNAs from blood (Bl), bone marrow (BM), spleen (Sp), and thymus (Th). The membrane was hybridized with a full-length muTPO cDNA probe. The 1.1-kb band arises from a fragment of the ZenTPO provirus (Fig 1) and the 2.2-kb arises from a fragment of the endogenous TPO gene. (B) Total RNA (20 μg/lane) was extracted from the liver, kidney, or spleen of normal (nontreated), MPZenNeo (Neo) or MPZenTPO (TPO) reconstituted mice. The two small arrows indicate TPO mRNAs transcribed from the retroviral LTR via a cryptic splicing (≈2.2- and ≈2.6-kb bands). The large arrow indicates the endogenous TPO transcripts (≈1.7 kb). The lower panel shows the ethidium bromide-stained 28S RNA band.
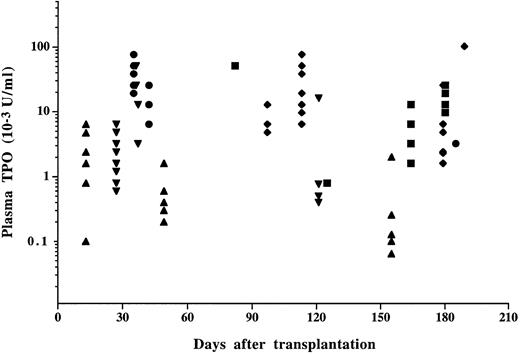
No TPO activity was detected (<4 U/mL) in plasma from control mice when studied 1 month posttransplant and thereafter. In contrast, plasma TPO activity in mice transplanted with MPZenTPO virus-infected bone marrow cells was dramatically elevated and remained so (median value of 10.4 ± 17.7 × 10³ U/mL, n = 111) throughout the survey (Fig 3). To prove that TPO was indeed the activity measured in the bioassay, we verified that plasma from MPZenTPO recipients was unable to sustain the survival of the parental Ba/F3 cells and that the activity inducing the proliferation of the Ba/F3-muMPL-R cells was abolished by the addition of a soluble form of the murine MPL-R (data not shown). Large variations in TPO activity (from 26 ± 21 to 1.4 ± 1.8 × 10³ U/mL) were noted among four different sets of infected mice suggesting that circulating TPO levels were directly correlated to the efficiency of infection. Mice having the highest plasma TPO levels died earlier than mice with lower levels. TPO activity was usually detected in CM prepared from bone marrow (115 ± 83 U/mL, n = 5), spleen (166 ± 97 U/mL, n = 5), peritoneal (411 ± 446 U/mL), and blood (567 ± 258 U/mL, n = 2) cells from MPZenTPO-infected mice. In contrast, no level or low levels of TPO activity (4 ± 6 U/mL, range 0-16 U/mL, n = 8) were detected in MPZenNeo-infected animals.
TPO activity in the plasma from mice transplanted with MPZenTPO virus-infected bone marrow cells. Each symbol represents the data from a different recipient. Different symbols (▪, •, ♦, ▴, ▾) correspond to different infected groups. Identical values are superimposed. No TPO activity was detected in the plasma from MPZenNeo recipient mice when studied later than 3 weeks posttransplantation.
TPO activity in the plasma from mice transplanted with MPZenTPO virus-infected bone marrow cells. Each symbol represents the data from a different recipient. Different symbols (▪, •, ♦, ▴, ▾) correspond to different infected groups. Identical values are superimposed. No TPO activity was detected in the plasma from MPZenNeo recipient mice when studied later than 3 weeks posttransplantation.
Abnormalities in mice transplanted with MPZenTPO-infected cells. All mice transplanted with MPZenTPO virus-infected bone marrow cells died between 89 and 304 days posttransplantation (median survival time, 218 days) (Fig 4). No death was observed in the control MPZenNeo group.
Survival curve of mice reconstituted with MPZenTPO virus-infected bone marrow cells. Pooled data from 30 mice (five separate infection experiments) studied from 1 to 10 months after transplantation.
Survival curve of mice reconstituted with MPZenTPO virus-infected bone marrow cells. Pooled data from 30 mice (five separate infection experiments) studied from 1 to 10 months after transplantation.
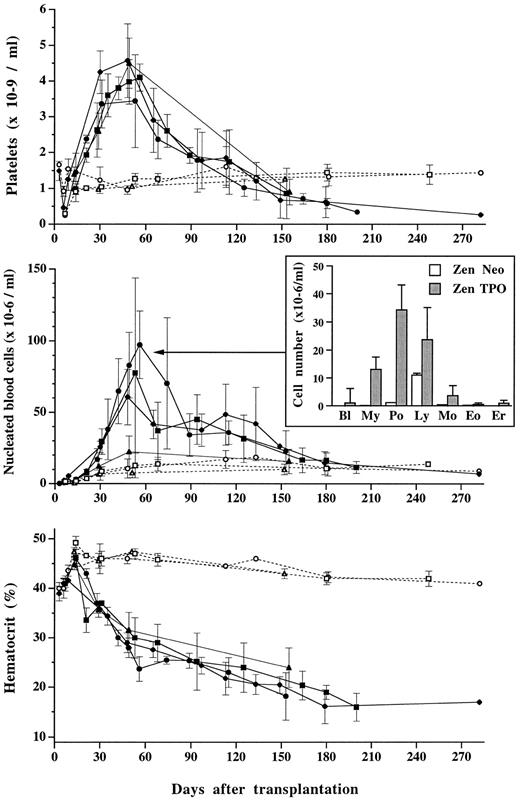
Peripheral blood cells. A striking feature of the MPZenTPO recipients was the transient elevation of platelet counts. After a thrombocytopenic state resulting from irradiation (nadir on day 10), platelet numbers sharply increased over 30 to 40 days achieving maximal values fourfold higher than controls (mean maximal value: 4.15 ± 0.52 × 10⁶/μL, n = 30; four separate infections v 1.1 ± 0.2 × 10⁶/μL in controls). No correlation between the highest platelet numbers and TPO levels was observed. Rather, similar maximal numbers of platelets (4.1 ± 0.4 × 10⁶/μL or 4.5 ± 0.7 × 10⁶/μL) were recorded in groups of mice displaying high or low TPO levels, 11 ± 7 × 10³ U/mL or 0.7 ± 0.8 × 10³ U/mL, respectively. A progressive drop in platelet numbers occurred 2 months posttransplantation, ultimately resulting in severe thrombocytopenia (Fig 5, upper panel). On blood smears stained with May-Grünwald-Giemsa, large platelets with basophilic cytoplasm were seen. The percentage of these large platelets (15.4% ± 5.8%, including 2.5% ± 1.8% having a size similar to that of red blood cells) did not vary significantly either with time after transplantation or with plasma TPO levels.
Platelet (top panel), nucleated blood cell (center panel), and hematocrit (lower panel) levels in mice transplanted with MPZenTPO (▪, •, ♦, ▴; plain lines) or MPZen Neo (□, ○, ▵; dashed lines) virus-infected bone marrow cells. Each point represents the mean value (±SD) from recipients (n = 2 to 14) obtained from the same infected group. Different symbols correspond to different infected groups; these are the same as the ones used in Fig 2. In the center panel, the histogram represents the mean number (±SD) of blast cells (Bl), myeloid precursor cells (My), neutrophils (Po), lymphocytes (Ly), eosinophils (Eo), and erythroblasts (Er) counted in the peripheral blood from MPZenTPO (▪, n = 11) or MPZenNeo (□, n = 5) recipient mice studied between 53 and 56 days after transplantation.
Platelet (top panel), nucleated blood cell (center panel), and hematocrit (lower panel) levels in mice transplanted with MPZenTPO (▪, •, ♦, ▴; plain lines) or MPZen Neo (□, ○, ▵; dashed lines) virus-infected bone marrow cells. Each point represents the mean value (±SD) from recipients (n = 2 to 14) obtained from the same infected group. Different symbols correspond to different infected groups; these are the same as the ones used in Fig 2. In the center panel, the histogram represents the mean number (±SD) of blast cells (Bl), myeloid precursor cells (My), neutrophils (Po), lymphocytes (Ly), eosinophils (Eo), and erythroblasts (Er) counted in the peripheral blood from MPZenTPO (▪, n = 11) or MPZenNeo (□, n = 5) recipient mice studied between 53 and 56 days after transplantation.
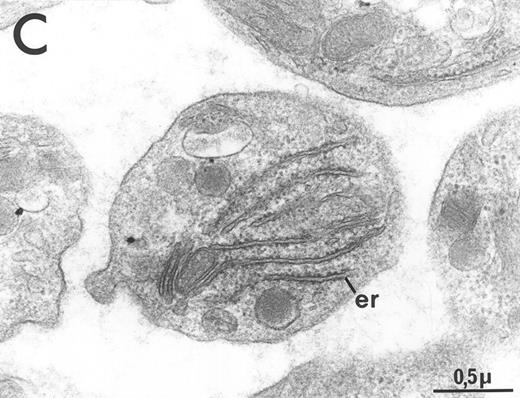
Electron microscopy revealed a general increase in platelet size and substantial heterogeneity in the distribution of alpha granules and the surface connected canalicular system (Fig 6). Significant glycogen deposition was occasionally seen. A striking feature was the abundance of the rough endoplasmic reticulum system, reflecting the basophilia of platelets noted on blood smears. Dense bodies were rarely observed (Fig 6), and it could not be determined if this was due to a secretion during platelet preparation or a true decrease in the dense body content of circulating platelets.
Ultrastructure of circulating platelets from MPZenNeo (A) or MPZenTPO (B) reconstituted mice. db, dense body; er, endoplasmic reticulum; gly, glycogen. The figure emphasizes the abnormally large size of some platelets seen in MPZenTPO reconstituted mice. (C) Enlargement of a giant platelet showing a richness in glycogen and in endoplasmic reticulum. Platelet shape and ultrastructure did not reveal any signs of activation other than the rare occurrence of dense bodies in MPZenTPO platelets.
Ultrastructure of circulating platelets from MPZenNeo (A) or MPZenTPO (B) reconstituted mice. db, dense body; er, endoplasmic reticulum; gly, glycogen. The figure emphasizes the abnormally large size of some platelets seen in MPZenTPO reconstituted mice. (C) Enlargement of a giant platelet showing a richness in glycogen and in endoplasmic reticulum. Platelet shape and ultrastructure did not reveal any signs of activation other than the rare occurrence of dense bodies in MPZenTPO platelets.
Platelet activation was studied 1 and 3 months post-grafting by assessing thrombin-induced translocation of the granule membrane protein P-selectin (CD62) on the platelet surface. Using flow cytometry, no increase of CD62 surface expression was observed on resting platelets. Similar thrombin-dose response characteristics were found in mice transplanted with either MPZenTPO or MPZenNeo-infected cells (data not shown), indicating that permanent high dose TPO exposure did not activate or prime platelets to this agonist.
Nucleated blood cell numbers (WBC) in MPZenTPO mice varied with time after transplantation and paralleled the changes in platelet numbers (Fig 5, center panel). One month posttransplantation, a significant rise was observed peaking approximately 1 month later (mean value: 64 ± 32 × 103/μL, n = 30, 4 separate infections v 10.3 ± 2.6 × 10³/μL in controls). The number of WBC was three- to eight-fold increased, depending on the infected group. These differences may be related to TPO levels since the highest values were recorded in mice displaying the highest plasma TPO levels. Leukocytosis was mainly due to neutrophilia (30-fold increase compared with the control group), but a large proportion of blasts and immature myeloid cells (27%) and a few circulating erythroblasts were also seen (Fig 5). Elevated WBC counts were still observed 5 months posttransplantation, but moribund mice displayed similar or lower counts than control mice.
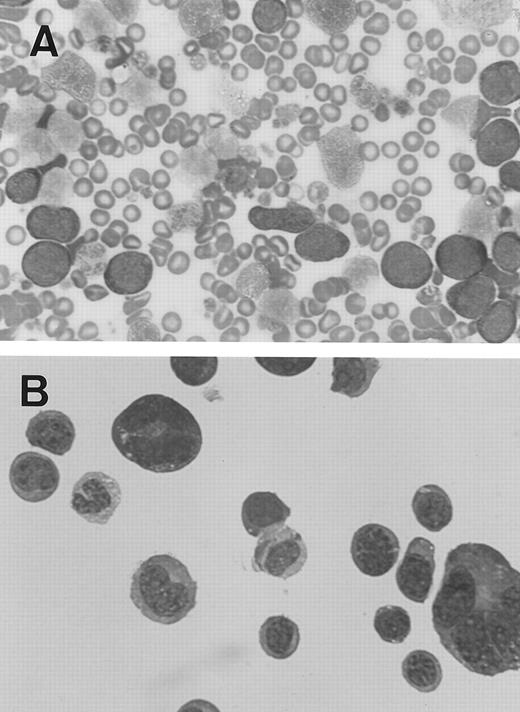
Out of 32 MPZenTPO recipient mice found to be moribund, two (from different infected groups) were found on days 74 and 89 with extremely high numbers of WBC (mouse 1-7: 150 × 103 cells/μL; mouse 2-9: 130 × 103 cells/μL). On May-Grünwald-Giemsa–stained blood smears, the majority of these WBCs were undifferentiated blast cells (Fig 7A). Blast cells were also seen in all examined tissues including the bone marrow, spleen, peritoneal cavity (Fig 7B), liver, lung, and kidney. Morphologic examination of these cells suggested that they had an erythroid or megakaryocytic origin. However, we were unable to demonstrate the lineage origin of these blast cells and they did not stain positively for acetylcholinesterase. In a similar case developing in a secondary recipient, blast cells were negative for benzidine and acetylcholinesterase and the ultrastructural demonstration of peroxidase including platelet peroxidase. They were negative to the following monoclonal antibodies: 4A5, a platelet marker; Ter 119, an erythroid marker; Gr 1, a granulocytic marker; Mac 1, a macrophage marker; B220, a B lymphoid marker; or CD4/CD8, T lymphoid markers (data not shown). Peritoneal blast cells from mouse 2-9 were cultured in nonstimulated and PWM-SCM–stimulated liquid cultures. In stimulated cultures only, blasts and megakaryocyte-like cells were produced for more than a month but thereafter a mast-like cell line developed and permeated the culture.
Blast cells from two MPZenTPO recipient mice that died prematurely after transplantation with elevated nucleated blood cell counts (May-Grünwald-Giemsa staining; original magnification × 100). (A) Blood smear from the first mouse, (B) cytospin smear from peritoneal cells of the second mouse (note the presence of two megakaryocytes).
Blast cells from two MPZenTPO recipient mice that died prematurely after transplantation with elevated nucleated blood cell counts (May-Grünwald-Giemsa staining; original magnification × 100). (A) Blood smear from the first mouse, (B) cytospin smear from peritoneal cells of the second mouse (note the presence of two megakaryocytes).
In contrast to platelet and WBC numbers, hematocrits of mice transplanted with the MPZenTPO virus-infected cells rapidly declined (Fig 5, lower panel). After a slight increase observed during the first 2 weeks posttransplantation, the hematocrit values irreversibly declined reaching 29% ± 3% 2 months after transplantation (n = 30; four separate infections). All mice died with a severe anemia.
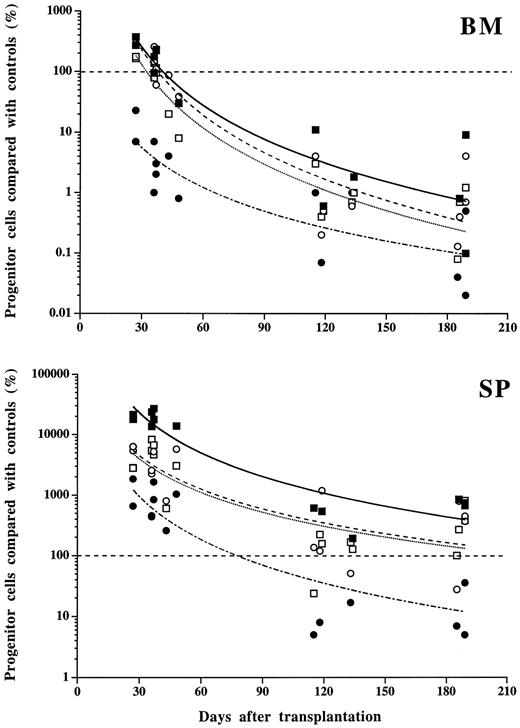
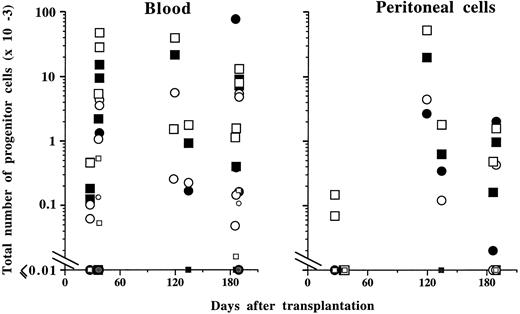
Progenitor cells. Changes in progenitor cell numbers in the marrow and spleen paralleled those observed in mature cells in the blood. Early after transplantation (days 30 to 60), the total numbers of MK-CFC, GM-CFC, or BFU-E (spleen plus marrow) were 9 ± 4-, 3.5 ± 0.3-, and 9 ± 1-fold increased, respectively, when compared with control MPZenNeo-transplanted mice (Fig 8). This augmentation was predominantly seen in spleens with a respective 170-, 60-, and 61-fold increase, while only insignificant variations were detected in the marrow. In contrast, CFU-E were markedly decreased by 90% in the marrow and only increased 13-fold in the spleen. Late after transplantation (>4 months), the pancytopenia corresponded to a dramatic decrease in the total number of spleen and marrow progenitor cells from all lineages (13% ± 5%, 3% ± 2%, 9% ± 6% or 1% ± 1% of controls for MK-CFC, GM-CFC, BFU-E, or CFU-E, respectively; Fig 8). These decrements were due to the disappearance of progenitor cells from the marrow (from 99% to 96% of control values according to the different progenitor types), which was not compensated for by significantly increased numbers in the spleen (0.3- to 6-fold increase depending on the progenitor cell types). Extramedullary and extrasplenic hematopoiesis was diffuse. In the blood, elevated numbers of progenitor cells from all lineages were often detected at both early and late times after transplantation (Fig 9). In the peritoneal cavity, an unusually high number of progenitor cells was observed late after transplantation (Fig 9).
Progenitor cell numbers in bone marrow (BM) and spleen (SP) from mice transplanted with MPZenTPO virus-infected bone marrow cells. Values plotted are the percentage of BFU-E (○), CFU-E (•), GM-CFC (□), or MK-CFC (▪) from MPZenTPO recipients compared with matched MPZenNeo recipients. Identical values are superimposed. Curve fittings (power type) and symbols correspond to different types of progenitor cells.
Progenitor cell numbers in bone marrow (BM) and spleen (SP) from mice transplanted with MPZenTPO virus-infected bone marrow cells. Values plotted are the percentage of BFU-E (○), CFU-E (•), GM-CFC (□), or MK-CFC (▪) from MPZenTPO recipients compared with matched MPZenNeo recipients. Identical values are superimposed. Curve fittings (power type) and symbols correspond to different types of progenitor cells.
Total number of progenitor cells in the peripheral blood and peritoneal cavity from mice transplanted with MPZenTPO virus-infected bone marrow cells. The same progenitor cell symbols as in Fig 8 are used. Data from MPZenNeo reconstituted mice are indicated using the same progenitor cell symbols except that these are colored in gray and are of smaller sizes than the ones used for MPZenTPO recipient mice.
Total number of progenitor cells in the peripheral blood and peritoneal cavity from mice transplanted with MPZenTPO virus-infected bone marrow cells. The same progenitor cell symbols as in Fig 8 are used. Data from MPZenNeo reconstituted mice are indicated using the same progenitor cell symbols except that these are colored in gray and are of smaller sizes than the ones used for MPZenTPO recipient mice.
Increased numbers of day 9 CFU-S were observed early after transplantation (2.7-fold increase in the total number of CFU-S in the marrow and spleen 37 days after transplantation). This was due to a large increase in splenic CFU-S numbers. Late after transplantation, there was a dramatic decrease in the number of CFU-S (2% of controls in the total number of CFU-S in the marrow and spleen 4 to 5 months after transplantation). Unusually large numbers of CFU-S were observed in the blood (≈100-fold increase compared with controls) and the peritoneal cavity (from 60 to 680 CFU-S/mice).
Secondary recipients. These abnormalities were transplantable to lethally irradiated secondary recipients using spleen or bone marrow cells from primary recipients. The myeloproliferative syndrome was less severe than the one observed in primary recipients. Indeed, out of 30 reconstituted hosts followed for a year, only 5 died between 297 and 348 days posttransplant. Moreover, the anemia was moderate and the number of nucleated blood cells was usually normal (Fig 10). In contrast, the number of platelets was usually more elevated than the ones recorded in primary recipients and no thrombocytopenia was observed. Except for rare mice, circulating levels of TPO were low (Fig 10).
Hematologic parameters from secondary reconstituted mice. Platelet (upper panel left), plasma TPO (upper panel right), hematocrit (lower panel left), and nucleated blood cell (lower panel right) levels in secondary recipients transplanted with spleen cells from four primary MPZenTPO recipients killed 4 (2 mice) or 6 (2 mice) months after transplantation. Each point represents an individual mouse with identical values superimposed. Curves are drawn from mean values. Data from 6, 10, or 9 secondary recipient mice are represented 85, 165, or 350 days after transplantation, respectively. Only 1 of these 10 mice followed for more than a year died (314 days after transplantation).
Hematologic parameters from secondary reconstituted mice. Platelet (upper panel left), plasma TPO (upper panel right), hematocrit (lower panel left), and nucleated blood cell (lower panel right) levels in secondary recipients transplanted with spleen cells from four primary MPZenTPO recipients killed 4 (2 mice) or 6 (2 mice) months after transplantation. Each point represents an individual mouse with identical values superimposed. Curves are drawn from mean values. Data from 6, 10, or 9 secondary recipient mice are represented 85, 165, or 350 days after transplantation, respectively. Only 1 of these 10 mice followed for more than a year died (314 days after transplantation).
Hematopoietic tissues. The marrow cellularity of recipients transplanted with MPZenTPO virus-infected cells was lower than in the control group at all times observed. One month posttransplantation, the number of nucleated cells was 2.4-fold lower than control (136 ± 21 × 105 cells/2 femurs v 323 ± 78 × 105 cells/2 femurs in controls; n = 6). After 3 months, less than a million cells could be flushed from these bones (5.7 ± 5 × 10⁵ cells/2 femurs v 499 ± 87 × 105 cells/2 femurs in controls; n = 10). On histologic sections from bones performed 1 month after transplantation, the major features were a massive hyperplasia of maturing granulocytic cells and MKs, while erythroblasts were rarely seen. MKs were variably sized, slightly dysmorphic, and often observed in clusters. An increased deposition of reticulin fibers and a slight and irregular enlargement of the cortical thickness were seen in some areas. Rare bone spicules were observed in the marrow cavity (Fig 11A). Two to 3 months after transplantation, increased deposition of reticulin fibers was regularly noted and occasionally obliterated the marrow cavity. Collagen and new bony trabeculae were seen as well as increased cortical thickness. Widespread necrosis with edema was occasionally observed. Seven months posttransplantation, a dense myelofibrosis and newly formed bone trabeculae with apposed osteoblasts filled the marrow cavity (Fig 11B). The thickness of the cortical was at least twice that of bones from the control group (Fig 11C).
Histologic sections of tissues from MPZenTPO reconstituted mice studied 2 or 7 months posttransplant. (A) Myeloid hyperplasia in the femur from a mouse 2 months after transplantation. Note the elevated cell concentration in the center of the bone cavity (hematoxylin-eosin staining; original magnification × 40). (B and C) Myelofibrosis demonstrated by deposition of reticulin fibers and osteosclerosis in the femur 7 months posttransplant (Gordon-Sweet and hematoxylin-eosin stainings, respectively; original magnification × 100 and × 40, respectively). (D) Megakaryocytic hyperplasia in the spleen 2 months posttransplant (hematoxylin-eosin staining, original magnification × 400). (E) Fibrosis (Gordon-Sweet staining, original magnification × 400) and (F) accumulation of collagen fibers (hematoxylin-eosin staining, original magnification × 400) in spleen 7 months posttransplant. Extramedullary hematopoiesis seen in liver (G), kidney (H), and lymph node (I) 7 months posttransplant (hematoxylin-eosin, hematoxylin-eosin and Periodic Acid Schiff stainings, respectively; original magnification × 400, × 400, and × 250, respectively).
Histologic sections of tissues from MPZenTPO reconstituted mice studied 2 or 7 months posttransplant. (A) Myeloid hyperplasia in the femur from a mouse 2 months after transplantation. Note the elevated cell concentration in the center of the bone cavity (hematoxylin-eosin staining; original magnification × 40). (B and C) Myelofibrosis demonstrated by deposition of reticulin fibers and osteosclerosis in the femur 7 months posttransplant (Gordon-Sweet and hematoxylin-eosin stainings, respectively; original magnification × 100 and × 40, respectively). (D) Megakaryocytic hyperplasia in the spleen 2 months posttransplant (hematoxylin-eosin staining, original magnification × 400). (E) Fibrosis (Gordon-Sweet staining, original magnification × 400) and (F) accumulation of collagen fibers (hematoxylin-eosin staining, original magnification × 400) in spleen 7 months posttransplant. Extramedullary hematopoiesis seen in liver (G), kidney (H), and lymph node (I) 7 months posttransplant (hematoxylin-eosin, hematoxylin-eosin and Periodic Acid Schiff stainings, respectively; original magnification × 400, × 400, and × 250, respectively).
Spleen weights were increased five-fold compared with controls 1 month after transplantation (389 ± 158 mg v 79 ± 14 mg in controls; n = 6), but spleen size decreased slightly thereafter (two- to three-fold enlargement). Although spleens were quite large, the number of cells collected was only 1.3 times more elevated than in controls 1 month posttransplantation (1.7 ± 0.6 × 10⁸ cells/spleen v 1.3 ± 0.3 × 10⁸ in controls; n = 6) and dramatically decreased after 3 months of transplantation (0.18 ± 0.12 × 10⁸ cells/spleen v 1.26 ± 0.51 × 10⁸ in controls; n = 10). Histologic examination of spleens revealed hyperplasia of the red pulp. MKs were extremely abundant as well as neutrophils and eosinophils (Fig 11D). In contrast to the bone marrow, erythroblasts were present in the spleen but in relatively low proportion when compared with other lineages. The white pulp was always well preserved. No fibrosis was observed after 1 month of transplantation, but at 3 months deposits of reticulin fibers were observed, sometimes surrounding MKs (Fig 11E). An increase in collagen deposition and the thickness of the connective tissue was observed in the periphery of the spleen and surrounding the vessels (Fig 11F). At later times, bands of collagen circumscribed the red pulp rendering the splenic parenchyma a nodular appearance.
Extramedullary hematopoiesis. Extramedullary hematopoiesis, confirmed by the presence of numerous foci of hematopoietic cells in liver (Fig 11G), kidney (Fig 11H), lymph nodes (Fig 11I), thymus, peritoneum, and lung (not shown), was seen in mice reconstituted with MPZenTPO virus-infected bone marrow cells. These foci contained mainly MKs, neutrophils, and eosinophils. Few or no erythroblasts were observed. In contrast, extramedullary hematopoiesis was never observed in control MPZenNeo-reconstituted animals examined at a similar time posttransplantation.
DISCUSSION
The biologic effects of chronic exposure to MGDF via retroviral-mediated gene transfer in murine hematopoietic cells have recently been reported.38,39 These mice developed thrombocytosis, mild anemia, but no significant changes in WBC counts. No death was recorded over the 17 months of follow-up although fibrosis and osteosclerosis were seen in the spleen and bone marrow. In the present study we obtained different results using a similar strategy. First, all recipient mice developed a fatal disease with a mean survival time of ∼7 months. Second, during the first 2 months following transplantation, platelets with abnormal size and granule content appeared, WBC increased 10-fold, and hematocrits dropped rapidly to 20% to 30%. Third, this period was followed by a progressive decrease in the platelet, WBC, and red cell counts leading to severe pancytopenia. Finally, while pancytopenia seemed responsible for most of the deaths, some animals died with a syndrome evoking a leukemic transformation. None of the previous studies of dysregulated TPO production in mice, either by retrovirus,38,39 adenovirus,26,48 repeated MGDF injections,49 or transgenesis50 reported such unusual and dramatic features. Plasma levels of TPO in the MPZenTPO-reconstituted animals were extremely high (>1 μg/mL) and long-lasting compared with these earlier studies. As suggested from Southern and Northern blot analyses performed at 2 and 3 months after transplantation, these elevated levels seem to be due to high level transcription of the TPO viral gene from a majority of the hematopoietic cells. Differences in TPO levels between earlier studies and the present one may account for the different biological effects observed in mice. Indeed, our secondary reconstituted mice displayed low TPO levels and a mild disease similar to the one previously described using retroviruses.38,39 It has been suggested that the site of TPO secretion may play a role in the differences observed between the mild disease induced by TPO hepatic expression in transgenic mice and the severe phenotype induced by TPO retrovirus-mediated expression in hematopoietic tissues.50 However, when a high level of circulating TPO was obtained using an IV injection of an adenovirus vector targeting TPO expression mainly in liver cells, a severe disease was also observed in immunodeficient mice48 (and A. Abina, manuscript submitted). This observation further suggests that the severity of the disease is more related to the TPO level than to the site of production. Alternatively, the type of retrovirus,38 39 the strain of mice or the use of different TPO genes may partially explain these different phenotypes.
Our data are in accordance with previous reports19 21 demonstrating a stimulatory effect of TPO not only on the survival and proliferation of MK-CFC and MK maturation, but also on BFU-E, GM-CFC, and CFU-GEMM progenitor cells. In addition, we show that TPO also increases the compartment of day 9 CFU-S, mobilizes these progenitors into the blood and peritoneal cavity, but does not impair their capability to reconstitute the hematopoietic system of irradiated secondary hosts.
A large increase in WBC following the transplantation was observed. This has been rarely reported after TPO exposure.48 On one hand, the presence of a large percentage of myeloid precursor cells shows that release of cells from the marrow into the blood is partially responsible for this increase. On the other hand, the 30-fold increase in granulocyte count may be due to the synergistic effect of TPO with other growth factors such as G-CSF or GM-CSF.
The myeloproliferative disorder that developed in mice reconstituted with MPZenTPO virus-infected bone marrow has several characteristics in common with human idiopathic myelofibrosis. The early stages of this hematopoietic disorder is characterized by thrombocytosis, leukocytosis, and frequently a mild anemia. At later stages, the clinical picture evolves into a severe anemia with pancytopenia associated with massive marrow myelofibrosis and osteosclerosis, and extramedullary hematopoiesis in several organs. Splenomegaly is a frequent occurrence. Death is related to leukopenia, cardiac failure due to anemia, or leukemic transformation in rare cases.51-53 The hematopoietic disorder observed in mice reconstituted with MPZenTPO virus-infected bone marrow cells mimics that observed in the human disorder. Notably, 2 of 32 moribund MPZenTPO-reconstituted mice displayed a clinical picture evoking a leukemic transformation. The blood, spleen, bone marrow, and several other organs were massively infiltrated with blasts that did not react positively with a panel of lineage markers, preventing their identification. It should be pointed out that leukemic transformation has been rarely described in mouse models in which cytokine hyperproduction was induced by retroviral gene transfer.54
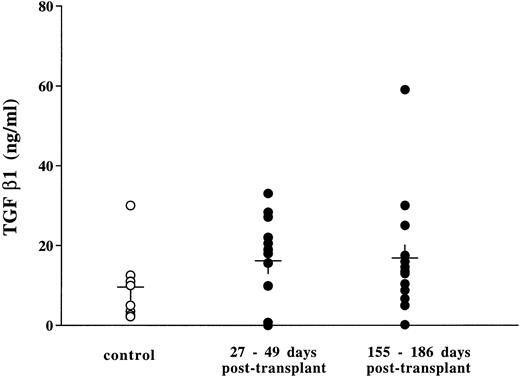
Although progress has been made in the elucidation of the pathogenesis of idiopathic myelofibrosis, the exact mechanism for the progression of myelofibrosis is still unclear. MKs and platelets contain several mediators in their α-granules, which stimulate fibroblasts to proliferate or to produce collagen. These factors include platelet-derived growth factor (PDGF), fibroblast growth factors (FGF), transforming growth factor β-1 (TGF-β-1), epidermal growth factor (EGF), platelet factor-4 (PF-4), and β-thromboglobulin. It has been proposed that fibrosis is related to an abnormal proliferation, maturation, and/or destruction of megakaryoblasts, MKs and/or platelets.52 Other nonmutually exclusive hypotheses could be proposed. Highly proliferating megakaryoblasts might be unable to store these factors in their α-granules, or the intracellular addressing of these proteins to the α-granules might be perturbed, resulting in a leakage within the microenvironment. From our data, we cannot draw any conclusions about the mechanisms underlying the myelofibrosis and osteosclerosis that developed in the bone marrow and spleen from mice permanently exposed to TPO. Histologic sections of the spleen and the bones performed 1 to 2 months posttransplant revealed a massive hyperplasia of MKs, some of which were dysmorphic or apoptotic. During this period, while platelet numbers increased four-fold, giant young platelets (>3%) were commonly observed in the circulation (Fig 6). The presence of these large platelets clearly reflects abnormalities occurring during the process of platelet formation. Transmission electron microscopy showed that both MKs and platelets contained α-granules; however, these granules were unevenly distributed, with some MKs or platelets containing normal numbers while others were clearly depleted of granules. We attempted to demonstrate the presence of increased levels of TGF-β in plasma of thrombocythemic mice 1 and 5 months posttransplant using a sensitive ELISA assay for TGF-β. In contrast to the data reported by Yan et al,39 no significant increase above that observed in plasma from matched MPZenNeo reconstituted mice was seen in our experimental model (Fig 12). TGF-β, PDGF, or FGF are proteins that bind to proteoglycans in the extracellular matrix. It thus remains likely that the MK hyperplasia induced in response to TPO results in a locally increased secretion of growth factors that stimulates the surrounding fibroblasts to proliferate and to produce collagen, resulting in the observed myelofibrosis. We are currently verifying if high doses of TPO modify the intracellular addressing of proteins synthesized by MKs. The present model, which mimics the evolution of human idiopathic myelofibrosis, might be useful to further understanding of the physiologic and molecular mechanisms involved in fibrosis.
TGF β in the plasma from mice transplanted with MPZenNeo (○) and MPZenTPO (•) virus-infected bone marrow cells. Levels were measured using an enzyme linked immunoabsorbent assay (ELISA) kit (Genzyme, Cambridge, MA). Controls were plasma from MPZenNeo reconstituted mice collected 30 days (n = 5) and 155 days (n = 3) posttransplantation.
TGF β in the plasma from mice transplanted with MPZenNeo (○) and MPZenTPO (•) virus-infected bone marrow cells. Levels were measured using an enzyme linked immunoabsorbent assay (ELISA) kit (Genzyme, Cambridge, MA). Controls were plasma from MPZenNeo reconstituted mice collected 30 days (n = 5) and 155 days (n = 3) posttransplantation.
ACKNOWLEDGMENT
We thank V. Vannier, M. Titeux, A.M. Hagnere, P. Ardouin, and A. Rouches for their expert technical assistance. We are most grateful to Drs D. Foster and S. Lok (ZymoGenetics, Seattle, WA) for kindly providing r-mu-TPO and soluble mu-MPL-R. We also thank Dr A. Bank (Columbia University, New York, NY) for providing the GP + E-86 packaging cell line and Dr D. Cosman (Immunex, Seattle, WA) for the Ba/F3 and Ba/F3-muMPL-R cell lines.
Supported by grants from the Institut National de la Santé et de la Recherche Médicale (INSERM), the Institut Gustave Roussy (IGR), the GEFLUC, the Ligue Nationale contre le Cancer, the Fondation contre la Leucémie, the Fondation pour la Recherche Medicale and the Association de Recherche contre le Cancer (ARC). K.C-S. was supported by a fellowship from ZymoGenetics. S.A.B. was a Fogarty Senior International Fellow.
Address reprint requests to Jean-Luc Villeval, PhD, Dana Farber Cancer Institute, Room D936, 44 Binney St, Boston, MA 02115.





This feature is available to Subscribers Only
Sign In or Create an Account Close Modal