Abstract
Administration of hematopoietic growth factors is being used increasingly to obtain populations of blood progenitor/stem cells (PBPC) for clinical transplantation. Here we examined the effect of combining stem cell factor (SCF ) and granulocyte colony-stimulating factor (G-CSF ) versus G-CSF alone in a randomized clinical study involving 62 women with early-stage breast cancer. In the first patient cohorts, escalating doses of SCF were administered for 7 days with concurrent G-CSF administration. At baseline, levels of progenitor cells in the bone marrow or blood were comparable in the different patient groups. As with administration of G-CSF alone, the combination of SCF plus G-CSF did not alter the wide variation in levels of PBPC observed between individuals and did not alter the selective nature of PBPC release, with preferential release of day-14 granulocyte-macrophage colony-stimulating factor (GM-CFC) versus day-7 GM-CFC. However, SCF acted to sustain the levels of PBPC after cessation of growth factor treatment; levels of PBPC were elevated 100-fold at later timepoints compared with G-CSF alone. In addition, the maximum levels of PBPC observed were increased approximately fivefold at day 5 of growth-factor administration. The increased levels of PBPC resulted in significantly increased levels of PBPC obtained by leukapheresis. In a subsequent patient cohort, 3-days pretreatment with SCF was introduced and followed by 7 days concurrent SCF plus G-CSF. The 3-days pretreatment with SCF resulted in an earlier wave of PBPC release in response to commencement of G-CSF. In addition, maximum PBPC levels in blood and PBPC yield in leukapheresis products were further increased. Unexpectedly however, SCF pretreatment resulted in progenitor cells with enhanced self-generation potential. Recloning assays documented the ability of approximately 30% of primary granulocyte-macrophage (GM) colonies from control cell populations to generate secondary GM colonies (n = 1,106 primary colonies examined). In contrast approximately 90% of GM colonies from PBPC after SCF pretreatment generated secondary clones and 65% generated secondary colonies. The action of SCF was not explicable in terms of altered SCF, GM-CSF, or G-CSF responsiveness, but SCF pretreatment was associated with maximum serum SCF levels at the time G-CSF was commenced. These results show that PBPC populations mobilized by different growth factor regimens can differ in their functional properties and caution against solely considering number of harvested progenitor cells without regard to their function.
THE ABILITY OF hematopoietic growth factors to mobilize progenitor cells and stem cells into the blood has substantially impacted on clinical bone marrow transplantation and high-dose chemotherapy procedures.1-7 This action of growth factors is seen in humans, for example with granulocyte colony-stimulating factor (G-CSF ),8-11 granulocyte-macrophage colony-stimulating factor (GM-CSF ),12-14 interleukin-3 (IL-3),15,16 and more recently with the mpl-ligand, megakaryocyte growth and development factor (MGDF ).17,18 Although the mechanism of this effect remains unknown, it is probable that it involves cell adhesion components of the hematopoietic microenvironment such as fibronectin and molecules (ie, VLA-4 and VLA-5).19-22 The widespread clinical application of peripheral blood progenitor/stem cell (PBPC) support after high-dose chemotherapy has been limited by both the frequent requirement for multiple collection procedures and the wide variation in response to growth factors observed with different individuals.
The hematopoietic regulator stem cell factor (SCF, also known as kit-ligand or Steel Factor)23,24 has been shown to enhance colony formation by primitive cell populations and displays synergistic activity on myeloid, erythroid, and megakaryocyte progenitors.25-29 In addition to its action to enhance the survival of stem cell populations in vitro, SCF displays multilineage actions in vivo that include expansion of the stem cell compartment.30-32 The action of SCF to mobilize PBPC has also been examined in preclinical models. For example, administration of SCF to monkeys resulted in an up to 300-fold increase in levels of PBPC.30,32 In mice, dogs, and baboons there is evidence suggesting that the combination of SCF plus G-CSF is synergistic, resulting in an increase in the levels of blood progenitor cells.33-36 However, some of these studies lacked a control group that received G-CSF alone.37
Information on the action of SCF in humans is scant.38 Reports of two early studies have been published in abstract form.39-42 Both studies documented transient and reversible dermatological reactions of the site of injection. One study reported increased levels of progenitor cells per mL of bone marrow, but no changes in blood progenitor cells.43 The action of SCF in combination with G-CSF has also been described in abstract form.44-46
The study described here was performed to examine the action of SCF plus G-CSF on levels of PBPC in humans. Given the activity of SCF in preclinical studies, we reasoned that the combination with G-CSF might serve to increase the levels of blood progenitor cells and to reduce some of the wide variation seen in individual responses to G-CSF alone.
MATERIALS AND METHODS
Clinical details. Patients had early-stage (stage II or III) breast cancer with poor prognostic features, were chemotherapy naive, and all gave informed consent according to a protocol approved by the institutional ethics committees. In the prechemotherapy phase, patients were randomly assigned in the ratio of 2:1 to receive either SCF plus G-CSF or G-CSF alone. The dose of SCF (recombinant methionyl human SCF [r-metHuSCF ]) was escalated in individual patient cohorts (5, 10, or 15 μg/kg/d for 7 days given by single subcutaneous injection), whereas G-CSF was maintained at 12 μg/kg/d and administered as a continuous subcutaneous infusion for 6 days as previously described.5,7 Hereafter the 7 days concurrent administration schedule of SCF plus G-CSF will be referred to as “SCF plus G-CSF.” The number of individuals in each cohort was: G-CSF alone, n = 18 (Cohort A); SCF 5 μg/kg/d plus G-CSF, n = 5 (Cohort B); SCF 10 μg/kg/d plus G-CSF, n = 11 (Cohort C); SCF 15 μg/kg/d plus G-CSF, n = 10 (Cohort D). Subsequently, patients were randomized to receive G-CSF alone versus G-CSF plus 10 days of SCF 10 μg/kg/d of which 3 days of SCF was given before commencement of G-CSF (Cohort E, n = 18). Hereafter this treatment schedule will be referred to as “SCF pretreatment.” For the final 8 patients enrolled in the study, the randomization was between Cohorts C and E and not to Cohort A. For all cohorts, leukapheresis was performed on 3 consecutive days (days 5, 6, 7 relative to commencement of G-CSF ). Patients then went on to receive high-dose chemotherapy with hematopoietic cell support. Patient cohorts were matched in terms of age and stage of disease, although more patients receiving 15 μg/kg/d SCF plus G-CSF had stage III disease (90% versus 50% of G-CSF–alone patients). Specific patient details, safety, and clinical outcomes have been previously reported in abstract form47-49 and will be described in detail elsewhere.
Progenitor cell assays. Bone marrow samples were taken at baseline. Blood samples were taken at baseline, daily during treatment with growth factor and daily after cessation of growth factors.
Blood and bone marrow samples were separated using Ficoll-Paque. Mononuclear cells were washed resuspended and cell counts performed with eosin and crystal violet as previously described.50 Mononuclear cells were examined in triplicate cultures using 104 and 105 viable cells per mL. Cultures were stimulated with G-CSF (500 U/mL), GM-CSF (100 ng/mL), SCF (100 ng/mL), and granulocyte-macrophage (GM) colonies enumerated 14 days later (d14 GM-CFC). For the purpose of this study all colonies grown under these conditions are refered to as d14 GM-CFC and include, for example, Eosinophil-CFC. Cultures stimulated with G-CSF (500 U/mL), and GM-CSF (100 ng/mL) were examined after 7 days (d7 GM-CFC). These culture conditions were deliberately chosen to allow direct comparison of d7 GM-CFC with results from earlier studies.51-54 Cultures stimulated with GM-CSF (100 ng/mL), IL-3 (100 ng/mL), IL-6 (100 ng/mL), SCF (100 ng/mL), and erythropoietin (Epo, 5 U/mL) were examined after 14 days for erythroid colony formation. All cultures were examined by a single observer (GB), blinded to the treatment schedule, using a dissection microscope and with the scoring procedure validated as previously described.50 Results are presented only for those cultures that generated fewer than 250 colonies per plate (typically less than 100 colonies per plate). On some occasions, cell samples were prepared and stored overnight at room temperature; this procedure was shown not to substantially alter colony numbers.50
In some experiments, serial dilutions of growth factors (G-CSF, GM-CSF, or SCF ) in the absence of any other stimulus were used to stimulate colony formation. All experiments were performed in replicate cultures. All cultures were performed in agar as previously described.51 52 Briefly, a mixture of 0.3% agar, Iscove's Modified Dulbecco's Medium (IMDM), and 25% preselected newborn bovine calf serum was prepared. The mononuclear cells were added and 1 mL dispensed into 35-mm petri dishes that contained the mixture of purified, recombinant growth factors (all provided by Amgen, Thousand Oaks, CA). The agar was allowed to gel and cultures placed in a humidified atmosphere of 5% CO2 in air at 37°C.
Recloning experiments. Sequential individual colonies were removed using a Pasteur pipette as previously described.55 A minimum of 50 colonies was examined in each experiment. Day-14 GM colonies were isolated both from cultures stimulated with G-CSF, GM-CSF, SCF, and from cultures stimulated with GM-CSF, IL-3, IL-6, SCF, and Epo. Under the former culture conditions, colonies of all morphologies were isolated; under the latter culture conditions only GM colonies were isolated (colonies with any erythroid characteristics were ignored). Isolated colonies were deposited into 0.2 mL IMDM and a single cell suspension generated by vigorous pipetting. The cell suspension was then recultured in agar cultures stimulated with SCF (100 ng/mL), GM-CSF (100 ng/mL), and G-CSF (500 U/mL). After a further 14 days of incubation, the total number of clones (>3 cells) and the total number of colonies (>40 cells) was enumerated.
Pharmacokinetic assays. SCF levels were determined on serum samples from all patients taken immediately before administration of SCF (trough levels of SCF ). ELISA kits were used according to the manufacturers instructions (R & D Systems, Minneapolis, MN). All data were corrected for endogenous SCF by subtraction of the individual's zero time concentration. All serum concentrations of SCF remained above baseline until at least day 8.
RESULTS
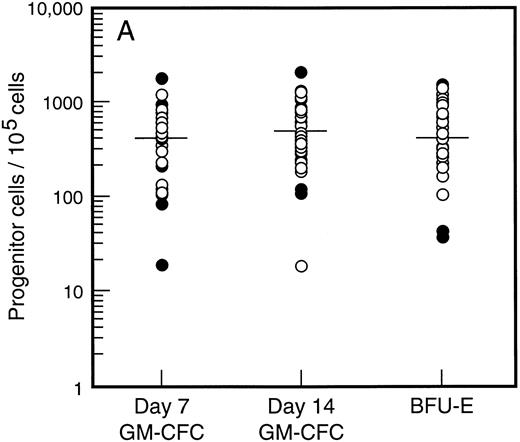
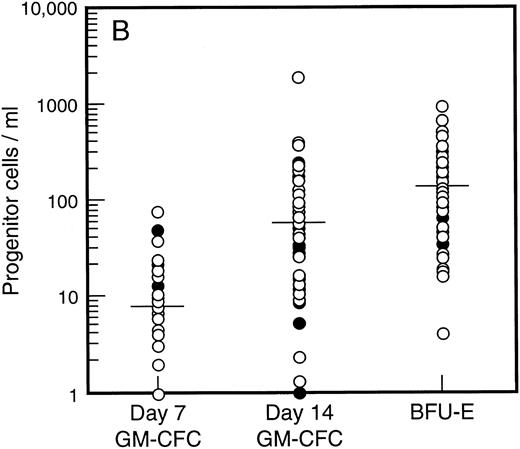
Baseline levels of progenitor cells. All patients had normal baseline hematological parameters and a normal bone marrow biopsy at commencement of the study. Figure 1A shows the baseline values for bone marrow progenitor cells. There was no difference in levels of bone marrow progenitor cells for patients assigned to receive SCF plus G-CSF versus G-CSF alone. The frequency of mature (day 7, d7) and immature (day 14, d14) granulocyte-macrophage colony-forming cells (GM-CFC) and erythroid progenitor cells (BFU-E) is shown for all patients. There was a 100-fold variation in the frequency of progenitor cells for these individuals with normal bone marrow function. However, the frequency of d7 GM-CFC in the bone marrow was comparable to the frequency of d14 GM-CFC and BFU-E. The baseline level of PBPC was also similar for patients assigned to treatment with or without SCF (Fig 1B). Again there was an approximately 100-fold variation between these individuals. However, in contrast to the results for the bone marrow, the number of mature d7 GM-CFC in blood was approximately 10-fold less than the number of d14 GM-CFC or BFU-E.
Baseline values for number of progenitor cells in (A) bone marrow (results expressed per 105 mononuclear cells) and (B) blood (results expressed per mL blood). Results are mean of triplicate cultures for 62 individuals. Patients were randomized to receive G-CSF alone (•, n = 18) or G-CSF plus SCF (○, n = 44). Median results are indicated by horizontal line.
Baseline values for number of progenitor cells in (A) bone marrow (results expressed per 105 mononuclear cells) and (B) blood (results expressed per mL blood). Results are mean of triplicate cultures for 62 individuals. Patients were randomized to receive G-CSF alone (•, n = 18) or G-CSF plus SCF (○, n = 44). Median results are indicated by horizontal line.
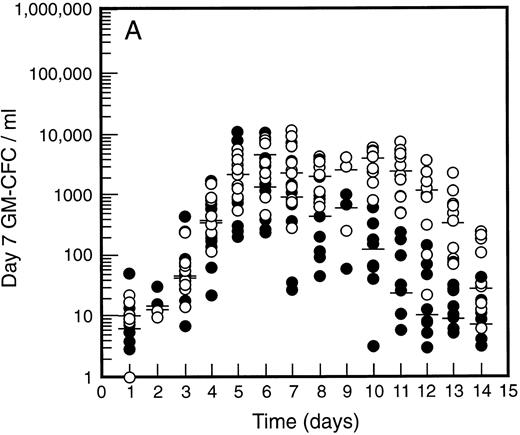
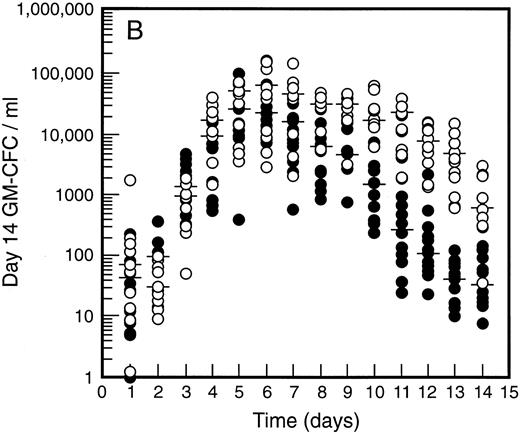
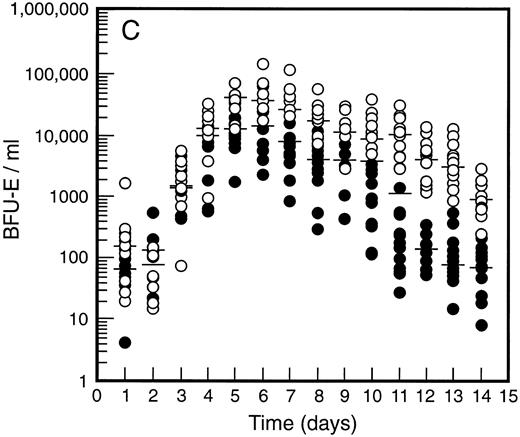
SCF causes sustained elevation in blood progenitor cell levels. Levels of blood progenitor cells were quantitated during and after the administration of growth factors. The wide interindividual variation noted at baseline was also evident following treatment with G-CSF (Fig 2, closed circles). The changes in PBPC occurred in parallel for each cell type with maximum levels at days 5 and 6 of G-CSF treatment. There was an approximately 200-fold increase in d7 GM-CFC, d14 GM-CFC, and BFU-E (median d14 GM-CFC levels at baseline, 100 per mL; median levels at day 6, 20,575 per mL). The level of d7 GM-CFC was consistently lower than d14 GM-CFC or BFU-E despite comparable levels at baseline in the bone marrow (Fig 1A). This difference was approximately 50-fold at the times of peak progenitor cell levels. The level of PBPC following G-CSF treatment had returned to baseline values by day 12 for d7 GM-CFC and day 14 for BFU-E and d14 GM-CFC.
Levels of blood progenitor cells for patients treated with G-CSF alone (•, n = 18) or G-CSF plus SCF 10 μg/kd/d (n = 11) for 7 days (○), showing d7 GM-CFC (A), d14 GM-CFC (B), and BFU-E (C). Results are means of triplicate cultures. Median results are indicated for each cohort by horizontal line. Baseline values (day 1) were taken before administration of growth factors. Note the elevated levels of progenitor cells in the G-CSF plus SCF cohort despite similar levels at baseline.
Levels of blood progenitor cells for patients treated with G-CSF alone (•, n = 18) or G-CSF plus SCF 10 μg/kd/d (n = 11) for 7 days (○), showing d7 GM-CFC (A), d14 GM-CFC (B), and BFU-E (C). Results are means of triplicate cultures. Median results are indicated for each cohort by horizontal line. Baseline values (day 1) were taken before administration of growth factors. Note the elevated levels of progenitor cells in the G-CSF plus SCF cohort despite similar levels at baseline.
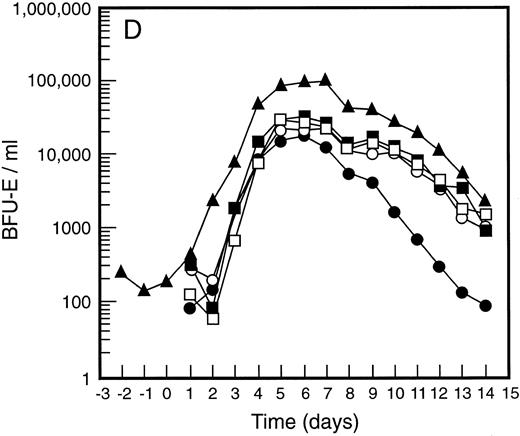
Figure 2 also shows the results for all patients who received SCF 10 μg/kg/d plus G-CSF (n = 11). Similar results were seen with all SCF plus G-CSF cohorts (see below), including the dissociation between d14 GM-CFC and d7 GM-CFC. At day 5 there was an approximately 200-fold increase in levels of d7 GM-CFC and 400-fold increase in d14 GM-CFC and BFU-E. Furthermore, the addition of SCF did not alter the 100-fold variation in PBPC levels observed with different individuals. However, unlike levels of PBPC with G-CSF alone, the number of PBPC remained elevated following cessation of growth factors. Thus, at days 10 through 14, the number of PBPC was elevated 10- to 100-fold (Fig 2) compared with levels of PBPC observed with G-CSF. A similar sustained elevation of PBPC was observed with all doses of SCF plus G-CSF (Fig 3), and PBPC levels did not return to baseline levels until after day 14. This difference was highly significant (P < .001 for G-CSF alone v all SCF cohorts at day 14, Wilcoxon Rank-Sum test). The sustained elevation of PBPC levels at later time points clearly established a biological effect of SCF above the action of G-CSF alone.
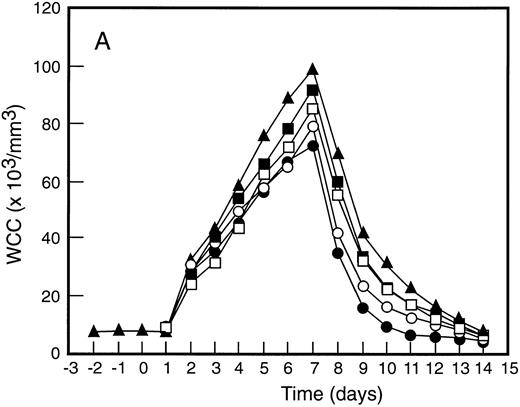
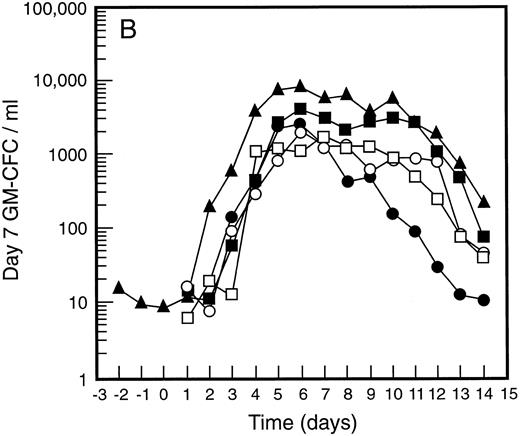
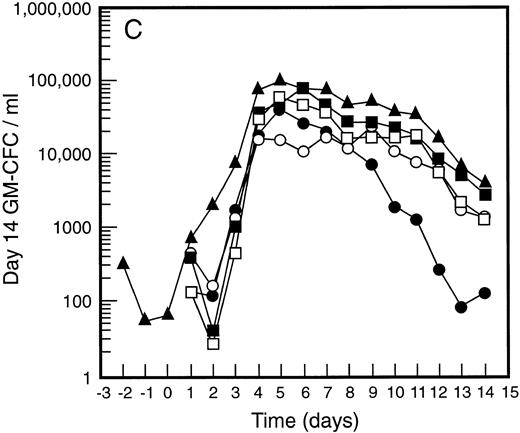
Mean levels of blood white cell counts and progenitor cells for patient cohorts treated with G-CSF alone (•, n = 18), SCF 5 μg/kg/d plus G-CSF (○, n = 5), SCF 10 μg/kg/d plus G-CSF (▪, n = 11), or SCF 15 μg/kg/d plus G-CSF (□, n = 10). Results are also shown for the patient cohort that received SCF pretreatment for 3 days and 7 days concurrent treatment with G-CSF (▴, n = 18). Time is shown relative to the commencement of G-CSF. Results shown are white cell count (A), d7 GM-CFC (B), d14 GM-CFC (C), and BFU-E (D).
Mean levels of blood white cell counts and progenitor cells for patient cohorts treated with G-CSF alone (•, n = 18), SCF 5 μg/kg/d plus G-CSF (○, n = 5), SCF 10 μg/kg/d plus G-CSF (▪, n = 11), or SCF 15 μg/kg/d plus G-CSF (□, n = 10). Results are also shown for the patient cohort that received SCF pretreatment for 3 days and 7 days concurrent treatment with G-CSF (▴, n = 18). Time is shown relative to the commencement of G-CSF. Results shown are white cell count (A), d7 GM-CFC (B), d14 GM-CFC (C), and BFU-E (D).
The mean results for GM-CFC and BFU-E are compared with changes in the white cell count in Fig 3. An increase in white cell count was clearly evident for all cohorts within 24 hours of commencing G-CSF and reached a maximum approximately 10-fold above baseline. The peak white cell count was approximately 1.5-fold greater with SCF 10 μg/kg/d plus G-CSF compared with G-CSF alone and with the suggestion of an SCF dose response. In all patient cohorts the white cell count fell quickly following cessation of growth factors and had returned to normal by day 14. The kinetics of PBPC mobilization were quite different. The earliest detectable increase was evident at day 3 and the kinetics of PBPC release were remarkably consistent for each progenitor cell type and all patient cohorts. However, with all SCF plus G-CSF cohorts, the discordance between the white cell count and levels of PBPC at later timepoints was notable: the frequency of PBPC amongst nucleated cells at day 12 was increased 10-fold compared with PBPC levels at day 5.
The maximum levels of PBPC observed were greater in the SCF 10 μg/kg/d plus G-CSF and SCF 15 μg/kg/d plus G-CSF cohorts when compared with G-CSF alone. With concurrent 7-day administration of SCF 10 μg/kg/d plus G-CSF, there was an approximately fivefold increase in the maximum levels of d7 GM-CFC, d14 GM-CFC, and BFU-E at days 5 and 6 (P < .001 for d14 GM-CFC at day 5 v levels with G-CSF alone, Wilcoxon Rank-Sum test). Results were similar with SCF 15 μg/kg/d plus G-CSF. Based on these results, the addition of SCF to G-CSF acted to increase the maximum number of PBPC approximately fivefold and sustained the level of these cells in the blood, despite falling white cell counts.
Pretreatment with SCF further enhanced progenitor cell mobilization. SCF acted to generate a sustained elevation of PBPC when combined with G-CSF. We therefore reasoned that manipulation of the administration schedule might allow the peak levels of PBPC seen with G-CSF alone (day 5 to 6) to become coincident with the later mobilization of PBPC seen with SCF plus G-CSF cohorts. A 3-day pretreatment schedule with SCF 10 μg/kg/d was therefore introduced. These patients then continued to receive SCF 10 μg/kg/d plus G-CSF for a further 7 days (SCF pretreatment cohort).
This SCF-pretreatment schedule resulted in an earlier wave of PBPC release following commencement of G-CSF. The rise in blood PBPC was evident at least 1 day earlier for patients who received SCF pretreatment (Fig 3). Thus, the earliest detectable increase in PBPC was at day 2 relative to the commencement of G-CSF. This suggested that SCF pretreatment served to expand a population of cells available for G-CSF–induced mobilization. In addition, the peak level of PBPC was significantly greater than with G-CSF alone and superior to all other SCF plus G-CSF cohorts. The action of SCF to maintain sustained levels of PBPC was also evident with this cohort of patients; at day 12 the level of progenitor cells of each type was approximately fivefold greater than for the equivalent patient group treated concurrently with SCF 10 μg/kg/d plus G-CSF.
Enhanced yields of progenitor cells with SCF plus G-CSF. In all patients leukapheresis was performed on days 5, 6, and 7 as defined relative to the administration of G-CSF. In general, the level of progenitor cells in the blood correlated well with the number of progenitor cells collected (for d7 GM-CFC r = .78, P < .0001; for d14 GM-CFC r = .63, P < .0001; for BFU-E r = .59, P < .0001).
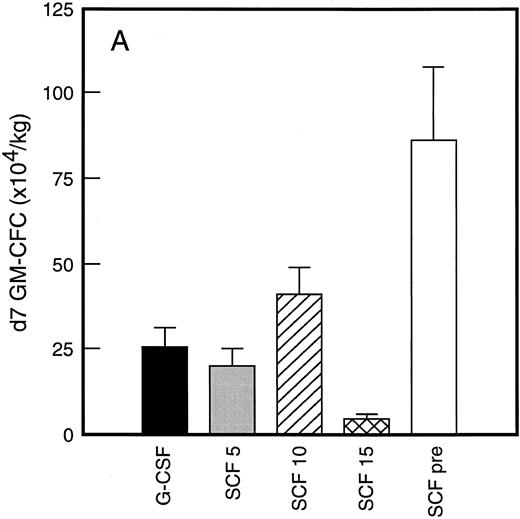
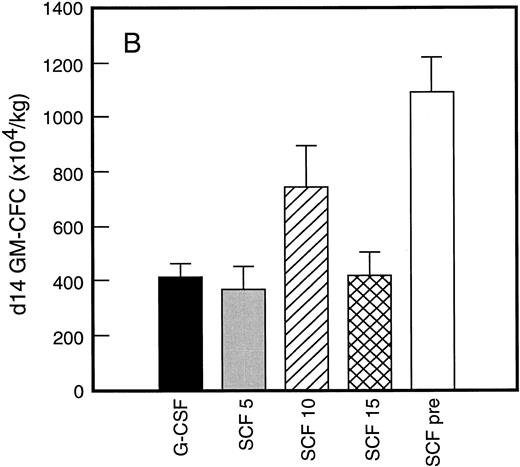
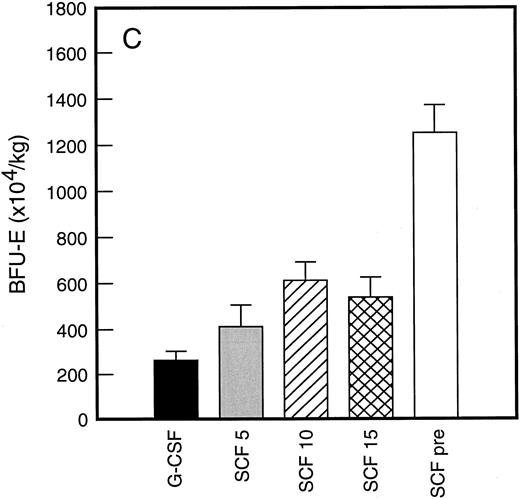
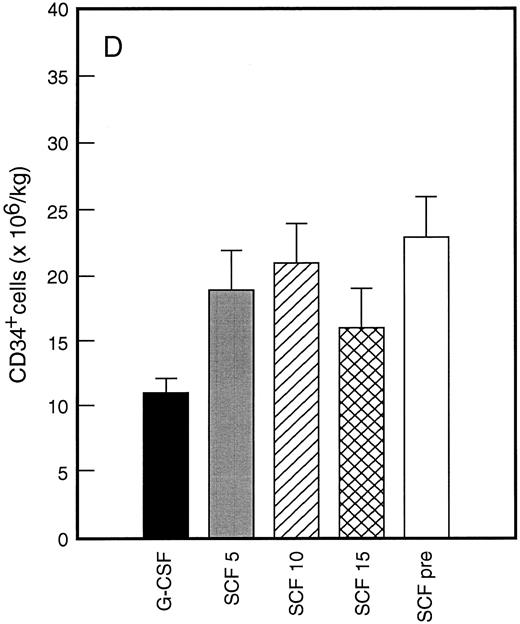
Results of analysis of leukapheresis collections according to patient cohort are shown for all patients in Fig 4. There was no difference in the number of d7 GM-CFC, d14 GM-CFC, BFU-E, or CD34+ cells collected from patients who received G-CSF alone versus SCF 5 μg/kg/d plus G-CSF. However there was a significant increase in the number of d7 GM-CFC, d14 GM-CFC, BFU-E, and CD34+ cells when G-CSF alone was compared with concurrent SCF 10 μg/kg/d plus G-CSF (eg, P < .013 for CD34+ cells; P < .07 for d14 GM-CFC, Wilcoxon Rank-Sum test). There was a further, approximately twofold, increase in number of progenitor cells of all types obtained from patients who received SCF pretreatment when compared with SCF 10 μg/kg/d plus G-CSF. This was significantly different when compared with patients who received G-CSF alone (P < .0001 for d14 GM-CFC; P < .0005 for CD34+ cells, Wilcoxon Rank-Sum test). In addition, SCF pretreatment was superior to concurrent administration of SCF 10 μg/kg/d plus G-CSF in terms of progenitor cells collected (P < .03 for d14 GM-CFC; P = .70 for CD34+ cells, Wilcoxon Rank-Sum test).
Leukapheresis collections from days 5 plus 6 plus 7 (relative to G-CSF administration) for each patient cohort: G-CSF alone (G-CSF, ▪); SCF 5 μg/kg/d plus G-CSF (SCF 5, ); SCF 10 μg/kg/d plus G-CSF (SCF 10, ▨); SCF 15 μg/kg/d plus G-CSF (SCF 15, ); and SCF pretreatment (SCF pre, □). Results are mean ± SE for d7 GM-CFC (A), d14 GM-CFC (B), BFU-E (C), and CD34+ cells (D). The apparent decrease in GM-CFC collected in Cohort D was interpreted as reflecting the smaller number of patients in this cohort, the wide interindividual variation, and the increased number of patients with stage III disease in this group.
Leukapheresis collections from days 5 plus 6 plus 7 (relative to G-CSF administration) for each patient cohort: G-CSF alone (G-CSF, ▪); SCF 5 μg/kg/d plus G-CSF (SCF 5, ); SCF 10 μg/kg/d plus G-CSF (SCF 10, ▨); SCF 15 μg/kg/d plus G-CSF (SCF 15, ); and SCF pretreatment (SCF pre, □). Results are mean ± SE for d7 GM-CFC (A), d14 GM-CFC (B), BFU-E (C), and CD34+ cells (D). The apparent decrease in GM-CFC collected in Cohort D was interpreted as reflecting the smaller number of patients in this cohort, the wide interindividual variation, and the increased number of patients with stage III disease in this group.
Enhanced clonogenic capacity of cells mobilized by SCF pretreatment. Given both the action of SCF on stem cells and the increased numbers of PBPC generated in response to SCF, experiments were performed to document the self-renewal/self-generation characteristics of these cells. Colonies derived from PBPC were isolated, suspended, and recultured to assess recloning potential as a measure of self-generation. The number of secondary clones and secondary colonies derived from each primary colony was documented. Table 1 shows the number of primary GM colonies that contained cells capable of giving rise to secondary clones. An unexpectedly high percentage of GM colonies derived from bone marrow cells generated secondary clones. This was between 49% and 73% (mean 59%) with different bone marrow samples. Moreover, approximately 30% of primary GM colonies gave rise to secondary colonies (range 22% to 47%). Similar results were observed with GM colonies derived from blood: after 5 days of treatment with G-CSF or treatment with SCF 10 μg/kg/d plus G-CSF, approximately 30% of primary GM colonies generated secondary colonies. Although there was some variation between experiments, the results were not significantly different for bone marrow cells versus blood cells from patients who received G-CSF alone or SCF plus G-CSF. The recloning potential was independent of the growth stimulus in the primary culture (G-CSF, GM-CSF, and SCF v GM-CSF, SCF, IL-3, IL-6, and Epo; data not shown). Thus, based on an analysis of over 380 primary GM colonies from G-CSF alone and SCF plus G-CSF mobilized PBPC, the percentage of primary colonies that generated secondary colonies was 29% for both groups. Similar results were obtained when blood PBPC were taken 12 days after commencing growth factor (number secondary clones 36%, secondary colonies 16% for G-CSF alone [n = 385 primary colonies examined]; number secondary clones 35%, secondary colonies 19% for SCF 10 μg/kg/d plus G-CSF [n = 281 primary colonies analyzed]).
Clonogenicity of Primary GM Colonies
| Cell Source . | Percent Primary Colonies Containing . | No. Clones Generated per Primary Colony. . | ||
|---|---|---|---|---|
| . | Clonogenic Cells . | Median (range) . | ||
| . | Secondary Clones . | Secondary Colonies . | Secondary Clones . | Secondary Colonies . |
| BM, baseline | 49 | 27 | 17 (2-≥300) | 4 (1-89) |
| (n = 338 primary colonies) | 56 | 28 | 30 (2-≥300) | 5 (1-76) |
| 58 | 22 | 3 (2-210) | 2 (1-45) | |
| 73 | 47 | 5 (2-86) | 3 (1-37) | |
| Mean | 59 | 31 | ||
| G-CSF, d5 | 41 | 19 | 8 (2-83) | 2 (1-27) |
| (n = 383 primary colonies) | 48 | 31 | 4 (2-49) | 3 (1-32) |
| 63 | 34 | 24 (2-≥300) | 4 (1-49) | |
| 68 | 31 | 37 (2-169) | 3 (1-23) | |
| Mean | 55 | 29 | ||
| SCF + G-CSF, d5 | 34 | 14 | 5 (2-96) | 2 (1-11) |
| (n = 465 primary colonies) | 38 | 28 | 9 (2-68) | 2 (1-18) |
| 72 | 58 | 53 (2-≥300) | 9 (1-143) | |
| 75 | 33 | 15 (2-165) | 3 (1-130) | |
| Mean | 55 | 33 | ||
| SCF pretreatment, d5 | 87 | 44 | 63 (2-≥300) | 5 (1-103) |
| (n = 336 primary colonies) | 87 | 69 | 26 (2-≥300) | 5 (1-179) |
| 94 | 69 | 85 (2-≥300) | 4 (1-130) | |
| 94 | 86 | 105 (2-≥300) | 23 (1-223) | |
| Mean | 91 | 67 | ||
GM colonies were grown for 14 days in primary agar cultures, single colonies isolated and recultured for a further 14 days. The number of secondary clones (and colonies) was enumerated and is shown as a percentage. The cell source was bone marrow (BM) taken at baseline or blood taken at day 5 relative to G-CSF administration. Blood was taken after patients received either G-CSF alone, SCF 10 μg/kg/d plus G-CSF for 5 days, or SCF pretreatment. To determine the number of clonogenic cells a mean of 89 colonies was recloned on each occasion (with a mean of 57 colonies generating secondary clones). The number of clones (and colonies) generated per primary colony is also shown. Results were obtained from 4 different patients for each cohort.
The recloning potential of primary GM colonies from patients who received SCF pretreatment was quite different (Table 1). Approximately 90% of primary GM colonies gave rise to secondary clones. This was significantly different to the behavior of primary GM colonies from the other sources (eg, P < .002 for SCF pretreatment v G-CSF alone, unpaired t-test). In addition 65% of primary GM colonies generated secondary colonies (eg, P < .006 for SCF pretreatment v G-CSF alone, unpaired t-test). Moreover, the number of secondary clones generated per primary colony was also significantly increased (Table 1) with numerous primary GM colonies generating over 300 secondary clones (eg, P < .03 for SCF pretreatment v G-CSF alone, unpaired t-test). The number of secondary colonies generated per primary GM colony was also increased, with a maximum of 223 secondary colonies from one primary colony (v a maximum of, eg, 49 colonies from G-CSF PBPC). These secondary colonies were also larger in size (average 1,000 cells per colony, n = 70 colonies).
The high recloning potential of bone marrow and blood GM progenitor cells was unexpected and suggests that these cells have higher self-generation capacity than previously suspected. It seemed most likely that this unexpected result reflected the presence of SCF in the culture dish. In one experiment using bone marrow–derived GM colonies, this idea was supported (with G-CSF and GM-CSF in primary cultures, 11 of 49 colonies gave secondary clones and 5 of 49 gave secondary colonies v G-CSF, GM-CSF, and SCF in primary cultures, in which 30 of 48 gave secondary clones and 18 of 48 gave secondary colonies).
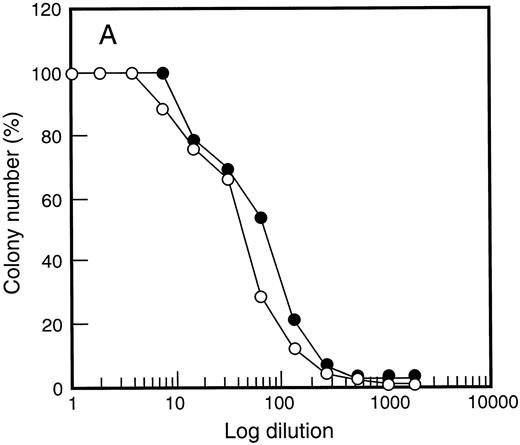
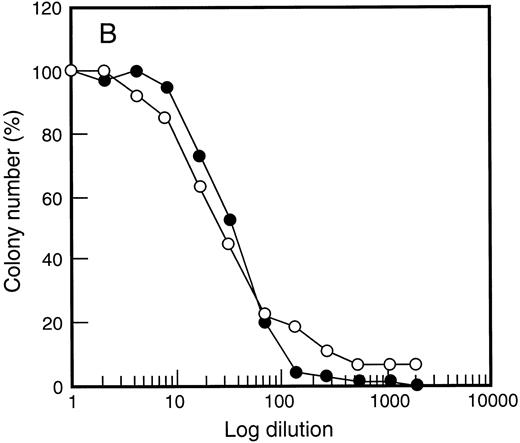
One possible explanation for the enhanced PBPC response with SCF was altered G-CSF responsiveness following SCF administration. The in vitro dose response of PBPC was therefore examined (Fig 5). Response to G-CSF was unchanged when compared with responsiveness of bone marrow cells before growth factor treatment. This was also true for responsiveness to GM-CSF (data not shown) and SCF (Fig 5) regardless of the growth factor combination used to elicit PBPC. Thus, although heightened G-CSF responsiveness has been documented for some subsets of bone marrow progenitor cells,52 this was not observed for populations of growth factor–mobilized PBPC.
Growth factor responsiveness was unchanged following SCF administration. Results are shown for G-CSF (•) and SCF (○) titration curves examining d14 GM-CFC in (A) bone marrow at baseline and (B) after 5 days of growth factor treatment (SCF 10 μg/kg/d plus G-CSF ). Similar results were obtained for 4 individuals and for cells analyzed at day 12 of study (data not shown).
Growth factor responsiveness was unchanged following SCF administration. Results are shown for G-CSF (•) and SCF (○) titration curves examining d14 GM-CFC in (A) bone marrow at baseline and (B) after 5 days of growth factor treatment (SCF 10 μg/kg/d plus G-CSF ). Similar results were obtained for 4 individuals and for cells analyzed at day 12 of study (data not shown).
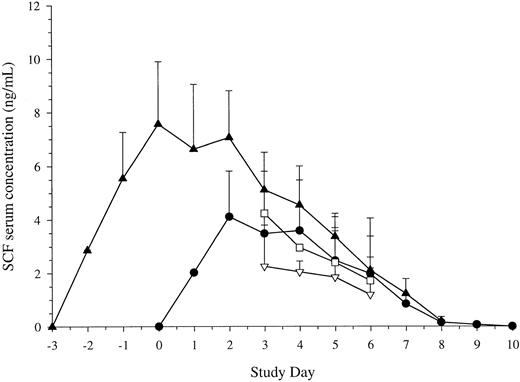
Serum SCF levels. Given the action of SCF pretreatment, studies were also performed to examine the levels of SCF following different schedules of administration. Results are shown in Fig 6. The serum levels of SCF attained were similar with 7 doses of SCF at either 10 μg/kg/d or 15 μg/kg/d. Maximum levels were achieved after 3 doses and did not continue to rise thereafter. As with other growth factors, the levels then began to fall as the white cell count began to rise. Levels returned to baseline 2 days after cessation of administration (day 9 of study).
Serum levels of SCF. Blood was taken before administration of each dose of SCF. Results are mean ± SE for SCF 5 μg/kg/d plus G-CSF (Cohort B, n = 5, ▿), SCF 10 μg/kg/d plus G-CSF (Cohort C, n = 11, •), SCF 15 μg/kg/d plus G-CSF (Cohort D, n = 10, □), and SCF pretreatment (Cohort E, 10 μg/kg, n = 18, ▴). Time is shown relative to administration of G-CSF. Serum concentration is corrected for baseline values.
Serum levels of SCF. Blood was taken before administration of each dose of SCF. Results are mean ± SE for SCF 5 μg/kg/d plus G-CSF (Cohort B, n = 5, ▿), SCF 10 μg/kg/d plus G-CSF (Cohort C, n = 11, •), SCF 15 μg/kg/d plus G-CSF (Cohort D, n = 10, □), and SCF pretreatment (Cohort E, 10 μg/kg, n = 18, ▴). Time is shown relative to administration of G-CSF. Serum concentration is corrected for baseline values.
With SCF pretreatment, maximum serum levels were achieved after 3 doses and before administration of G-CSF was commenced (day 0 of study). Following commencement of G-CSF, levels fell as the white cell count began to rise. SCF levels returned to their baseline value 2 days after cessation of growth factor. Thus, SCF pretreatment for 3 days effectively attained maximal levels of SCF before administration of G-CSF.
DISCUSSION
In this report we have shown that coadministration of SCF plus G-CSF resulted in a significant increase in blood levels of d7 GM-CFC, d14 GM-CFC, and BFU-E. The action of SCF was most evident at later time points in which levels of PBPC remained elevated after 12 days. In contrast, by this time the levels of PBPC had returned to baseline for patients who received G-CSF alone. SCF in combination with G-CSF also acted to increase the maximum levels of PBPC. This effect was even more evident when individuals were pretreated with SCF for 3 days; the maximum levels of PBPC were greater and the rising levels were detected earlier. The heightened levels of PBPC observed with SCF plus G-CSF were associated with increased levels of progenitor cells, including CD34+ cells, collected by leukapheresis; the significant advantage of concurrent SCF 10 μg/kg/d plus G-CSF over G-CSF alone was even more evident when 3 days of pretreatment with SCF was performed. Unexpectedly, SCF pretreatment generated GM-CFC that displayed enhanced self-renewal potential. There was no difference in the in vitro growth factor responsiveness to G-CSF, GM-CSF, or SCF of progenitor cells following administration of SCF. However, following SCF pretreatment, elevated SCF levels were maximal before G-CSF administration.
This study clearly documented the benefit of combination treatment compared with G-CSF treatment alone. Despite the evidence suggesting SCF alone can increase levels of PBPC in animal models,32-36 this action is modest or undetectable in humans.41-43 In contrast the action of G-CSF to enhance levels of PBPC is well documented.5,8-11 The combination of both factors increased blood levels of d7 GM-CFC, d14 GM-CFC, and BFU-E and resulted in increased leukapheresis yields. This advantage of SCF plus G-CSF over G-CSF alone was highly statistically significant. This increase in PBPC was evident despite the broad interindividual variation that we have consistently observed.5,9,56,57 Although this wide interindividual variation may be further enhanced as a consequence of prior chemotherapy,38,58 this was not a confounding influence in this study; the greater than 100-fold variation reported here was seen in individuals who all had normal bone marrow function and all had no prior treatment. This highlights the problem of attempting to interpret results from nonrandomized studies examining only small numbers of individuals in a given treatment cohort. This, combined with a modest difference between treatment groups, makes it difficult to evaluate the studies of combinations of growth factors reported to date.59-63
The mechanism of PBPC mobilization remains unclear. However, it is interesting to note that this phenomenon displays selectivity. Despite comparable numbers of d7 GM-CFC and d14 GM-CFC in the bone marrow, there was consistently a 10- to 50-fold difference in the levels of these cells in the blood. This selectively remains a consistent finding8,9,18 and has also been observed in the mouse.64 This suggests that the mobilization seen with G-CSF cannot simply represent nonselective release. Moreover, it is likely that different mechanisms of mobilization will apply to different growth factors. The kinetics of PBPC release seen here as a result of administration of SCF plus G-CSF differed greatly from those seen with G-CSF alone. Similarly, MGDF stimulates release of PBPC, but with kinetics surprisingly different to G-CSF.18 However, like SCF, MGDF also appears to have an enhanced action when combined with G-CSF.17
An intriguing observation was the earlier mobilization seen as a result of SCF pretreatment. This suggested that the pool of G-CSF–responsive cells was expanded. In addition, SCF pretreatment increased the peak level of PBPC and the yield of PBPC obtained by leukapheresis. Given the similarities between SCF and flk-2/flt-3 ligand,52 65-67 it is possible that the combination of flk-2/flt-3 ligand plus G-CSF might act in an analogous manner, and that pretreatment might also be advantageous.
Somewhat surprisingly, there was no obvious difference in the in vitro behavior of blood progenitor cells generated in response to concurrent coadministration of both factors (the SCF plus G-CSF cohorts).38 With both factors given together for 7 days there were no differences in in vitro growth factor responsiveness, self-generation characteristics, colony size, or colony morphology. However, an increase in long-term culture–initiating cells has been noted in the apheresis products from patients who received SCF plus G-CSF following cyclophosphamide.38 Similarly, although mouse models suggested that the combination of SCF plus G-CSF might produce a population of human cells ideally suited for gene transfer,37 this was not the case in this study.68 There was no evidence that cells generated by the growth factor combination were more susceptible to gene transfer. However, the increased levels of PBPC did ensure an increased number of target cells.68
The demonstration that approximately 50% of unselected, day-14 GM colonies from bone marrow– or peripheral blood–contained cells were capable of generating secondary clones was unexpected. This estimate was based on an extensive analysis of GM colonies from control cell samples (n = 1,106 colonies examined). Earlier studies have documented the inability of such colonies to give rise to secondary colonies, thus the depiction of progenitor cells without a “self-renewing” arrow on diagrams of the hematopoietic hierarchy.69 Although the generation of secondary clones of less than 40 cells in size probably reflects the presence of promyelocytes and myelocytes within the colony,51 approximately 30% of primary GM colonies generated secondary colonies. This unexpected recloning potential was probably caused by SCF in the culture dish. SCF might allow cells that would otherwise not express their proliferative potential to read-out in a colony assay. In addition, despite its action to increase colony size, SCF may preserve the self-generation capacity of progenitor cells that still retain some more primitive, “stem-cell” characteristics. The SCF pretreatment generated GM-CFC with apparently greater self-generation potential; approximately 90% of primary GM colonies generated secondary clones and 65% generated secondary colonies. This observation was consistent both with the known action of SCF within the stem-cell compartment and with the elevated SCF serum levels observed before G-CSF administration. This property of GM-CFC generated with SCF pretreatment might suggest that these cells could prove superior in clinical transplantation settings.38 Moreover, it cautions against assuming that firstly, all GM-CFC or CD34+ cell populations generated by in vivo administration of growth factors are equivalent in their functional properties and secondly, that GM-CFC assays and CD34 assays are interchangeable. Furthermore, these results imply that PBPC mobilized by different growth factor treatments cannot necessarily be equated in terms of their clinical utility.
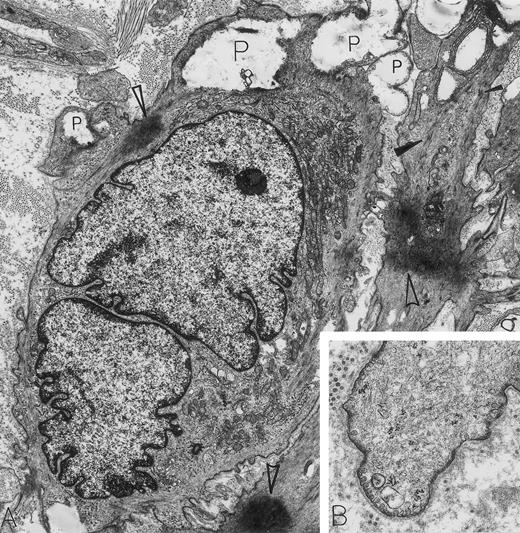
Leiomyosarcoma. A 56-year-old woman presented with abdominal pain and a 30-lb weight loss; a retroperitoneal mass was found. By electron microscopy, all features diagnostic for a metastatic leiomyosarcoma were present. These include caveolae, basal lamina, attachment plaques (all best seen at higher magnification in B), and bundles of microfilaments with dense bodies enclosed (closed arrowheads in A). Additional features of these spindle-shaped tumor cells of smooth muscle cell origin include large electron-dense masses of contracted actin filaments (open arrowheads in A), blunt, club-shaped surface projections (seen at higher magnification in B) and electron-lucent cytoplasmic pools representing admixed glycogen and lipid (P). Note that strands of rough endoplasmic reticulum are not dilated and are inconspicuous in these leiomyosarcoma cells displaying primarily a contractile phenotype. The light microscopic immunoperoxidase profile was positive for vimentin, muscle-specific actin and desmin, and negative for S-100, neurofilament, keratin, and α-1-antitrypsin for this tumor. (A) Original magnification × 8,000; (B) Original magnification × 24,000. (Courtesy of Ann M. Dvorak, MD, Department of Pathology, Beth Israel Deaconess Medical Center, 330 Brookline Ave, Boston, MA 02215.)
Leiomyosarcoma. A 56-year-old woman presented with abdominal pain and a 30-lb weight loss; a retroperitoneal mass was found. By electron microscopy, all features diagnostic for a metastatic leiomyosarcoma were present. These include caveolae, basal lamina, attachment plaques (all best seen at higher magnification in B), and bundles of microfilaments with dense bodies enclosed (closed arrowheads in A). Additional features of these spindle-shaped tumor cells of smooth muscle cell origin include large electron-dense masses of contracted actin filaments (open arrowheads in A), blunt, club-shaped surface projections (seen at higher magnification in B) and electron-lucent cytoplasmic pools representing admixed glycogen and lipid (P). Note that strands of rough endoplasmic reticulum are not dilated and are inconspicuous in these leiomyosarcoma cells displaying primarily a contractile phenotype. The light microscopic immunoperoxidase profile was positive for vimentin, muscle-specific actin and desmin, and negative for S-100, neurofilament, keratin, and α-1-antitrypsin for this tumor. (A) Original magnification × 8,000; (B) Original magnification × 24,000. (Courtesy of Ann M. Dvorak, MD, Department of Pathology, Beth Israel Deaconess Medical Center, 330 Brookline Ave, Boston, MA 02215.)
ACKNOWLEDGMENT
We thank the many staff involved in these studies: Geraint Duggan, Daryl Maher, Chris Juttner, Kerrie Clarke, Dora McPhee, Josephine Iaria, Rosemary Rogers, Don Metcalf, Jan Boyd, Liz O'Flaherty, Elizabetta DeLuca, Ian Russell, John Collins, Jeff Szer, Andrew Grigg, Jenny Marty, and Dora Menchaca.
Supported in part by grants from the National Health and Medical Research Council, Canberra, Australia; The Anti-Cancer Council of Victoria, Australia; the Cooperative Research Centre for Cellular Growth Factors; and Amgen, Thousand Oaks, CA.
Address reprint requests to C.G. Begley, MB, BS, PhD, The Walter and Eliza Hall Institute of Medical Research, PO Royal Melbourne Hospital, Victoria, Australia 3050.

This feature is available to Subscribers Only
Sign In or Create an Account Close Modal