Abstract
Karyotypic information on multiple myeloma (MM) is less extensive than that on other myeloid or lymphoid malignancies due to low mitotic activity of plasma cells. An add(14)(q32) marker chromosome has been reported to be the most frequent recurring abnormality in clonally abnormal cases; in approximately one third of the latter cases, this marker has been identified as a der(14)t(11;14)(q13;q32) chromosome. To map chromosomal breakpoints, characterize the add(14)(q32) marker chromosomes, and to identify other recurring translocations in MM, we used spectral karyotyping (SKY) to analyze a panel of nine bone marrow (BM) biopsy samples from eight patients and 10 tumor cell lines derived from MM patients. SKY involves hybridization of 24 fluorescently labeled chromosome painting probes to metaphase spreads in such a manner that simultaneous visualization of each of the chromosomes in a different color is accomplished. By this method, it was possible to define all chromosomal rearrangements and identify all of the clonal marker chromosomes in tumor cells. By detailed mapping of breakpoints of rearrangement, it was also possible to identify several novel recurring sites of breakage that map to the chromosomal bands 3q27, 17q24-25, and 20q11. The partner chromosomes in translocations that generated the add (14)(q32) marker chromosomes were identified in all cases in which they were detected by G-banding (one biopsy and six cell lines). In addition, two new translocations involving band 14q32, ie, t(12;14)(q24;q32) and t(14;20)(q32;q11) have also been identified. These studies demonstrate the power of SKY in resolving the full spectrum of chromosome abnormalities in tumors.
© 1998 by The American Society of Hematology.
MULTIPLE MYELOMA (MM) is characterized by monoclonal proliferation of plasma cells and accounts for approximately 10% of all hematologic malignancies. Cytogenetic information on MM is limited because of the low mitotic activity of the plasma cells. The most commonly reported clonal chromosome abnormalities comprise rearrangements affecting 1q and the band 14q32, and partial or total loss of chromosome 13.1-8 Of these, translocations affecting band 14q32 have been noted in 10% to 60% of MM cases, frequently described as add(14)(q32) marker chromosomes. Besides the t(11;14)(q13;q32) translocation, which has been noted in approximately 30% of cases, the partner chromosome in translocations that generate the add(14)(q32) marker chromosomes have rarely been identified until recently. Using Southern blotting approaches to identify illegitimateIGH switch recombination events, sequences linked to theIGH gene in 14q32-associated translocations have recently been shown to be derived from 4p16.3, 6p25, 8q24, 11q13, 16q23.1, and 21q22.1.9 10 Notably, the telomeric translocation breaks in 4p16.3 and 6p25 are not detectable by G-banding.
Recently, novel molecular cytogenetic techniques termed multicolor spectral karyotyping (SKY) and multicolor fluorescence in situ hybridization (m-FISH) have been described, which enable precise identification of complex chromosomal rearrangements.11 12These methods are based on the cohybridization of 24 fluorescently labeled chromosome painting probes to metaphase chromosomes, which allows simultaneous visualization of each chromosome pair by a unique color. We performed SKY analysis of nine bone marrow (BM) samples from eight MM patients and 10 MM cell lines. We have mapped the breakpoints and identified several chromosomal sites at which translocation breaks clustered, including three novel sites at chromosome bands 3q27, 17q24-25, and 20q11, which have not previously been reported in MM. The partner chromosomes in translocations that generated all of the add(14)(q32) marker chromosomes detected by G-banding were identified, as well as two new translocations involving the band 14q32, ie, t(12;14)(q24;q32) and t(14;20)(q32;q11). These studies demonstrate the power of SKY in resolving the full spectrum of chromosome abnormalities in tumors, as well as document new recurring breakpoints.
MATERIALS AND METHODS
Tumor ascertainment and cell lines.
Nine BM aspirate samples from eight patients with MM were ascertained at the Memorial Sloan Kettering Cancer Center (MSKCC; New York, NY) (96-82906, 96-111407, 97-53005), and the Department of Genetics, University of Navarra (UN, Navarra, Spain) (11484, 12212, 12366, 12811, 12832). The age of the patients ranged from 46 to 81 years, (mean, 61). Among the eight patients, there were seven men and one woman. Seven of the nine samples were obtained at diagnosis. From one patient, samples were obtained before (11484) and after (12105) treatment. In addition, the following cell lines were studied: XG1, XG2, XG4, XG5, XG6, XG7 (provided by B. Klein, Institute of Molecular Genetics, Montpellier, France), the cell line FR4 (provided by S. Tagawa, Department of Clinical Hematology, Osaka City University, Osaka, Japan), the cell line U266 (purchased from American Type Culture Collection [ATCC], Rockville, MD), and the cell lines SKMM1 and SKMM2 (provided by A. Houghton, Immunology Program, Memorial Sloan-Kettering Cancer Center, New York, NY).
Cytogenetic analysis.
Metaphase spreads from biopsy specimens were obtained from unstimulated short-term cultures at MSKCC and from unstimulated 24-hour and B-cell–stimulated 48-hour cultures at UN. Chromosome preparation from cell lines were obtained using standard methods. Clonal chromosome abnormalities identified by G-banding were described according to International System for Human Cytogenetic Nomenclature ( ISCN) (1995).13
SKY.
Painting probes for each of the autosomes and the sex chromosomes were generated from flow sorted human chromosomes using sequence-independent DNA amplification.14 Labeling was performed by directly incorporating Spectrum Green-deoxyuridine triphosphate (dUTP); Spectrum Orange-dUTP (Vysis, Downers Grove, IL), Texas Red d-UTP (Molecular Probes, Eugene, OR), Biotin-16-dUTP and Digoxigenin-11-dUTP (Boehringer Mannheim, Indianapolis, IN) in a secondary polymerase chain reaction (PCR) reaction as previously described.11Briefly, 22 ng of each of the differentially labeled chromosome painting probes was precipitated in the presence of 50 μg of human cot-1 DNA (GIBCO-BRL, Gaithersburg, MD). Metaphase preparations aged for 2 to 3 weeks were used for SKY. Hybridization was performed for 2 days at 37°C. Biotinylated probes were detected using avidin Cy5 (Amersham Life Sciences, Arlington Heights, IL) and digoxigenin-labeled probes were detected with an antimouse digoxigin antibody (Sigma Chemicals, St Louis, MO) followed by goat antimouse antibody conjugated to Cy5.5 (Amersham Life Sciences).14 Chromosomes were counterstained with 4,6-diamino-2-phenyliodole (DAPI). For each case, a minimum of five metaphases was analyzed by SKY.
Images were acquired with a SD200 Spectracube (Applied Spectral Imaging, Migdal Ha-Emck, Israel) mounted on a Leica DMIRBE microscope or a Nikon Eclipse E800 microscope using a custom designed optical filter (SKY-1), (Chroma Technology, Brattleboro, VT). Using a Sagnac interferometer (Applied Spectral Imaging) in the optical head, an interferogram was generated at all image points, which was deduced from the optical path difference of the light which, in turn, depended on the wave length of the emitted fluorescence. The spectrum was recovered by Fourier transformation,15 16 and the spectral information was displayed by assigning red (R), green (G), or blue (B) colors to certain ranges. This RGB display rendered chromosomes that were labeled with spectrally overlapping fluorochromes or fluorochrome combinations in similar colors. Based on the measurement of the spectrum for each chromosome, a spectral classification algorithm was applied that allowed the assignment of a pseudocolor to all points in the image that have the same spectrum. This algorithm formed the basis for chromosome identification by SKY. DAPI images were acquired from all metaphases analyzed using a DAPI-specific optical filter.
Breakpoints on the SKY-painted chromosomes were determined by comparison of corresponding DAPI banding and by comparison with G-banded karyotype of the same tumor. By this method, we were able to define the breakpoints on add and der chromosomes, but were unable to assign the precise breakpoints of chromosomal segments from partner chromosomes that generated the add or derchromosomes. A breakpoint was considered recurring if identified in two or more cases by G-banding, SKY, or by both.
FISH analysis.
Whole chromosome painting probes for chromosomes 12 and 14 (Vysis) were used to define the translocations involving these chromosomes. Probe hybridization was performed as recommended by the manufacturer’s protocols, with slight modifications. FISH was performed on metaphase spreads from SKMM1 and XG2 cell lines using the biotinylated phage (F1422) containing IGH-JH sequences. Probe hybridization and detection was performed as described previously.17
RESULTS
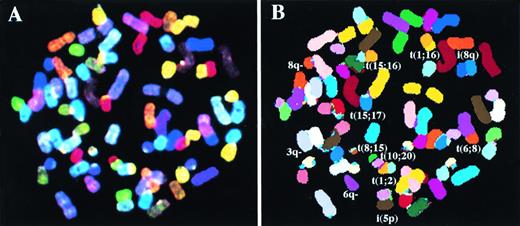
We analyzed breakpoints and rearrangements in a panel of nine MM BM biopsies and 10 MM cell lines by SKY. A range of simple and complex chromosomal rearrangements was detected, which included reciprocal and nonreciprocal translocations, robertsonian translocations, deletions, and insertions. An example of a SKY-painted metaphase from cell line XG4 showing display colors (A) and spectra-based classification colors (B) is shown in Fig 1.
A metaphase spread for the cell line XG4 after simultaneous hybridization of 24 combinatorially-labeled chromosome painting probes. (A) Shows display colors and (B) shows spectra-based colors (see Materials and Methods for explanation). Abnormal chromosomes are identified and their derivation has been noted in (B).
A metaphase spread for the cell line XG4 after simultaneous hybridization of 24 combinatorially-labeled chromosome painting probes. (A) Shows display colors and (B) shows spectra-based colors (see Materials and Methods for explanation). Abnormal chromosomes are identified and their derivation has been noted in (B).
Analysis of breakpoints.
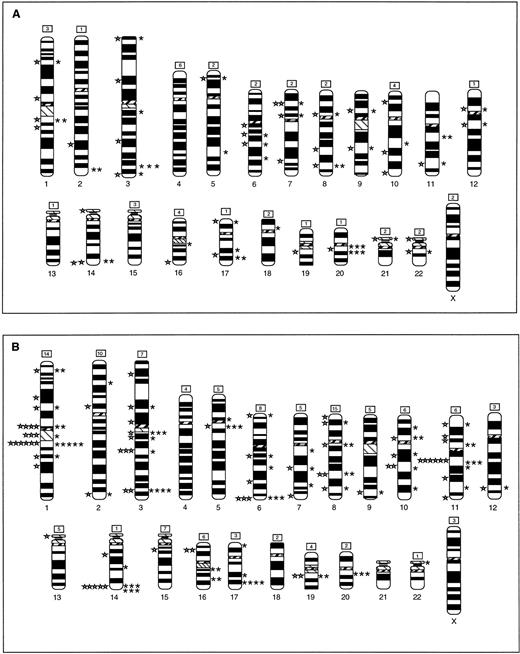
Figure 2 summarizes the breakpoints identified by G-banding and by SKY in the tumor biopsies (Fig2A) and cell lines (Fig 2B). By G-banding of biopsy specimens, 39 breakpoints were identified in rearranged chromosomes, excluding unidentified marker chromosomes. By SKY, 44 breakpoints were identified in rearranged chromosomes, with another 42 assigned to chromosomes based on identification of chromosomal segments attached to or inserted into add order chromosomes, but whose specific breakpoints could not be determined. Overall, recurring breaks (two or more) were noted at 22 sites in this panel of tumor biopsies. The distribution of breakpoints identified by G-banding and SKY was similar except at four sites, 2q37, 3q27, 11q13, and 20q11; breaks at these sites were identified mainly by SKY. Among the cell lines, applying the same criteria as above, 74 breakpoints were identified by G-banding, while SKY showed 82 identifiable and 121 unidentifiable breakpoints. Recurring sites were identified at 34 sites. The distribution of breakpoints identified by G-banding and SKY was again similar in the cell lines. As in the biopsy specimens, the cell lines showed frequent breakage at 3q27 and 20q11. In addition, clustering of breaks was noted at 1p12, 1q21, 3q11, 3q21, 5q11, 6q27, 11q13, 14q32, and 17q24-25. Thus, the cell lines showed a higher number of breakpoints, as well as recurring breaks. This may be due to the fact that cell lines are often derived from advanced disease and maintained in culture, both of which predispose to instability and karyotypic evolution.
Ideogram showing all of the breakpoints noted in biopsy samples (A) and in cell lines (B), identified by G-banding (left) and by SKY (right). The number of breakpoints in each chromosome that were identified by SKY, but could not be precisely assigned to a band are noted in the box on top of the chromosome. Breakpoint and chromosome identification analysis as described in Materials and Methods.
Ideogram showing all of the breakpoints noted in biopsy samples (A) and in cell lines (B), identified by G-banding (left) and by SKY (right). The number of breakpoints in each chromosome that were identified by SKY, but could not be precisely assigned to a band are noted in the box on top of the chromosome. Breakpoint and chromosome identification analysis as described in Materials and Methods.
Analysis of translocations.
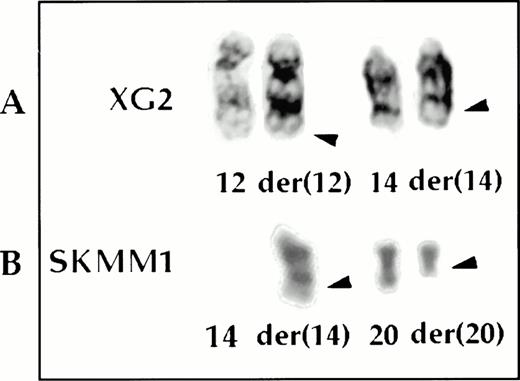
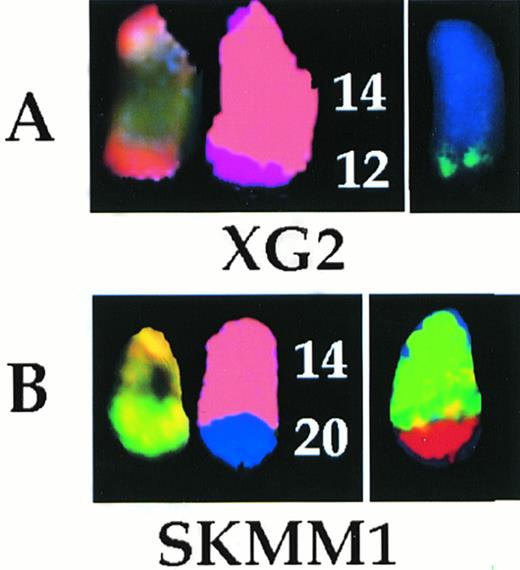
In the BM biopsy specimens, six translocations were identified by G-banding, none of which was recurring. In the same biopsies, SKY showed 38 translocations, none of which was also recurring. By G-banding, case 96-111407, a biopsy specimen, exhibited 2 add(14)(q32) marker chromosomes whose derivation could not be determined. SKY enabled their identification as derived from t(14;18)(q32;?) and t(14;20)(q32;q11) translocations, respectively. G-banding of the cell lines showed 18 translocations, of which only one, t(11;14)(q13;q32), was recurring and was seen in XG1 and XG5. In addition, one add(14)(q32) marker chromosome was seen in each of the cell lines XG2, FR4, SKMM1, and SKMM2. SKY showed 79 translocations, two of which were potentially recurring; a t(15;17)(q?;q24-25) seen in XG4 and XG5, and a t(17;19)(q24-25;?) seen in XG1 and XG6. The two cases of t(11;14)(q13;q32) translocations identified by G-banding were confirmed. In addition, the derivation of each of the add(14)(q32) marker chromosomes was determined: t(12;14)(q24;q32) (Figs 3 and 4) in XG2, t(8;14)(q24;q32) in FR4, t(14;20)(q32;q11) (Figs 3 and 4) in SKMM1, and t(11;14)(q13;q32) in SKMM2. The cryptic t(6;14)(p25;q32) translocation in SKMM1 analysis, which showed deregulation ofMUM1/IRF410 was not detected by SKY analysis of the cell line. The 6p25 breakpoint was subtelomeric and the painting probe used may not have included sequences from this region.
The t(12;14)(q24;q32) (A) and the t(14;20)(q32;q11) (B) translocations by G-banding.
The t(12;14)(q24;q32) (A) and the t(14;20)(q32;q11) (B) translocations by G-banding.
The t(12;14) (A) and t(14;20) (B) translocations analyzed by SKY and whole chromosome painting. In each case, from left to right are shown the SKY (display and spectral classification) and whole chromosome painted images of the der (14) chromosomes.
The t(12;14) (A) and t(14;20) (B) translocations analyzed by SKY and whole chromosome painting. In each case, from left to right are shown the SKY (display and spectral classification) and whole chromosome painted images of the der (14) chromosomes.
Analysis of clonal markers and cryptic rearrangements.
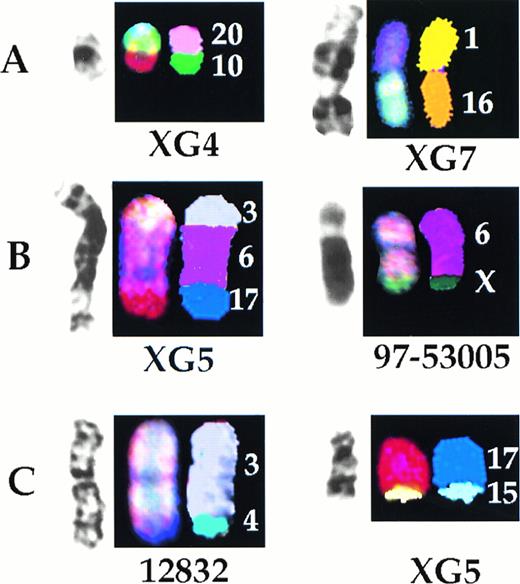
The derivation of all the clonal markers detected in the biopsy specimens and the cell lines was determined by SKY (Table 1, Fig5A). Although all of these markers represented translocations, none was recurring. In addition, SKY analysis showed that a number of translocations were either misidentified or incompletely characterized by G-banding (Table 2, Fig 5B). Most of the deletions identified by G-banding were found to represent translocations (Table 2). In two biopsy samples, apparently normal chromosomes 3 (12832) and 11 (98-82906) were found to comprise translocated chromosomes, der(3)t(3;4) and der(11)t(11;17), respectively. Finally, in the cell lines XG4, XG5, and XG6, apparently normal chromosomes 16 and 17 were found to be translocated: der(16)t(1;16) and der(16)t(15;16) in XG4, der (16)t(10;16) and der(16)t(16;22) in XG6, der(17)t(15;17) in XG4, der(17)t(15;17) in XG5 (Fig 5C), and der(17)t(17;19) in XG6.
Clonal Marker Chromosomes Identified by SKY in Biopsies and Cell Lines
| Biopsy/Cell Line . | G-banding . | SKY . |
|---|---|---|
| 11484* | mar1 | t(10;17) |
| 12105* | mar1 | t(10;17) |
| XG4 | mar1 | der(20)t(10;20) |
| XG7 | mar1 | der(10)t(2;10) |
| mar2 | der(16)t(1;16) | |
| mar3 | der(22)t(2;22) | |
| U266 | mar1 | der(8)t(1;8;11) |
| mar2 | der(8)t(7;8) | |
| mar3 | der(13)t(2;13) | |
| mar4 | ins(14;10) |
*Samples from the same patient.
Representative examples of characterization by SKY of derivation of clonal marker chromosomes detected by G-banding (A), characterization by SKY of rearrangements misidentified by G-banding (B), and cryptic translocations (C). For each illustration, left to right are G-banded, SKY display color, and SKY classification images.
Representative examples of characterization by SKY of derivation of clonal marker chromosomes detected by G-banding (A), characterization by SKY of rearrangements misidentified by G-banding (B), and cryptic translocations (C). For each illustration, left to right are G-banded, SKY display color, and SKY classification images.
Refinement by SKY of Structural Aberrations Misidentified by G-Banding
| Biopsy/Cell Line . | G-banding . | SKY . |
|---|---|---|
| 12105 | dup(7)(p21) | der(7)t(6;7) |
| 12212 | del(1)(p13) | der(1)t(1;15) |
| der(2)t(2;3) | der(2)t(1;2) | |
| 12366 | dup(3)(q?) | der(3)t(3;16) |
| 12811 | del(3)(p14) | der(3)t(3;20) |
| 12832 | del(1)(q32) | der(1)t(1;20;21) |
| 97-53005 | del(6)(q21-25) | der(6)t(X;6) |
| XG-2 | der(19)t(1;19) | der(19)t(1;7;19) |
| XG-5 | der(6)t(1;6) | der(17)t(3;6;17) |
| del(3)(p12-13) | der(5)t(3;5) | |
| del(3)(q21) | der(3)t(3;5) | |
| XG-6 | der(11)t(1;11) | der(11)t(1;3;11) |
| XG-7 | der(6)t(6;8) | der(6)t(3;6) |
| der(8)t(3;8) | der(8)t(8;13) | |
| U266 | dup(1)(p36) | der(1)t(1;3) |
| der(3)t(3;11) | der(3)t(3;16) | |
| der(11)t(1;11) | der(11)t(1;8;11) |
DISCUSSION
Karyotypic information on MM is limited when compared with other myeloid and lymphoid malignancies. This was due to low mitotic activity of plasma cells and the complexity of the chromosomal rearrangements. FISH analysis using chromosome specific ∝-satellite DNA probes demonstrated aneuploidy in 80% of the MM patients.18However, this approach is useful only in detecting numerical changes of previously known target sequences. To fully characterize the chromosomal rearrangements in MM, we applied the SKY19technique to metaphase chromosomes from nine MM biopsies and 10 MM-derived cell lines. The results reported here demonstrate the strength of the SKY technology, namely, the ability to characterize unambiguously the derivation of each rearranged chromosomal segment. This enabled us to identify new recurring sites of rearrangement, characterize marker chromosomes, and identify new recurring translocations. However, SKY technology, at its current state, does not permit recognition of some of the breakpoints, such as those associated with deletions and some of the segments added or inserted intoder or add chromosomes, although the derivation of the latter can be established. To identify such breakpoints, additional reagents such as locus/region-specific probes or mapped YACs, BACs, or PACs need to be used, as demonstrated in this study.
Based on G-banding analysis of clonally abnormal karyotypes of 88 cases of MM and related disorders, we (M.J.C. and J.C.C.) have recently mapped breakpoints and identified three frequently rearranging sites, namely, 14q32, 16q22, and 22q11.6 The 14q32 rearrangements were represented by one instance each of t(8;14)(q24;q32) and t(11;14)(q13;q32), while the remaining 18 comprised add(14)(q32) marker chromosomes. The 16q22 and 22q11 breakpoints represented deletions, as well as translocations. While breakage at these sites was noted by SKY analysis in the present study, their frequencies were not comparable to those seen in the G-banding study. This is not unexpected because SKY identifies many of the breakpoints in marker chromosomes that cannot be characterized by G-banding, as well as cryptic rearrangements missed by G-banding. All of these have been documented in the results of this study. Thus, our SKY analysis identified several new recurring sites of rearrangement.
The value of SKY in fully characterizing frequently recurring marker chromosomes such as add(14)(q32) and in identifying new recurring translocations and translocation breaks is well demonstrated in this study. In B-cell lymphomas, a number of genes of significance to B-cell biology and lymphomagenesis, such as MYC, BCL1,BCL2, BCL6, BCL8, PAX5, have been discovered through molecular genetic analysis of recurring chromosomal translocations involving the IG gene sites (14q32; 2p21; 22q11) and other chromosomal sites.17,20-24 In the case of MM, the t(11;14)(q13;q32) translocation, which leads to the deregulation ofBCL1, has been noted frequently, while the t(8;14)(q24;q32), which deregulates MYC, has been noted infrequently. Recently two new translocations have been identified, t(4;14)(p16.3;q32) and t(6;14)(p25;q32), which lead to the deregulation of FGFR3 andMUM1/IRF4 genes, respectively in MM.10,25 Given the frequent occurrence of the add(14)(q32) marker chromosomes in MM, the existence of additional genes similarly deregulated by IG genes can be reasonably predicted. This is substantiated by our discovery, by SKY analysis of add(14)(q32) marker chromosomes, of two new translocations, t(12;14)(q24;q32) and t(14;20)(q32;q11); the latter was recurring even in this small series. The 12q24 breakpoint has been shown to harbor a locus, BCL7, which was rearranged in a Burkitt’s lymphoma (BL) cell line.26 Its possible rearrangement in MM remains to be determined. We have also identified, using SKY, two new potentially recurring translocations that do not involve the IG gene sites, namely, t(15;17)(q?;q24-25) and t(17;19)(q24-q25;?). This study also identified the 3q27 region to be frequently involved in translocations. The BCL6 gene, mapped to this region, is deregulated by translocation with the IG genes in B-cell lymphomas; its deregulation in MM has so far not been reported; nor has a t(3;14)(q27;q32) translocation been identified.
SKY is one of two molecular cytogenetic technologies developed during the past 5 years that offer the promise of high resolution cytogenetics. While SKY is very powerful in documenting chromosome rearrangements, it can be performed only when metaphase spreads are available, which is a limitation in the case of MM. The other technique, comparative genomic hybridization (CGH), is based on small amounts of tumor DNA without the need to have tumor metaphases.27 However, CGH can only detect chromosomal and subchromosomal gains and losses. In a recent CGH study of MM, we have shown that diagnostic, as well as prognostic, gains and losses of chromosomal regions in MM can be precisely documented.28Thus, a combination of molecular cytogenetic techniques along with traditional G-banding cytogenetics offers new insights into the biology and clinical behavior of MM, a genetically complex hematologic disorder.29
Supported by Grants No, CA-34775 and CA-66999 from the National Institutes of Health/National Cancer Institute (to R.S.K.C.).
Address reprint requests to R.S.K. Chaganti, PhD, Memorial Sloan Kettering Cancer Center, 1275 York Ave, New York, NY 10021; e-mail:chagantr@mskcc.org.
The publication costs of this article were defrayed in part by page charge payment. This article must therefore be hereby marked “advertisement” in accordance with 18 U.S.C. section 1734 solely to indicate this fact.

This feature is available to Subscribers Only
Sign In or Create an Account Close Modal