Abstract
Somatostatin and its analogs can inhibit growth in several cell types, in part by interfering with insulin-like growth factor-I (IGF-I) signaling. Our previous studies point to the importance of paracrine and autocrine IGF-I in the support of growth and survival of human multiple myeloma (MM) cell lines. In this report, we have investigated the potential role of a somatostatin analog, octreotide, in regulating growth and/or survival in MM. The results show that all MM cell lines express functional somatostatin receptors (sst). The MM cell lines express the subtypes sst2, sst3, and predominantly sst5 as determined by reverse-transcriptase polymerase chain reaction and fluorescence-activated cell sorter analysis. Octreotide inhibited the growth of both the interleukin-6 (IL-6)–dependent and the IL-6–independent MM cell lines. The effect is mainly cytostatic, resulting in 25% to 45% growth inhibition, and in three of eight of the MM cell lines a weak induction of apoptosis was recorded. Our results also show that octreotide may act as an inducer of apoptosis in primary B-B4+ plasma cells isolated from bone marrow of MM patients. In conclusion, the results show a novel pathway for growth inhibition of MM cells: the activation of somatostatin receptor signaling.
HUMAN MULTIPLE MYELOMA (MM) is a clonal expansion of malignant plasmablasts–plasma cells in the bone marrow. The growth of MM cells is regulated by complex interactions between the malignant cells and cells of the microenvironment, eg, osteoblasts and stroma cells.1 Interleukin-6 (IL-6) is a major growth factor both in vitro and in vivo, but several other cytokines have been reported to stimulate the growth of MM cell lines and/or freshly explanted MM cells.2 We and others have recently shown that insulin-like growth factor-I (IGF-I) can promote growth and/or survival of MM cell lines.3,4 We also showed that IGF-I is produced by MM cell lines, and that an autocrine IGF-I loop may participate in maintaining growth and survival in MM cell lines.3
So far only a few factors have been shown to inhibit the growth of MM cells. Interferon (IFN)-α at low concentrations may act as a growth factor for MM biopsy cells and MM cell lines,5,6 while higher concentrations of IFN-α inhibit the growth of MM cell lines and biopsy cells.5,7,8 IFN-γ can inhibit the growth of IL-6–dependent MM cell lines and was also reported to inhibit IL-6–dependent proliferation of freshly explanted MM cells.8,9 The growth-inhibitory effect of the IFNs seems partly to be mediated by inhibition of paracrine and autocrine IL-6 signaling, eg, via a downregulation of IL-6 receptors.2,9 10
Analogous to the inhibitory effect of IFNs on IL-6 signaling, somatostatin and its analogs can inhibit growth by interfering with IGF-I signaling in normal and malignant cells.11Downregulation of IGF-I,12 upregulation of the expression of inhibitory IGF-I–binding proteins,13 and inhibition of the mitogenic signaling via the IGF-I receptor (IGF-IR)14 15 have been reported as plausible mechanisms mediating the growth-inhibitory effect of the somatostatin analog octreotide.
Somatostatin acts as a neurotransmitter and a general inhibitor of secretion, and can induce antiproliferative effects in, for example, activated peripheral blood lymphocytes (PBL) and intestinal mucosa lymphocytes.16 The growth-inhibitory effect has been suggested to be subtype-specific, since cells with high-affinity receptors are more sensitive to somatostatin-induced growth inhibition.16,17 The knowledge of somatostatin receptor (sst) expression in lymphocytes is incomplete. In receptor-binding assays, normal resting PBL express low-affinity sst, while activated PBL, lymphoblastic leukemia cells, and Epstein-Barr virus (EBV)–positive B cells usually express high-affinity sst.17 The U-266 MM cell line has been shown to express both low-and high-affinity sst.18 Five different sst subtypes have now been cloned,19-21 and a growth-inhibitory signal has been shown to be mediated by sst1,sst2, and sst5 through different mechanisms.22,23 Furthermore, sst3 activation may induce apoptosis.24 The function of sst4, which has a low affinity for somatostatin compared with the other sst subtypes, is essentially unknown. The knowledge of subtype expression in hematopoietic cells is limited, but sst2, sst3, and sst5 have been found in some B- and T-cell lines.25
Based on our earlier results, showing IGF-I stimulation of growth and/or survival of MM cell lines and the ability of octreotide to inhibit IGF-I signaling in several cell types, we examined the expression of sst subtypes in MM cells and whether such receptors, when expressed, may transmit growth-inhibitory signals following binding of the somatostatin analog octreotide. The response of primary isolated B-B4+ cells to octreotide was also examined. By reverse-transcriptase polymerase chain reaction (RT-PCR) and flow cytometry, all MM cell lines in the panel were found to express sst2, sst3, and sst5 both at the RNA level and on the cell surface. Octreotide inhibited the growth of both IL-6–independent and IL-6–dependent cell lines and a weak induction of apoptosis in three of eight MM cell lines was recorded. Our results also indicate that octreotide may induce apoptosis in freshly explanted MM cells.
MATERIALS AND METHODS
Cell lines.
A panel of eight human MM cell lines, previously examined for their response to IGF-I and IL-6, was selected (Table1). The panel included two cell lines (U-266 and HL407) in which a progression from IL-6 dependence at early passages (U-266-197026 and HL 407E27) to IL-6 independence has occurred during long-term in vitro culture (U-266-198428 and H407L27). The IL-6–independent cell lines (LP-1,29 EJM,30Karpas 707,31 HL407L, and U-266-1984) are maintained in RPMI 1640 (Flow, Irvine, UK) supplemented with 10% fetal bovine serum (FBS; GIBCO, Grand Island, NY), glutamine, and antibiotics (penicillin 100 U/mL and streptomycin 50 μg/mL). The IL-6–dependent cell lines (U-1958,32 HL407E, and U-266-1970) are grown on human fibroblasts, AG 1523, purchased from the Human Mutant Genetic Cell Repository (Camden, NJ) and maintained in the same medium as the IL-6–independent cell lines. Medium is replenished twice a week.
Summary of the Role of IL-6 and IGF-I in the Panel of MM Cell Lines
| . | Cell Line . | Response to IGF-I . | Response to Anti– IGF-IR Antibodies . | Population Doubling Time (h) . | Reference . |
|---|---|---|---|---|---|
| IL-6–independent | LP-1 | + | + | 24 | 29 |
| EJM | − | + | 60 | 30 | |
| Karpas 707 | + | + | 60-72 | 31 | |
| HL407L | + | + | 36 | 27 | |
| U-266-1984 | − | + | 48 | 28 | |
| IL-6–dependent | U-1958 | + | + | 60-72 | 32 |
| HL407E | + | + | 48 | 27 | |
| U-266-1970 | − | + | 60 | 26 |
Response to IGF-I refers to growth stimulation by exogenous IGF-I, while response to anti–IGF-IR antibodies refers to growth inhibition of cells growing in normal culture medium (without added IGF-I). Cells were cultured with different concentrations of IGF-I or anti–IGF-IR antibodies for 120 hours, harvested, and counted using trypan blue exclusion. Data on LP-1, EJM, and Karpas 707 were previously published,3 while data on the other cell lines are based on previously unpublished observations.
Bone marrow samples from two MM patients were obtained at the time of diagnosis and the mononuclear cells were isolated using Ficoll-Hypaque (Pharmacia, Uppsala, Sweden) density centrifugation. The cells were then incubated with the B-B4+ antibody (IQP, Groningen, Holland) for 30 minutes, washed, and incubated with antimouse IgG-covered magnetic beads (Dynal, Oslo, Norway). The B-B4+cells were separated with a Dynal MPC and counted. The frequency of B-B4+ cells with a plasma cell morphology exceeded 95% as determined in May-Grünwald-Giemsa–stained cytospin preparations.
Receptor-binding studies.
The cells were incubated in acidic medium (RPMI 1640, pH 3) for 1 minute to remove bound ligand, washed, and then kept in binding buffer (phosphate-buffered saline [PBS], 1% FBS, HEPES 10 mmol/L pH 7.2, aprotinin 2.8 μg/mL, phenylmethylsulfonyl fluoride [PMSF] 0.2 mmol/L). A 10,000 cpm quantity of 125I-somatostatin (2,000 Ci/mmol; Amersham, Essex, UK) was added to each well containing 106 cells. Cold somatostatin (10−5 mol/L; Sigma, Stockholm, Sweden) was added to control wells to compete for binding. The cells were then incubated on ice for 2 hours to reach equilibrium and washed three times followed by measurement of the bound radioactivity in a γ-counter (LKB Wallac, Pharmacia, Finland). Specific binding (cpm) refers to total binding minus binding in the presence of cold somatostatin.
PCR.
Exponentially growing cells from stock cultures were harvested, and RNA was extracted using a modified version of the single-step method established by Chomczynski and Sacchi.33 cDNA was synthesized from 1 μg of RNA and primed with oligo-d(T) as described elsewhere.34 For each PCR, we used 1/10 of a cDNA synthesis reaction. Amplification was performed for 35 cycles. The annealing temperature was 60°C for all reactions. The ubiquitously expressed G3PDH gene was used as a control for the quality of the cDNA. Primers were purchased from Scandinavian Gene Synthesis (Köping, Sweden). The primer sequences used are as previously described35 36: sst2 primers—5′ TGGAAGCCACACATGGCTAT, 3′ CCATCCACAGTCATGACCAC; sst3 primers—5′ CATGGACATGCTTCATCCAT, 3′ CATGACCAGGCGGCACATGA; sst5primers—5′ CGTCTTCATCATCTACACGG, 3′ GGCCAGGTTGACGATGTTGA. Reactions were performed in PCR buffer (50 mmol/L KCl, 10 mmol/L Tris-HCl, pH 9.0, and 0.1% Triton X-100), 1.5 mmol/L MgCl2, 200 μmol/L of each dNTP, 1.0 U Taq polymerase, and 1 μmol/L of each primer. The reagents, except the primers, were purchased from Promega (Madison, WI). Dimethyl sulfoxide (DMSO) (2%) was added to the sst5 reactions. As negative controls, tubes without RT were included in the cDNA synthesis reactions. No genomic contamination was detected in the RNA preparations after PCR. As a control for carry-over contamination, we also included tubes without cDNA in the PCR. The specificity of the products was confirmed by size and by cutting the products with restriction enzymes (sst2, Bal I; sst3, Sac I; and sst5, Hga I). The specificity of the products was also confirmed by fluorescence-based dideoxy terminator cycle sequencing using a Taq polymerase-based kit (Applied Biosystems, Foster City, CA) and an automated DNA sequencer (Model 310; Applied Biosystems). The products were run on a 2% agarose gel with a 100-bp marker (Pharmacia) and stained with ethidium bromide (0.5 μg/mL). The expected sizes of the PCR products were 342, 361, and 222 nt for sst2, sst3, and sst5, respectively.
Development of rabbit antihuman sst antibodies.
Deduced from the amino acid sequences of human sst subtypes sst2, sst3, and sst5,21three polypeptides were synthesized by a solid-phase system using Fmoc chemistry (Applied Biosystems Model 430A). The peptides were purified by reverse-phase chromatography and analyzed by plasma desorption mass spectrometry (PDMS; Bioion 20, Bioion Nordic AB, Uppsala, Sweden). The sequences were selected to be specific for the different sst subtypes and the homology was less than 48% to any other known protein sequence in the data bank MPsrch Protein, version 1.5 (Shane S. Surrock & John F. Collins 1993, Biocomputing Research Unit, University of Edinburgh, UK), except for the respective sequences of sst from other species. The sequences were amino acids 330 to 343 for sst2, amino acids 366 to 381 for sst3, and amino acids 327 to 341 for sst5, all with additional tyrosine residues at the N-terminals (Tyr0) and amidated C-terminals. Before immunization, the peptides were coupled to a carrier protein. Peptide (2 mg) and 20 mg bovine serum albumin were dissolved in a 50 mmol/L sodium phosphate buffer at pH 7.4, containing 150 mmol/L NaCl. Coupling was then induced by addition of 90 μL glutaraldehyde.37 The resulting complexes were injected into white New Zealand rabbits, using the intradermal injection technique, to produce polyclonal antibodies.38
Flow cytometry.
Exponentially growing cells were pretreated with acidic medium as described earlier and then kept in PBS with 1% FBS. The rabbit antihuman sst antisera were diluted 1:6 and incubated with the cells for 30 minutes on ice. Normal rabbit serum from the same rabbits was used as a negative control. The cells were then washed three times and incubated for 30 minutes on ice with fluorescein-conjugated swine antirabbit antibodies (1:30) (Dako A/S, Glostrup, Denmark) and analyzed in a flow cytometer (FACScan; Becton Dickinson, San José, CA). To allow comparison between cell lines with different levels of autofluorescence, the mean fluorescence (MFI) was expressed as relative fluorescence, where the negative control was arbitrarily set to 1. The results are presented as the MFI from three experiments ± SEM.
Growth and survival assays.
Exponentially growing cells were seeded at a concentration of 4 × 10 5 cells/mL in RPMI 1640 with 10% FBS, glutamine, and antibiotics. IL-6 (50 U/mL; R&D Systems, Abington, UK) was added to cultures of IL-6–dependent cells. Octreotide (Novartis Pharma AG, Basel, Switzerland) was added at concentrations ranging from 0 to 1,000 nmol/L. In a few experiments, native somatostatin (Sigma) was used in parallel at the same concentrations and was added every 12 hours. Octreotide binds to sst2, sst3, and sst5, while somatostatin binds to all sst subtypes.22 The cells were then incubated at +37°C for 48 hours, harvested, and total and viable cell numbers determined using a Bürker chamber and Trypan blue exclusion. In some experiments, the apoptotic cells were analyzed using annexin V/propidium iodide (PI) staining (R&D Systems) according to the manufacturer’s instructions. The number of apoptotic cells was determined as the percentage of annexin V–positive, PI-negative cells. The B-B4+ primary cells were seeded at 6 × 10⁵ cells/mL in RPMI 1640, 10% FBS, glutamine, and antibiotics. Octreotide (10−8 mol/L), IL-6 (100 U/mL), and IGF-I (10−7 mol/L, Pharmacia) were added (see Fig 6). After 24 hours, the cells were counted using Trypan blue exclusion. Apoptosis was identified by the morphologic hallmarks, cell shrinkage, condensation of chromatin, and karyorrhexis examined in May-Grünwald-Giemsa–stained cytospin preparations.
Cell cycle analysis.
We also performed PI staining of cell nuclei to analyze the cell cycle distribution as described elsewhere.39 Briefly, cells were incubated without or with 10−6 mol/L octreotide and harvested at 8 and 20 hours. Nuclei were prepared by treating cells with 0.03 mg/mL of trypsin (Sigma) for 10 minutes at room temperature and RNase A (0.08 mg/mL; Sigma) for 10 minutes at room temperature. The nuclei were stained with PI (0.2 mg/mL; Sigma) and analyzed with the MacCycle program (Phoenix Flow Systems, Inc, San Diego, CA) on a FACScan.
RESULTS
sst binding.
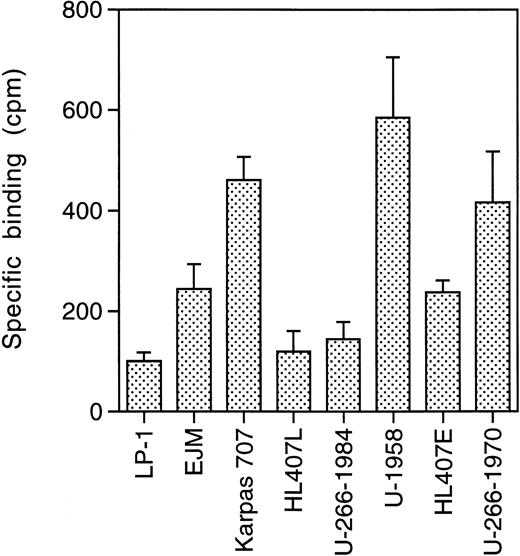
To investigate the expression of ssts on the panel of MM cell lines, we performed receptor binding studies using 125I-somatostatin. The MM cells were pretreated with acidic medium to remove bound ligand. The cells were then incubated with 125I-somatostatin in the absence or presence of a large excess of cold somatostatin (10−5 mol/L). Specific binding, binding to sst, was calculated as total binding minus binding in the presence of cold somatostatin. All MM cell lines show specific binding of125I-somatostatin, but at different levels (Fig1). The LP-1 cell line displayed the lowest level of 125I-somatostatin binding (100 ± 17 cpm), while U-1958 cells bound almost six times as much125I-somatostatin (585 ± 120).
sst binding. Cells were incubated for 2 hours on ice with125I-somatostatin (2,000 Ci/mmol) in 24-well plates. A total of 10,000 cpm was added to each well containing 106cells. Cold somatostatin (10−5 mol/L) competed for binding and specific binding was calculated as total binding minus binding in the presence of cold somatostatin. Data are means ± SD from one representative experiment of three.
sst binding. Cells were incubated for 2 hours on ice with125I-somatostatin (2,000 Ci/mmol) in 24-well plates. A total of 10,000 cpm was added to each well containing 106cells. Cold somatostatin (10−5 mol/L) competed for binding and specific binding was calculated as total binding minus binding in the presence of cold somatostatin. Data are means ± SD from one representative experiment of three.
The level of binding correlated to the population doubling time of the different cell lines (r2 = .89; Table 1 and Fig 1). Thus, the LP-1 and HL407L cell lines, which had the lowest level of binding, have population doubling times of 24 to 36 hours, while the U-1958 and Karpas 707 cell lines with high125I-somatostatin binding have a doubling time of 60 to 72 hours. The other cell lines (EJM, U-266-1984, HL407E, and U-266-1970) with an intermediate level of binding have population doubling times ranging between 48 and 60 hours.
As a group, the IL-6–dependent cell lines displayed a higher level of125I-somatostatin binding than the IL-6–independent cell lines. This difference was also reflected in the clones of the U-266 and HL407 cell lines. During in vitro culture, the U-266 and HL407 cell lines have progressed from IL-6 dependence (U-266-1970 and HL407E) to IL-6 independence (U-266-1984 and HL407L). Concomitant with this progression the growth rate increased, and the tendency to undergo spontaneous apoptosis decreased. As shown in Fig 1, the sst have been downregulated during progression in these cell lines. U-266-1970 cells bind three times as much 125I-somatostatin as U-266-1984 cells, while the HL407E cells bound twice as much as the cells of the HL407L.
sst subtype expression.
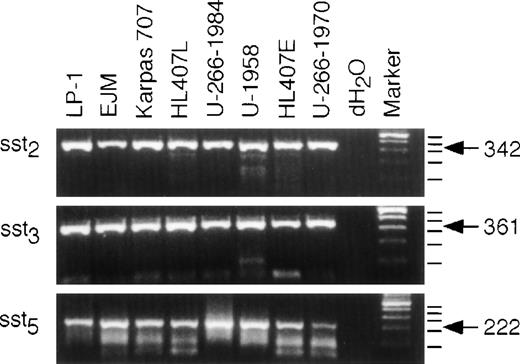
To investigate sst subtype expression on the different MM cell lines, we isolated RNA from exponentially growing cells from each cell line, synthesized cDNA, and performed PCR for sst2, sst3, and sst5. As shown in Fig2, all cell lines expressed mRNA for all three sst subtypes investigated. The PCR reached the plateau phase before 35 cycles in some reactions; therefore, quantification of different expression levels is not possible in this experimental set-up. The human sst genes, except sst2, lack introns and contamination by genomic DNA would yield products of the same size. Therefore, we included tubes without RT in the cDNA synthesis reactions. Amplification of these templates were all negative (data not shown). The specificity of the PCR products was confirmed by size and restriction fragment analysis using Bal I, Sac I, andHga I for sst2, sst3, and sst5, respectively, and G3PDH was used as a control for the quality of the cDNA. Furthermore, the specificity of the products was also confirmed by sequencing as described in Materials and Methods (data not shown).
Expression of sst2, sst3, and sst5 mRNA. RNA was extracted and cDNA was synthesized as described in Materials and Methods. Only RNA free of contaminating genomic DNA was used for the PCR. A PCR with 35 cycles of amplification was performed and the products were resolved on a 2% agarose gel and stained with ethidium bromide. dH2O was used as a control for carry-over contamination. The expected sizes of the fragments are: sst2, 342 bp; sst3, 361 bp; sst5, 222 bp.
Expression of sst2, sst3, and sst5 mRNA. RNA was extracted and cDNA was synthesized as described in Materials and Methods. Only RNA free of contaminating genomic DNA was used for the PCR. A PCR with 35 cycles of amplification was performed and the products were resolved on a 2% agarose gel and stained with ethidium bromide. dH2O was used as a control for carry-over contamination. The expected sizes of the fragments are: sst2, 342 bp; sst3, 361 bp; sst5, 222 bp.
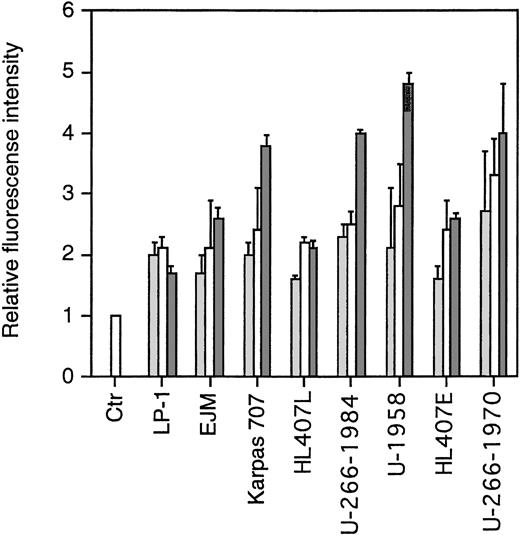
To study the expression of sst subtypes on the cell surface of the MM cell lines, we performed flow cytometric analysis using rabbit antiserum against human sst2, sst3, and sst5. Normal rabbit serum (NRS) was used as a negative control. As secondary antibody, we used fluorescein-conjugated swine antirabbit antibodies. To enable us to compare fluorescence intensities, the MFI of cells incubated with NRS and the secondary antibody was arbitrarily set to 1. As shown in Fig3, all MM cell lines expressed sst2, sst3, and sst5. The pattern was similar in the MM cell lines in that the MFI was lowest for sst2 and highest for sst5. The exception was cells of the LP-1 and HL407L cell lines, where no significant difference in the MFI of the sst subtypes could be shown.
FACScan analysis on the expression of sst2, sst3, and sst5. Cells were incubated with normal rabbit serum (ctr) or rabbit antihuman polyclonal antibodies. After washing, cells were incubated with fluorescein-conjugated swine antirabbit antibodies. Relative fluorescence is the MFI of the different samples compared with the MFI of the negative control, which was arbitrarily set to 1. Data are means ± SEM from three experiments. (▩) sst2 , (□) sst3, (▩) sst5.
FACScan analysis on the expression of sst2, sst3, and sst5. Cells were incubated with normal rabbit serum (ctr) or rabbit antihuman polyclonal antibodies. After washing, cells were incubated with fluorescein-conjugated swine antirabbit antibodies. Relative fluorescence is the MFI of the different samples compared with the MFI of the negative control, which was arbitrarily set to 1. Data are means ± SEM from three experiments. (▩) sst2 , (□) sst3, (▩) sst5.
Effect of octreotide on growth of MM cells.
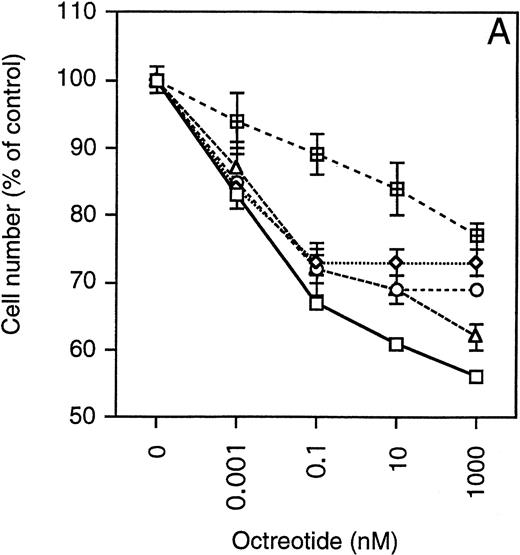
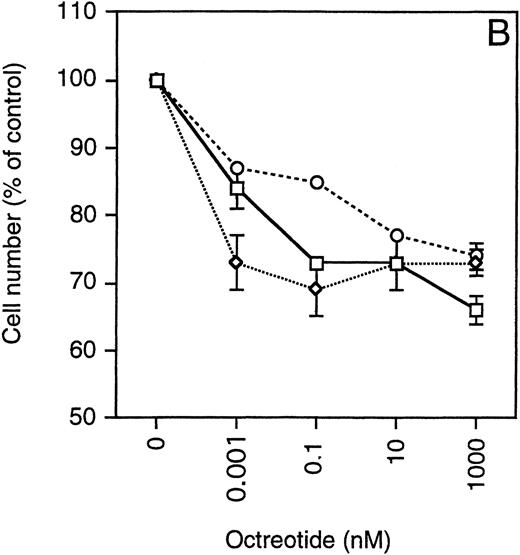
Exponentially growing cells from the MM cell lines were harvested, washed twice, and then seeded at 4 × 10 5 cells/mL in 48-well plates. The cells were incubated in RPMI 1640 with 10% FBS, glutamine, antibiotics, and different concentrations of octreotide (0 to 1,000 nmol/L). After 48 hours, the cells were harvested and total and viable cells were counted using Trypan blue exclusion. To simplify comparisons between the MM cell lines, which have a wide range of population doubling times, the number of viable cells was plotted as the percentage of exponentially growing control cells. As depicted in Fig 4, cells from all MM cell lines were growth-inhibited in a dose-dependent manner by octreotide. The growth was inhibited by 25% to 45%. When octreotide was substituted by somatostatin, the inhibitory effect on growth was essentially the same (data not shown). No systematic difference between IL-6–independent (Fig 4A) and IL-6–dependent cell lines (Fig 4B) could be recorded. The strongest growth inhibition (40% to 45%) was seen in cells from the LP-1 and HL407L cell lines. The weakest response (25%) was seen in cells of the U-266 cell lines (U-266-1970 and U-266-1984). In a majority of the cell lines, the growth inhibition was not accompanied by a decrease in viability, the exception being the U-1958, HL407E, and HL407L cell lines, where a minor decrease in the viability was recorded (Table 2). Annexin V/PI staining of cells from the U-1958, HL407E, and HL407L cell lines showed a small increase in the number of apoptotic cells in cell cultures treated with octreotide (Table 2).
Effect of octreotide on proliferation. Exponentially growing cells from stock cultures were seeded at a concentration of 4 × 10⁵ cells/mL and incubated for 48 hours with different concentrations of octreotide. Cells were harvested and total and viable cells were counted using Trypan blue exclusion to determine viability. Experiments were set up in triplicates. One of at least three experiments performed in triplicate is shown. Each point represents the mean ± SEM. (A) IL-6–independent MM cell lines: ( ) LP-1, (◊) EJM, (○) Karpas 707, (▵) HL407L, (⊞) U-266-1984. (B) IL-6–dependent cell lines: (□) U-1958, (◊) HL407E, (○) U-266-1970.
Effect of octreotide on proliferation. Exponentially growing cells from stock cultures were seeded at a concentration of 4 × 10⁵ cells/mL and incubated for 48 hours with different concentrations of octreotide. Cells were harvested and total and viable cells were counted using Trypan blue exclusion to determine viability. Experiments were set up in triplicates. One of at least three experiments performed in triplicate is shown. Each point represents the mean ± SEM. (A) IL-6–independent MM cell lines: ( ) LP-1, (◊) EJM, (○) Karpas 707, (▵) HL407L, (⊞) U-266-1984. (B) IL-6–dependent cell lines: (□) U-1958, (◊) HL407E, (○) U-266-1970.
Effect of Octreotide on Survival in MM Cell Lines
| . | Cell Line . | Viability (%) . | Annexin†/PI− Cells (%) . | ||
|---|---|---|---|---|---|
| 0 mol/L Octreotide . | 10−6 mol/L Octreotide . | 0 mol/L Octreotide . | 10−6 mol/L Octreotide . | ||
| IL-6–independent | LP-1 | 97 | 94 | ND | ND |
| EJM | 90 | 89 | ND | ND | |
| Karpas 707 | 94 | 94 | ND | ND | |
| HL407L | 80 | 72 | 8 | 11 | |
| U-266-1984 | 93 | 91 | ND | ND | |
| IL-6–dependent | U-1958 | 81 | 72 | 7 | 11 |
| HL407E | 80 | 65 | 8 | 14 | |
| U-266-1970 | 95 | 95 | ND | ND | |
Data on viability are extracted from experiments also shown in Fig4. Values are means of triplicate determinations from a representative experiment. For the apoptosis assay, cells were cultured without or with 10−6 mol/L octreotide for 48 hours, harvested, and incubated with fluorescein-conjugated annexin V and PI and analyzed in a FACScan. Values represent the percentage of cells that were annexin V–positive/PI-negative.
Abbreviation: ND, not done.
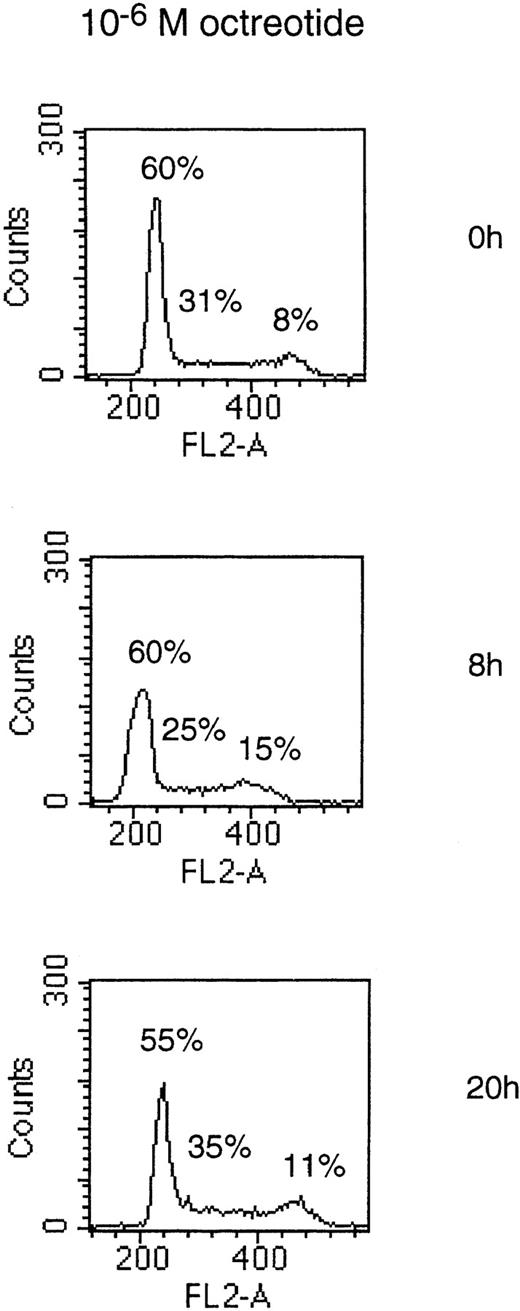
To determine if the growth-inhibitory effect of octreotide was due to a cell cycle block in MM cells, we performed PI staining of cell nuclei. Cells of the LP-1 and HL407L cell lines were incubated without or with octreotide (10−6 mol/L). Figure5, depicting the cell cycle distribution of the LP-1 cell line after treatment with octreotide, shows a small and transient accumulation of cells in the G2/M phase of the cell cycle. The accumulation of cells in G2/M was seen at 8 hours, but at 20 hours, the effect was no longer detectable. In the HL407L cell line, essentially the same effect of octreotide could be shown (data not shown).
Cell cycle distribution of the LP-1 cell line treated with octreotide. Exponentially growing cells were seeded at 4 × 10⁵ cells/mL and incubated for 8 and 20 hours without or with 10−6 mol/L octreotide. Cells were harvested and cell nuclei were prepared, stained with PI, and DNA content analyzed in a FACScan.
Cell cycle distribution of the LP-1 cell line treated with octreotide. Exponentially growing cells were seeded at 4 × 10⁵ cells/mL and incubated for 8 and 20 hours without or with 10−6 mol/L octreotide. Cells were harvested and cell nuclei were prepared, stained with PI, and DNA content analyzed in a FACScan.
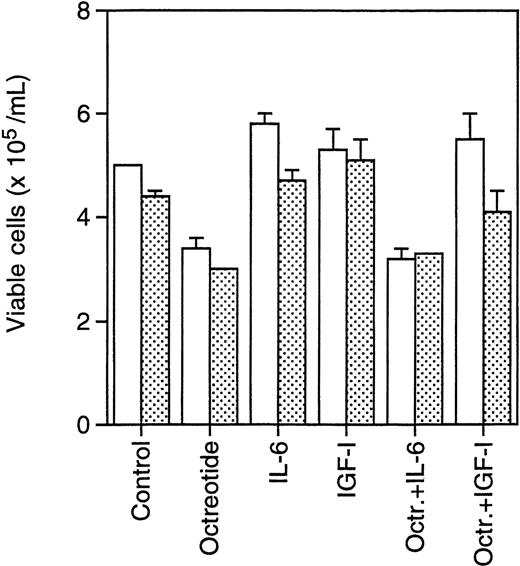
Primary B-B4+ plasma cells from two MM patients were incubated with octreotide (10−8 mol/L) to determine survival of these nondividing cells. As indicated in Fig6, primary cells were incubated with octreotide in the absence or presence of IL-6 (100 U/mL) or IGF-I (10−7 mol/L) to investigate whether the effect of octreotide could be inhibited by these factors. After 24 hours of incubation, the cells were counted using Trypan blue exclusion to determine viability. The dead cells displayed a typical apoptotic morphology with condensed chromatin and karyorrhexis. The results show that octreotide induces apoptosis in primary B-B4+ cells. Furthermore, IGF-I, but not IL-6, could inhibit the effect of octreotide (Fig 6).
Effect of octreotide on survival of primary isolated B-B4+ plasma cells. Cells were seeded at 6 × 10⁵ cells/mL, incubated for 24 hours, and counted. Octreotide (10−8 mol/L), IL-6 (100 U/mL), and IGF-I (10−7 mol/L) were added as indicated. (□) Patient sample 1; () patient sample 2.
Effect of octreotide on survival of primary isolated B-B4+ plasma cells. Cells were seeded at 6 × 10⁵ cells/mL, incubated for 24 hours, and counted. Octreotide (10−8 mol/L), IL-6 (100 U/mL), and IGF-I (10−7 mol/L) were added as indicated. (□) Patient sample 1; () patient sample 2.
DISCUSSION
Somatostatin and its analogs inhibit growth of several types of tumor cells in vitro, eg, breast and prostate cancer cells.40 41Several mechanisms have been suggested by which somatostatin and octreotide might inhibit the growth of tumor cells. One pathway is by interfering with IGF-IR signaling.
We and others have previously reported that IGF-I is a growth and/or survival factor for many MM cell lines.3 4The fact that octreotide can interfere with IGF-I signaling prompted us to investigate the role of octreotide as a growth and survival regulator in MM cells.
We used a receptor-binding assay, PCR, and flow cytometry to investigate the expression of sst in the MM cell lines. All cell lines showed specific 125I-somatostatin binding, but a wide range in the level of binding was found. The level of sst expression can be influenced by several factors. Earlier studies on normal lymphocytes have shown that when resting lymphocytes are activated a new set of high-affinity sst are expressed.17 In lymph nodes, sst can only be identified on germinal center lymphocytes, also linking sst expression to activation/proliferation.42 The sst expression on normal plasma cells has not been determined. Our results show a correlation between sst expression and population doubling time in the MM cell lines. Interestingly, during the in vitro progression, the U-266 and HL407 cell lines have acquired a higher growth rate, they are less prone to undergo apoptosis, and they have become independent of IL-6.27,28 Our study shows that these cell lines have also downregulated the expression of sst. It is possible that there is a Darwinian selection for tumor cells with lower levels of sst expression. Accordingly, in studies of pancreas cancer cells, progression has been associated with loss of sst2. Transfection of such sst deficient cells with sst2 results in lower growth rate and block of the capacity for colony formation in soft agar.43
The reports of sst subtype mRNA expression in lymphocytes are limited. However, Reubi et al reported variable expression of sst2and sst3 in several lymphomas,44 while the sst5 expression was not investigated. In some B- and T-cell lines, Tsutsumi et al found expression of sst2 and in a few cases a weak expression of sst3 and sst5.25 In this study, we found expression of sst2, sst3, and sst5 mRNA in all MM cell lines. We also show cell-surface expression of sst2, sst3, and sst5 in all MM cell lines. sst5 was the predominant subtype, except on the LP-1 and the HL407L cell lines, where the three subtypes were expressed at similar levels. There are no previous reports of cell-surface expression of sst subtypes on MM cells or other lymphocytes and the relative importance of the different sst subtypes in transmitting the growth-inhibitory signal of octreotide is unclear. In several studies, antiproliferative effects of octreotide have been linked to expression of sst2, but in some cases, antiproliferative effects have also been reported to be mediated by sst5.22,45Furthermore, a recent study reported that octreotide could induce apoptosis in a p53-dependent manner by way of sst3.46 Further studies are therefore needed before any conclusions can be drawn from the different levels of subtype expression on MM cells. However, we have preliminary data showing that resting PBL have a very low expression of sst2, sst3, and sst5 on the cell surface compared with the MM cell lines, again linking sst expression to activation/proliferation.
To elucidate the effect of octreotide on the growth of MM cell lines, the cells were cultured with different concentrations of octreotide for 48 hours. The growth of all MM cell lines was inhibited by 25% to 45% compared with the exponentially growing control cells. We also investigated the effect of octreotide on the growth of an acute lymphoblastic leukemia cell line (KM3), a Burkitt lymphoma cell line (Mutu) and a lymphoblastoid cell line (I83.4). These cell lines were not growth inhibited by octreotide (data not shown). Native somatostatin had the same effect as octreotide, but had to be replenished every 12 hours, probably due to a short half-life in the cell cultures. The viability of the cells was not changed except in the U-1958, HL407E, and HL407L cell lines, where viability decreased by 8% to 15% in the octreotide-treated cells. Using annexin V/PI staining, we found that this decrease in viability was associated with a small increase in the number of annexin V–positive/PI-negative, apoptotic cells. Taken together, octreotide mainly exerts a cytostatic effect on the MM cells.
Cell cycle analysis showed a small and transient accumulation of cells in the G2/M phase of the cell cycle. This is consistent with an earlier study of the effect of octreotide on the cell cycle in a breast cancer cell line (MCF-7), which also showed a small and transient accumulation of cells in the G2/M phase of the cell cycle after octreotide treatment.47 However, it is unlikely that the block in G2/M can explain the growth-inhibitory effect of octreotide, but it is conceivable that all phases of the cell cycle are prolonged in octreotide-treated cells. Baserga et al recently showed that cells lacking the IGF-IR have longer population doubling times, and that all phases of the cell cycle are prolonged.48
As to the mechanism of octreotide-induced growth inhibition, previous reports suggest downregulation of IGF-I expression, upregulation of inhibitory IGF-I–binding protein expression, and inhibition of IGF-IR signaling as candidate mechanisms. We are currently investigating the possibility that one or several of these mechanisms are involved in the growth-inhibitory effect of octreotide in MM.
Primary B-B4+ cells from patients with MM have a very low or nonexistent proliferative activity in vitro, and during the course of a few days time they continuously die when kept in culture, as shown by Gu et al49 and Georgii-Hemming et al (unpublished data, December 1997). The possible biologic effect of octreotide on MM cells can therefore not be recorded by a proliferation-inhibition assay as for the MM cell lines. Interestingly, the analysis of survival in cultures of freshly isolated MM cells indicates that octreotide may act as an inducer of apoptosis in these cells. IGF-I, but not IL-6, could inhibit the effect of octreotide. However, considering the heterogeneity in MM, these data must be interpreted cautiously. Another reason for caution is that only selected cases of patient MM bone marrow with high numbers of B-B4+ cells can be analyzed due to technical limitations of the isolation protocol and the subsequent cell survival assay. For these reasons, further studies will be required to allow any conclusions to be drawn as to the relevance of these in vitro data for the in vivo situation. The effect of IL-6 and IGF-I on octreotide-induced growth inhibition was also studied in the U-266-1970 and Karpas 707 cell lines. As in the primary cells IGF-I, but not IL-6, could inhibit octreotide-induced growth inhibition (data not shown).
In time-course experiments, we found that the inhibitory effect of octreotide was maximal after 48 hours, while after 72 hours, the difference between octreotide-treated cells and controls diminished (data not shown). The effect of octreotide could be prolonged by replenishing octreotide every 24 hours, but eventually a decline in the growth-inhibitory effect was seen. As reported by Hukovic et al,50 this could be due to a densitization of sst. An alternative explanation for a diminished effect over time is that an octreotide-resistant subpopulation eventually takes over the cell cultures.
The potential therapeutic usefulness of octreotide will depend on several factors, which must be subject to further studies. The diminished effect in long-term cultures, which may reduce the clinical relevance of our findings, must be understood and circumvented. The effectiveness of combinations with other drugs will also have to be addressed, since octreotide has been reported to amplify the effect of drugs like doxorubicin.51 Furthermore, combination treatment with octreotide and IFN-α has been used in carcinoid tumors with encouraging results and this combination might also be of therapeutic interest for MM patients.52 Apart from the mechanisms already mentioned, octreotide have indirect effects on tumor growth by downregulation of IGF-I in the circulation and by inhibition of angiogenesis.53 54 In conclusion, studies of the effect of octreotide in vivo are clearly warranted.
In this work, we have pointed to a new way to inhibit growth of MM cell lines; activation of sst. Future studies will focus on the effect of octreotide in vivo and its potential therapeutic usefulness.
Supported by grants from the Swedish Cancer Society.
The publication costs of this article were defrayed in part by page charge payment. This article must therefore be hereby marked “advertisement” in accordance with 18 U.S.C. section 1734 solely to indicate this fact.
REFERENCES
Author notes
Address reprint requests to Kenneth Nilsson, MD, PhD, Laboratory of Tumor Biology, Department of Genetics and Pathology, University Hospital, S-751 85 Uppsala, Sweden.


This feature is available to Subscribers Only
Sign In or Create an Account Close Modal