In multiple myeloma (MM), the cell surface protein, CD19, is specifically lost while it continues to be expressed on normal plasma cells. To examine the biological significance of loss of CD19 in human myeloma, we have generated CD19 transfectants of a tumorigenic human myeloma cell line (KMS-5). The CD19 transfectants showed slower growth rate in vitro than that of control transfectants. They also showed a lower capability for colony formation as evaluated by anchorage-independent growth in soft agar assay. The CD19 transfectants also had reduced tumorigenicity in vivo when subcutaneously implanted into severe combined immunodeficiency (SCID)-human interleukin-6 (hIL-6) transgenic mice. The growth-inhibitory effect was CD19-specific and probably due to CD19 signaling because this effect was not observed in cells transfected with a truncated form of CD19 that lacks the cytoplasmic signaling domain. The in vitro growth-inhibitory effect was confirmed in a nontumorigenic human myeloma cell line (U-266). However, introduction of the CD19 gene into a human erythroleukemia cell line (K-562) also induced growth inhibition, suggesting that this effect is CD19-specific, but not restricted to myeloma cells. These data suggest that the specific and generalized loss of CD19 in human myeloma cells could be an important factor contributing to the proliferation of the malignant plasma cell clones in this disease.
HUMAN MULTIPLE MYELOMA (MM) is a proliferative disorder of monoclonal plasma cells, which accumulate in the bone marrow. The origin of the malignant clones in MM is still controversial despite many efforts to identify the MM stem cell.1 Recently, phenotypic analysis has been used as a valuable method in the diagnosis and prognosis of MM. One of the surface molecules that distinguish normal plasma cells from myeloma cells is the B-cell marker, CD19. We have reported that normal plasma cells express CD19, in contrast to primary myeloma cells and cell lines that are CD19−.2 We have also demonstrated that the Pax-5 gene, which positively controls CD19 gene expression, was expressed in normal plasma cells, but not in myeloma cells and cell lines.3 However, the significance of loss of CD19 expression in human myeloma plasma cells is unclear.
The CD19 molecule is a 95-kD cell surface glycoprotein expressed on the surface of B lymphocytes.4 Its extracellular portion contains Ig-like domains and an Epstein-Barr virus-related cytoplasmic tail,5,6 and the cytoplasmic domain is highly conserved between human, mouse, and guinea pig.7 CD19 is a key molecule in the B-lymphocyte signal transduction complex, where it associates noncovalently with the complement receptor type 2 (CR2) CD21,8 CD81 (TAPA-1), and Leu-13.9
Targeted disruption of the CD19 gene in mice showed its importance in T-cell–dependent antigen responses10 and B-cell memory.11 CD19 can act as both a positive and negative regulator of B-cell proliferation depending on the stimulating signal.12 When coligated to the B-cell antigen receptor (surface Ig [sIg]), CD19 lowers the threshold for antigen receptor stimulation of B lymphocytes.13 CD19 has also been linked to several related signal transduction pathways including the activation of phospholipase C-γ-1 (PLC-γ-1)14 and phosphoinositol-3 kinase (PI3-K).15 Recently, it has been shown that 2 major signals emerging from PI3-K can target protein kinase B (PKB; also known as Akt) and mitogen-activated protein kinase (MAPK).16 Tyrosine phosphorylated CD19 interacts with src-homolgy-2 (SH-2) domain-containing proteins linking it to intracellular signaling pathways.17 CD19 molecules phosphorylated at tyrosine-391 bind the proto-oncogene product Vav, which contains an SH-2 domain, to mediate an increase in intracellular Ca2+, activation of phosphatidylinositol 4-phosphate 5-kinase, and the c-Jun-N-terminal kinase (JNK), thus linking 2 distinct signaling pathways of lipid and protein kinases.18
Because CD19 can act as a positive or negative regulator in B-cell signaling and because it is lost in MM plasma cell, we examined the pathophysiologic effect and significance of loss of CD19 expression in human myeloma by generating CD19 transfectants of 2 myeloma cell lines. We studied the biological characteristics of CD19 transfected cells in comparison to both neo-control transfectants and transfectants expressing a truncated form of the molecule that lacks the cytoplasmic domain. The possible biological role of loss of CD19 in the proliferation of plasma cells in MM is discussed.
MATERIALS AND METHODS
Cell culture.
The tumorigenic KMS-519 and the nontumorigenic U-26620 human myeloma cell lines and the human erythroleukemia cell line K-562 were maintained in RPMI-1640 (Nissui, Tokyo, Japan) supplemented with 10% fetal calf serum (FCS; M.A. Bioproducts, Walkersville, MD). Growth curves of U-266 were performed in the presence or absence of exogenous recombinant human interleukin-6 (rhIL-6; 2 ng/mL). For cell culture experiments in serum-free medium, we used AlbuMAX (200 μg/mL), bovine insulin (2 μg/mL), and human transferrin (2 μg/mL; all purchased from GIBCO BRL, Grand Island, NY).
Plasmid construction.
Full-length CD19 cDNA was cloned by reverse transcriptase-polymerase chain reaction (RT-PCR) from the human Burkitt’s lymphoma cell line (Raji) using primers CD19 F1 and CD19 R1 described below. The cloned PCR product was directly ligated into the TA vector pCR-TOPO (Invitrogen, San Diego, CA) to give pCR-CD19. A truncated form of CD19, which has only the extracellular and transmembrane domains, but lacks the cytoplasmic domain, was amplified by PCR from pCR-CD19 using primers CD19 F1 and CD19 R2 described below and directly cloned to the TA-vector to give pCR-ΔCD19 (Fig 1A). Both cDNA inserts in pCR-CD19 and pCR-ΔCD19 were sequenced by the dyedeoxy termination method using (ABI PRISM) dye terminator cycle sequencing ready reaction kit (Perkin Elmer, Applied Biosystems Division, Foster City, CA) according to the manufacturer’s instructions. The cloned cDNA fragments were then eluted and subcloned into theEcoRI site of the mammalian expression vector pCI-neo (Promega, Madison, WI) driven by cytomegalovirus (CMV) immediate early enhancer/promoter to give pCI-CD19 (full-length) and pCI-ΔCD19 (truncated form). The orientation of the inserts in the expression vector was verified by Xho I restriction for the full-length construct and Sma I for the truncated form (pCI-ΔCD19).
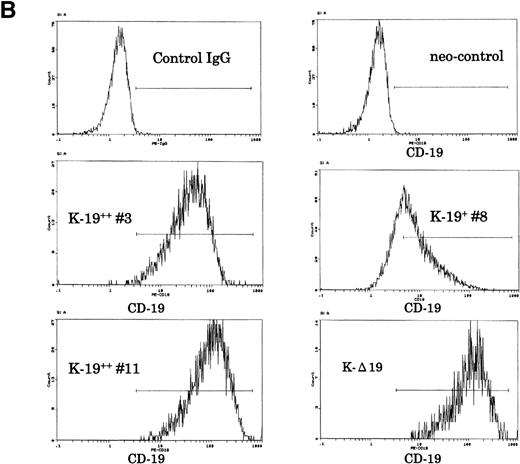
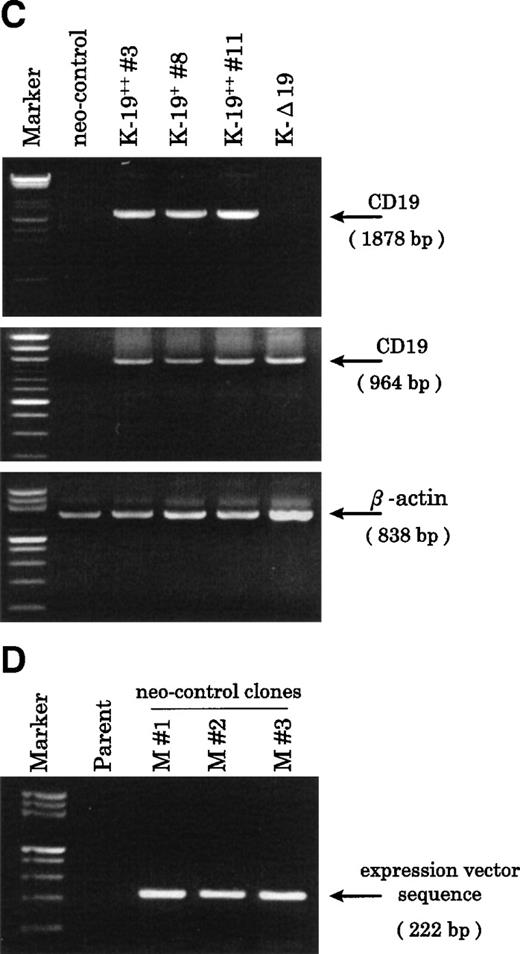
Establishment of K-19+ myeloma cell clones. (A) Schematic representation of the mammalian expression vectors pCI-CD19 and pCI-▵19. CMV, cytomegalovirus immediate early enhancer/promoter; Int, chimeric intron; ED, TM, and CD, extracellular, transmembrane, and cytoplasmic domains of CD19, respectively; Poly(A), SV40 late polyadenylation signal; the arrows indicate the positions of pCI-neo specific primers pCIF and pCIR. (B) Single color flow cytometric analysis with PE-labeled mouse antihuman IgG as a negative control (control IgG) and PE-labeled CD19 antibody showing the expression level of the CD19 transgene on different clones. (C) RT-PCR amplification of mRNA from K-19+ and K-▵19 clones using full-length CD19F1 and CD19R1 primers (top) or truncated form CD19 F1 and CD19R2 primers (middle). (D) PCR amplification of genomic DNA from the parental cell line, KMS-5, and neo-control clones (M nos. 1, 2, and 3).
Establishment of K-19+ myeloma cell clones. (A) Schematic representation of the mammalian expression vectors pCI-CD19 and pCI-▵19. CMV, cytomegalovirus immediate early enhancer/promoter; Int, chimeric intron; ED, TM, and CD, extracellular, transmembrane, and cytoplasmic domains of CD19, respectively; Poly(A), SV40 late polyadenylation signal; the arrows indicate the positions of pCI-neo specific primers pCIF and pCIR. (B) Single color flow cytometric analysis with PE-labeled mouse antihuman IgG as a negative control (control IgG) and PE-labeled CD19 antibody showing the expression level of the CD19 transgene on different clones. (C) RT-PCR amplification of mRNA from K-19+ and K-▵19 clones using full-length CD19F1 and CD19R1 primers (top) or truncated form CD19 F1 and CD19R2 primers (middle). (D) PCR amplification of genomic DNA from the parental cell line, KMS-5, and neo-control clones (M nos. 1, 2, and 3).
Stable transfection and cloning.
The human CD19− KMS-5 myeloma cell line was transfected by pCI-neo vector (neo-control), pCI-CD19 (K-19+), or pCI-ΔCD19 (K-Δ19) by lipofection. Cells were plated at 3 × 10⁵ in 6-well plates overnight, and on the following day, cells were washed in serum-free medium and transfected by a mixture of 5 μg DNA and 20 μg lipofectin (GIBCO BRL) and incubated at 37°C with 5% CO2. After 10 hours of incubation, complete medium with 10% FCS was added and incubation was continued for a total of 72 hours. Transfected cells were then diluted 1:10 in medium and selected in geniticin (GIBCO BRL) at 500 μg/mL. By 8 weeks, resistant clones started to appear, and subcloning was performed at least twice to obtain single-cell clones by limiting dilution in 96-well plates. The K-562 erythroleukemia cell line was transfected by lipofection in an identical manner. The cells were selected in 1 mg/mL geniticin. The U-266 human myeloma cell line was transfected by electroporation of 3 × 10⁷ cells with 300 μg of each recombinant plasmid in 600 μL of Hank’s buffered solution. Electroporation was performed by the Gene Pulser (Bio-Rad Laboratories, Tokyo, Japan) at 210 V and 1,440 μF capacitance, followed by selection in medium containing 1 mg/mL geniticin. Transfected U-266 and K-562 expressing the surface CD19 were sorted after 2 weeks of selection, maintained in selection medium, and subsequently used for experiments.
Antibodies and flow cytometry.
Cells were harvested and stained with either phycoerythrin (PE)-labeled anti-IgG isotypic control or PE-labeled anti-CD19 (Coulter, Hialeah, FL) as described previously21and were analyzed by the cell sorter (Epics Elite ESP; Coulter).
Extraction of mRNA from transfected cells.
mRNA was extracted by oligo-dT latex beads (Oligotex-dT30; Takara, Kyoto, Japan) according to the manufacturer’s instructions. Isolated mRNA was reverse transcribed at 37°C for 60 minutes in a reaction mixture containing 100 pmol/L random hexamer (Pharmacia Biotech, Tokyo, Japan), 0.5 mmol/L each deoxynucleotide-5-triphosphate (dNTPs), RT buffer (50 mmol/L Tris-HCl, pH 8.8, 7.5 mmol/L KCl, 3 mmol/L MgCl2), 10 mmol/L dithiothreitol (DTT), 20 U of human placental ribonuclease inhibitor (Takara), and 20 U of reverse transcriptase Superscript II (GIBCO BRL, Gaithersburg, MD).
PCR.
Full-length CD19 cDNA was amplified by RT-PCR using primers designed according to the published sequence5 as follows: CD19 F1: 5′-GGA GAG TCT GAC CAC CAT GCC ACC T-3′ (nucleotides 1-25) and CD19 R1: 5′-AAG GGG ACT GGA AGT GTC ACT GGC AT-3′ (nucleotides 1878-1853). The truncated construct was amplified from pCI-CD19 using primers CD19 F1 and CD19 R2: 5′-GGC TCT TTG AAG ATG AAG AAT GCC CAC-3′ (nucleotides 964-938). For detection of integration of the pCI-neo into the genome of mock transfectants, the following pCI-neo vector specific primers (see Fig 1A) were used to amplify a 222-bp fragment from genomic DNA; pCIF: 5′-ATC CAC TTT GCC TTT CTC TCC ACA-3′ (nucleotides 998-1021), and pCIR: 5′-CTG CAT TCT AGT TGT GGT TTG TCC-3′ (nucleotides 1219-1146). PCR cloning of the full-length CD19 was performed in a 2-step cycle of 94°C for 30 seconds denaturation and 72°C annealing/extension for 4 minutes (7 cycles), followed by 32 cycles of denaturation at 94°C for 30 seconds and annealing/extension at 67°C for 4 minutes with rTth (Perkin Elmer) and Vent (New England Biolabs, Beverly, MA) mixture of DNA polymerases and a manual hot start by AmpliWax (Perkin Elmer). Thermal cycling for the pCI-neo sequences was performed by rTaq (Takara) at 94°C denaturation for 1 minute, annealing at 65°C for 1 minute, and extension at 72°C for 1 minute. The truncated fragment was amplified using the same conditions except for annealing at 57°C for 1 minute.
Colony assay.
Soft agar (1.6% wt/vol) was prepared by autoclaving Bacto-agar (DIFCO, Detroit, MI) in distilled water just before use. The bottom agar layer (2.1 mL/well) contained 1.6% agar:2× RPMI/20% FCS:1× RPMI/10% FCS without cells in a volume ratio of 1:1:1, respectively, as a final agar concentration of 0.53%. The top agar layer (0.9 mL/well) contained 1.6% agar:2× RPMI/20% FCS:1× RPMI/10% FCS with cells in a ratio 1:1:2, respectively, with a final agar concentration of 0.4%. The number of cells plated for each clone was 5 × 10²/mL or 5 × 10³/mL. Plates were incubated at 37°C with 5% CO2 for 2 weeks and the colonies were counted and photographed under a phase contrast microscope (Nikon, Tokyo, Japan).
In vivo growth and tumorigenicity.
Severe combined immunodeficiency (SCID)-hIL-6 transgenic mice22 provided by Chugai Pharmaceutical Co, Ltd (Shizuoka, Japan) were used for experiments between 4 to 6 weeks after birth. The tumorigenic KMS-5 transfectants (K-19+ and neo-control cells) were harvested (5 × 10⁶), suspended in 200 μL phosphate-buffered saline (PBS), and subcutaneously inoculated into the flanks or the back of the mice on the same day. Mice were observed for tumor formation every 4 days. After 5 weeks, mice were killed, tumor was resected, and its growth was evaluated by volume according to the formula: 1/2ab2 (in microliters), where “a” is the longest and “b” is the shortest axes of the tumor. Statistical analysis was performed by the Student’s t-test (n = 5 for each clone). This experiment was reviewed by the Committee of the Ethics on Animal Experiment in Yamaguchi University School of Medicine and performed under the control of the Guideline for Animal Experiment in Yamaguchi University School of Medicine and The Law (No. 105) and Notification (No. 6) of the Government.
RESULTS
Establishment of KMS-5 myeloma cell line clones stably expressing CD19 (K-19 cells).
To characterize the transfected cells and confirm the expression of the CD19 transgene, we used flow cytometry to screen clones obtained by limiting dilution. Twenty-seven single-cell clones expressing variable levels of surface CD19 were identified, and of those, 3 representative clones were further identified and examined. One clone that expressed low-level CD19 (K-19+ clone #8) and 2 clones expressing high levels (K-19++ clones #3 and #11) were used for the following experiments. We also characterized another clone that expressed high levels of truncated CD19 (K-Δ19) on its surface (Fig 1B). The mRNA expression of the transgenes was examined by RT-PCR. Amplification of reverse transcribed mRNA using the CD19 F1 and CD19 R1 primer pair produced a single band of the expected length from K-19+ cells, but not from K-Δ19 or neo-control transfected cells (Fig 1C, top). On the other hand, CD19 F1 and CD19 R2 primers produced amplification products from all clones except neo-control transfected cells (Fig 1C, middle). Neo-control transfected cells were also cloned by limiting dilution to isolate single-cell clones. The integration of the expression vector into the genome of 3 independent neo-control transfectants (M no. 1, M no. 2, and M no. 3) was verified by amplifying genomic DNA using vector specific primers from 3 mock clones, but not from the KMS-5 parent cells (Fig 1D). These data show the expression of varying levels of CD19 in stably transfected clones.
CD19 expression in myeloma cells confers a negative growth regulatory effect in vitro.
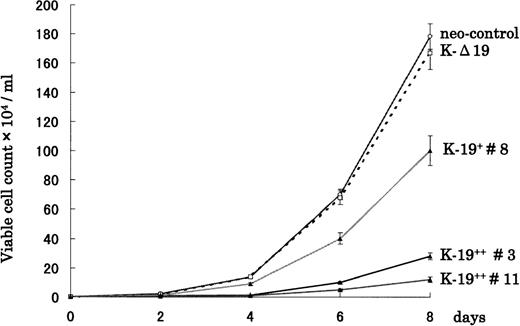
To examine the biological effects of CD19 expression on myeloma cells, we first evaluated the growth rate of transfected clones cultured in RPMI 1640 supplemented with 10% FCS. Interestingly, K-19+clones showed slower growth rate compared with either neo-control or K-Δ19 cells (Fig 2). Moreover, the growth-inhibitory effect seemed to be related to the level of CD19 expression. High CD19 expression (clones #3 and #11) was associated with markedly slower growth, and low expression (clone #8) was associated with less marked growth inhibition. Three neo-control clones (M no. 1, M no. 2, and M no. 3) that we used in our experiments had an almost identical growth pattern. The growth rate of neo-control clones and K-Δ19 cells was almost identical. These data show that CD19 appears to exert a growth-inhibitory effect on myeloma cells in an expression level-dependent manner. These effects are likely related to intracellular signaling through CD19, because they were not observed in the truncated CD19 transfectants or in neo-control clones.
CD19 expression in KMS-5 human myeloma cell line leads to growth inhibition in vitro. K-19+, K-▵19, and neo-control clones were adjusted to 1 × 10³/mL and plated in RPMI 1640 + 10% FCS. Cells were harvested and counted at the indicated time points both automatically on the cell sorter and manually on a hemocytometer. Data from 3 experiments are shown as mean ± standard deviation (SD).
CD19 expression in KMS-5 human myeloma cell line leads to growth inhibition in vitro. K-19+, K-▵19, and neo-control clones were adjusted to 1 × 10³/mL and plated in RPMI 1640 + 10% FCS. Cells were harvested and counted at the indicated time points both automatically on the cell sorter and manually on a hemocytometer. Data from 3 experiments are shown as mean ± standard deviation (SD).
CD19 expression in KMS-5 myeloma cell line is associated with reduced colony formation.
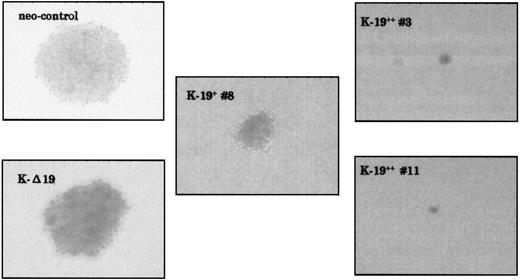
Another biological feature of malignant cells that we have investigated is anchorage-independent growth capability. As evaluated by soft agar colony assay, K-19+ cells showed markedly lower capability for colony formation. Plating 5 × 10² cells/mL in triplicate experiments, both neo-control and K-Δ19 cells formed at least 3 large colonies in each well after 2 weeks, whereas K-19+ cells formed lower numbers of smaller colonies (Fig 3 and Table 1). Low CD19 expression clone (K-19+ #8) formed 2 small colonies in only 1 well, and high CD19 expression clones (K-19++ #3 and #11) did not form any colonies, even when the cultures were kept for a longer incubation period. Increasing the number of plated cells to 5 × 10³ cells/mL also showed a lower capability for colony formation by K-19+ clones compared with neo-control clones (Table 1). These data show that the expression of CD19 in myeloma cells resulted in reduced capacity for anchorage-independent growth. The level of this inhibitory effect appears to be well-correlated with the level of CD19 expression in myeloma cells.
CD19-expressing KMS-5 cells have lower capacity for colony formation. The indicated clones were plated in soft agar at 5 × 10²/mL or 5 × 10³/mL in triplicates in 6-well plates and incubated at 37°C and 5% CO2. Two weeks later, the colonies were counted and photographed under a phase contrast microscope.
CD19-expressing KMS-5 cells have lower capacity for colony formation. The indicated clones were plated in soft agar at 5 × 10²/mL or 5 × 10³/mL in triplicates in 6-well plates and incubated at 37°C and 5% CO2. Two weeks later, the colonies were counted and photographed under a phase contrast microscope.
Anchorage-Independent Growth of K-19+Cells in Soft Agar
| . | No. of Colonies (5 × 10² cells/mL) . | No. of Colonies (5 × 10³ cells/mL) . |
|---|---|---|
| Neo-control | 4 ± 1 | 27 ± 3 |
| K-Δ 19 | 3 ± 1 | ND |
| K-19+ #8 | 2 ± 0* | 13 ± 1 |
| K-19++ #3 | 0† | 5 ± 2 |
| K-19++ #11 | 0 | ND |
| . | No. of Colonies (5 × 10² cells/mL) . | No. of Colonies (5 × 10³ cells/mL) . |
|---|---|---|
| Neo-control | 4 ± 1 | 27 ± 3 |
| K-Δ 19 | 3 ± 1 | ND |
| K-19+ #8 | 2 ± 0* | 13 ± 1 |
| K-19++ #3 | 0† | 5 ± 2 |
| K-19++ #11 | 0 | ND |
Cells were plated in 6-well plates of soft agar and the number of colonies was determined after 2 weeks of culture. The mean values ± SD from triplicate experiments are shown.
Abbreviation: ND, not determined.
Two small colonies appeared in only 1 well.
A very small colony of not more than 4 cells appeared in only 1 of triplicate wells.
CD19 exerts its growth-inhibitory effect on K-19 myeloma cells in vivo.
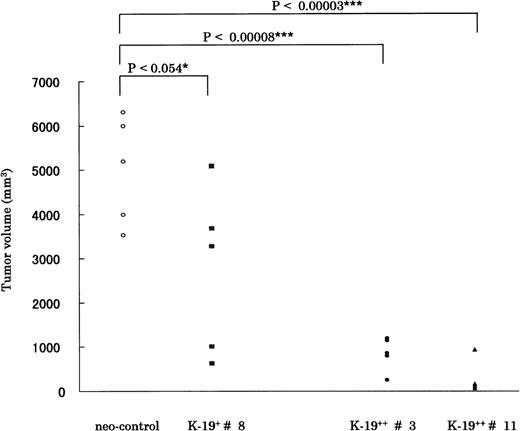
We next tried to verify if CD19 exerts a similar growth inhibitory effect in vivo by subcutaneous inoculation of CD19 transfectants in SCID-hIL-6 transgenic mice. Mice were observed for tumor formation every 4 days. The earliest observed tumors appeared after 17 days in mice injected with neo-control clones. After 5 weeks, mice were killed, and the tumor was resected and evaluated according to the equation described in Materials and Methods. The time required for tumor formation and the tumor volume correlated well with the in vitro growth characteristics of the different K-19+ clones. The clones expressing CD19 formed tumors at least 1 week (K-19+ #8) or more (K-19++ #3 and #11) slower than neo-control clones. Also, the tumor volume of K-19+ clones was significantly smaller than that of mock clones. The statistical data are drawn from 5 animals injected with each clone, and the P value is shown above the horizontal bars (Fig 4). When K-19+ clones (K-19+ #8, K-19++ #3, and #11) were compared with each other, there was significant difference between them, specifically between clone #8, expressing low-level CD19, and the high expression clones #3 and #11. These in vivo data support and confirm the in vitro observations of the growth-inhibitory effect of CD19 in myeloma cells. It also shows that the level of expression of CD19 correlates with the growth inhibitory effect.
CD19 exerts its growth-inhibitory on KMS-5 in vivo. A total of 5 × 10⁶ cells of each clone was inoculated subcutaneously in SCID-hIL-6 transgenic mice. After 5 weeks mice, were killed and tumors resected and measured as described in Materials and Methods. The statistical data are drawn from 5 animals injected with each clone, and the P value is shown above the horizontal bars. The mean ± SD values for each group were as follows: neo-control (5,007 ± 1,212); K-19+ #8 (2,756 ± 1,877); K-19++ #3 (854 ± 375); and K-19++ #11 (269 ± 336). Each point represents 1 animal.
CD19 exerts its growth-inhibitory on KMS-5 in vivo. A total of 5 × 10⁶ cells of each clone was inoculated subcutaneously in SCID-hIL-6 transgenic mice. After 5 weeks mice, were killed and tumors resected and measured as described in Materials and Methods. The statistical data are drawn from 5 animals injected with each clone, and the P value is shown above the horizontal bars. The mean ± SD values for each group were as follows: neo-control (5,007 ± 1,212); K-19+ #8 (2,756 ± 1,877); K-19++ #3 (854 ± 375); and K-19++ #11 (269 ± 336). Each point represents 1 animal.
The in vitro growth-inhibitory effect of CD19 is observed in another myeloma (U-266) and nonmyeloma (K-562) cell lines.
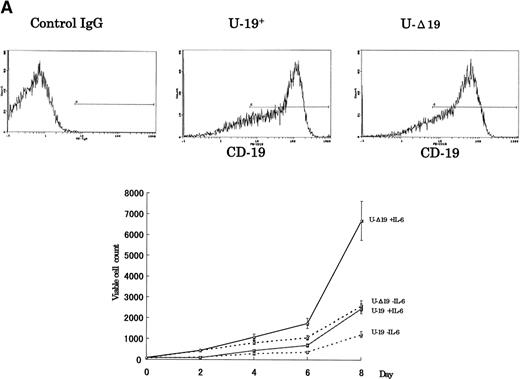
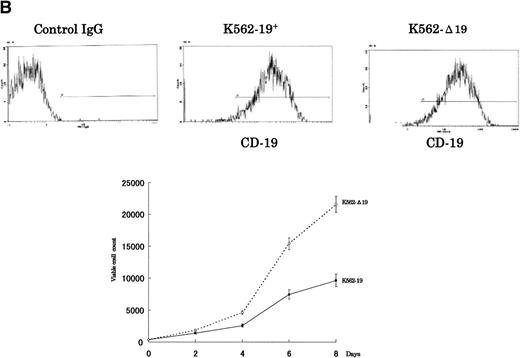
To verify whether the growth-inhibitory effect of CD19 is specific to myeloma cells, we have used 2 cell lines, U-266 nontumorigenic myeloma cell line and K-562 human erythroleukemia cell line, to express the intact and truncated forms of CD19. Because the U-266 cells proliferate in response to exogenous IL-6, we have tested these cells both in the presence and absence of exogenous rhIL-6 (2 ng/mL). Intact CD19 induced growth inhibition in U-266 cell line both in the presence or absence of exogenous IL-6 (Fig 5A). However, this growth-inhibitory effect was also observed in K-562 (Fig 5B). Taken together, these data further support the observation of the growth-inhibitory effect exerted by CD19 and suggest that this effect is not restricted to myeloma or B-lineage cells.
The growth-inhibitory effect is specific to CD19, but not restricted to myeloma cells. (A) The expression vectors pCI-CD19 and pCI-▵19 were electroporated into the human myeloma cell line, U-266, to generate U-19+ and U-19 cells, respectively, as detected by flow cytometry after staining with PE-labeled anti-CD19 (top). Cells expressing surface CD19 were sorted after 2 weeks of selection in G-418 (1 mg/mL) and used for evaluation of growth pattern (bottom). Data are from 3 independent experiments. The mean ± SD of cell number at each time is shown. (B) The pCI-CD19 and pCI-▵19 vectors were transfected by lipofection into the human erythroleukemia cell line, K-562, to generate K562-19+and K562-19, respectively. After 2 weeks of selection in G-418 (1 mg/mL), surface CD19 expression was confirmed by flow cytometry after staining with PE-labeled anti-CD19 (top), and the in vitro growth curve of these cells is shown as mean ± SD values of cell numbers at the indicated time points (bottom).
The growth-inhibitory effect is specific to CD19, but not restricted to myeloma cells. (A) The expression vectors pCI-CD19 and pCI-▵19 were electroporated into the human myeloma cell line, U-266, to generate U-19+ and U-19 cells, respectively, as detected by flow cytometry after staining with PE-labeled anti-CD19 (top). Cells expressing surface CD19 were sorted after 2 weeks of selection in G-418 (1 mg/mL) and used for evaluation of growth pattern (bottom). Data are from 3 independent experiments. The mean ± SD of cell number at each time is shown. (B) The pCI-CD19 and pCI-▵19 vectors were transfected by lipofection into the human erythroleukemia cell line, K-562, to generate K562-19+and K562-19, respectively. After 2 weeks of selection in G-418 (1 mg/mL), surface CD19 expression was confirmed by flow cytometry after staining with PE-labeled anti-CD19 (top), and the in vitro growth curve of these cells is shown as mean ± SD values of cell numbers at the indicated time points (bottom).
DISCUSSION
An important feature of human MM plasma cells is the specific loss of the B-cell surface protein, CD19, in contrast to normal plasma cells, which do express this molecule.2 The loss of CD19 in human myeloma cells was correlated with the absence of its positive regulatory factor, B-cell–specific activator protein (BSAP), encoded by Pax-5 gene.3 However, the biological significance and the consequences of loss of CD19 in human myeloma has been unclear. In this study, we have generated clones of myeloma cell lines that stably express CD19 and studied the effects of transgene expression on cell growth and tumorigenicity. We observed a striking growth inhibition in cells expressing intact CD19, with the degree of inhibition related to the level of expression of the transgene (Fig 2); high expression clones had slower growth rates. This in vitro growth inhibition was further confirmed by in vivo studies performed by subcutaneous inoculation in SCID-hIL-6 transgenic mice (Fig 4). We observed a good correlation between in vitro and in vivo growth characteristics of the CD19-transfected cells. The parental cell line, KMS-5, is IL-6 independent and rapidly proliferates with a doubling time of less than 2 days.23 This might explain the fact that cell growth was not completely arrested, thus allowing isolation of stable transfectants.
Introduction of intact and truncated CD19 transgenes into another myeloma cell line, U-266, and a myeloid cell line, K-562, confirmed that the growth-inhibitory effect is specific to CD19 (Fig 5). The in vivo effect of CD19 could not be confirmed in U-266 because this line is nontumorigenic. However, these experiments showed that this effect was not specifically restricted to myeloma cells because it could be observed in the erythroleukemia cell line.
Another biological feature clearly modified by the introduction of CD19 into myeloma cells was anchorage-independent growth in soft agar. The number and size of colonies formed by CD19 expressing clones was significantly lower than that of neo-control and truncated CD19 clones (Fig 3 and Table 1). The failure of high expression clones to form colonies in soft agar was not merely due to their slower growth rates, because they did not form colonies even when kept in culture for longer periods. A 10-fold increase in the number of plated cells did not result in marked increase of the number of neo-control colonies, but intact CD19 transfectants could form few small colonies (Table 1). Also, this effect seems to be related to intact CD19 cytoplasmic domain and hence to CD19 signaling, because the truncated mutant form failed to exert similar effects.
The mechanism(s) by which CD19 induces these effects remains to be elucidated. Systematic study of the major candidate signaling pathways (mainly PI-3 kinase and MAP kinase) downstream of CD19 is ongoing in our laboratory. Preliminary experiments on K-19+ cells stimulated with serum showed that phosphorylated ERK-1 and ERK-2 MAP kinases were downregulated in K-19++ clones, but were constitutively phosphorylated in neo-control and K-Δ19 clones (data not shown). This suggests that CD19 might be working as a molecular switch, which turns the growth signals off in appropriate time, and its absence may leave constitutively activated proliferation-promoting signals on, at least regarding the MAPK pathway. Nevertheless, it is surprising that expression of a surface protein such as CD19, unlike other known tumor suppressor gene products, could inhibit the growth of these cell lines both in vitro and in vivo. Taken together, CD19 may act in human myeloma as a new type of tumor suppressor gene product that is a transmembrane-signal transducing molecule.
We also observed decreased sensitivity of CD19 transfected cells to apoptotic stimuli such as dexamethasone, insulin, and serum starvation in comparison to neo-control and truncated CD19 clones. The difference was less striking than that of growth inhibition and tumorigenicity. Because the parental cell line, KMS-5, is already resistant to apoptotic stimuli, the observed effect could be due to CD19 expression, CD19-mediated amplification of antiapoptotic signals elicited by another pathway, or alternatively, due to the proliferation-inhibitory effect of CD19 expression (data not shown).
Our data suggest that loss of CD19 expression in human MM could be an important factor leading to the expansion of the malignant plasma cells. The availability of these clones should help in the dissection of signal transduction pathways in plasma cells, which no longer express the B-cell antigen receptor, and hence their signaling pathways via CD19 could be different from those of mature B cells. Finally, although the growth-inhibitory effect of CD19 is not specifically exerted on myeloma cells, the probability of specific transfer of CD19 gene into myeloma cells could contribute to the development of new strategies for the treatment of human MM.
Supported in part by grants from the Japanese Ministry of Education, Science, and Culture, and the Japanese Ministry of Health and Welfare.
The publication costs of this article were defrayed in part by page charge payment. This article must therefore be hereby marked “advertisement” in accordance with 18 U.S.C. section 1734 solely to indicate this fact.
REFERENCES
Author notes
Address reprint requests to Michio M. Kawano, MD, Department of Immunohematology, Yamaguchi University School of Medicine, 1-1-1 Minami-kogushi, Ube, Yamaguchi 755-8505, Japan; e-mail: mkawano@po.cc.yamaguchi-u.ac.jp.


This feature is available to Subscribers Only
Sign In or Create an Account Close Modal