Abstract
A new primitive hematopoietic cell line (THS119), exhibiting Lin−/Sca-1+/c-Kit+ a surface phenotype, grew and survived underneath stromal cells (TBR59). The ability of the THS119 cells to invade these stromal cell layers was dependent on the inclusion of serum in the culture medium. This was apparently due to a requirement for lipids contained in serum. Their invasion of the stromal cell layers in serum-free cultures could be triggered by addition of sphingosine-1-phosphate (S1P) or lysophosphatidic acid (LPA) and was dependent on both Rho- and Ras-signaling pathways. Between the 2 possible receptors of S1P and LPA, edg-1 and edg-2, expression of edg-2 only was found to be correlated with immaturity and/or invasive activity of the primitive hematopoietic cells. These results suggest the importance of specific lipids and their specific receptors on the invasive activity of primitive hematopoietic cells in the hematopoietic microenvironment.
Studies of long-term bone marrow cultures have shown that hematopoietic stem cells and progenitors can be maintained for prolonged periods on bone marrow–derived stromal cell layers.1-3 It has been consistently observed in such cultures that primitive hematopoietic cells are preferentially located within the adherent stromal cell layer, whereas hematopoietic cells of greater maturity migrate to the surface of the layer and shed into the culture medium.4-6 Cobblestone areas consisting of phase-contrast nonrefractile hematopoietic cells in the restricted space between the culture substratum and the stromal cell layer are frequently observed in long-term bone marrow cultures. These cobblestone areas are believed to include persisting hematopoietic stem cells and derivative progenitor cells.7 It is therefore of interest to analyze how the hematopoietic stem cells could be maintained in the restricted space produced by the stromal cells in long-term bone marrow cultures.
Examination of the cellular and molecular mechanisms involved in the maintenance of hematopoietic cells within cobblestone areas of long-term bone marrow cultures has been difficult because the generation of different populations of these cells may require cell–cell interactions with a variety of stromal cells. The use of more uniform cell populations for such studies may therefore be necessary. We have previously established bone marrow stromal cell lines and a stroma-dependent primitive hematopoietic cell line, THS119, from SV40 ts T-antigen transgenic mice. THS119 cells have a very primitive stem cell–like phenotype (Lin−/Sca-1+/c-Kit+), and can be kept underneath TBR59 stromal cells.8
When THS119 cells were seeded onto a stromal cell layer, they initially adhered to the surface of the stromal cells and then invaded the layers before beginning to proliferate within the restricted space between the culture substratum and the stromal cells, which may be equivalent to the regions found in the microenvironment of the bone marrow in vivo. In this study, we examined the factors regulating the invasion of stromal layers by THS119 cells, and demonstrated that specific lipids and their specific receptors may play a key role in the invasion, as a prerequisite step to the formation of cobblestone areas of immature hematopoietic cells.
Materials and methods
Bone marrow stromal cell line and hematopoietic cell line
The mouse bone marrow stromal cell lines, TBR59 and TBR311, were established from a SV40 ts T-antigen transgenic mouse9,10and were maintained in RITC 80-7 (Kyokuto Pharmaceutical, Tokyo, Japan), supplemented with 2% fetal bovine serum (FBS), 10 μg/mL transferrin, 1 μg/mL insulin, and 10 ng/mL epidermal growth factor (EGF, recombinant; generously supplied by Wakunaga Pharmaceutical, Tokyo). The cultures were incubated at 33°C, which is a permissive temperature for SV40 ts T-antigen. Using TBR59 cells as feeder cells, the THS119 hematopoietic cell line was established from Lin−/Sca-1+ hematopoietic progenitor cells of SV40 T-antigen transgenic mice.8 THS119 was maintained under the TBR59 cell layer in E-RDF (developed for hybridoma culture, Kyokuto Pharmaceutical), supplemented with 5% FBS, 10 μg/mL transferrin, 5 μg/mL insulin, 4.3 ng/mL sodium selenite, 1.53 μg/mL ethanolamine, and 50 μmol/L 2-mercaptoethanol. Cultures were incubated at 33°C (permissive temperature for ts SV40 T-antigen) and the medium was changed twice a week. To passage THS119 cells, cocultures were treated with 0.5% collagenase in Dulbecco's modification of MEM (DMEM, GIBCO BRL, Grand Island, NY). After the collagenase solution was aspirated and incubated for 10 minutes, cultures were suspended by pipetting in culture medium, then cultured briefly for 2 hours at 33°C to separate hematopoietic cells from the adherent stromal cells. Only hematopoietic cells remaining in suspension after the end of this step were used to initiate a fresh TBR59 layer and this was repeated every 10 days. IL-3– or IL-7-dependent and stroma-independent THS119 cells were generated from THS119 cells after exposure to those cytokines.8Cytokine-dependent THS119 cells were cultured in E-RDF medium supplemented with IL-3 (10 ng/mL, kindly supplied by Kirin, Tokyo) and IL-7 (5 ng/mL, Genzyme, Cambridge, MA), respectively.
Delipidated fetal bovine serum and lipids
To remove small molecules from FBS, 10 mL FBS was incubated overnight with 1 g activated charcoal (Wako, Osaka, Japan) at 4°C. After centrifugation at 1200g for 20 minutes, the supernatant was filtered through a 0.22-μm filter. Heat treatment of FBS was performed at 90°C for 10 minutes. Lipid-conjugated bovine serum albumin (BSA) (ALBU MAX, GIBCO BRL) and BSA (Chon fraction V) were dissolved in E-RDF at 10% as stock solution. Serum-bearing lipids, lysophosphatidyl serine (LPS), sphingosine (Sph), lysophosphatidic acid (LPA), lyosphosphatidyl choline (LPC), ceramides (Cra), ceramide-1-phosphate (C1P), sphingomyelin (SM), and sphingosine-1-phosphate (S1P) were purchased from Sigma (St Louis, MO), and dissolved in phosphate-buffered saline (PBS) with 0.1% BSA by sonication.
Invasion activity assay
Invasive activity of THS119 cells was assayed by 3 hours coculture with TBR59 cells. Cocultures of THS119 and TBR59 cells were treated with 0.5% collagenase in DMEM and suspended by pipetting, then incubated in culture medium for 2 hours to separate the 2 cell types. After adhesion of the TBR59 cells, only THS119 cells were present in the suspension phase, and these were then cocultured with a fresh confluent culture of TBR59 cells in 60-mm plastic culture dishes. After another 3 hours incubation, the supernatant was collected to obtain the THS119 remaining in suspension, and the cultures were then rinsed twice with 0.02% EDTA-PBS to retrieve the suspending and adhering THS119 cells. These combined retrieved cell numbers were counted as noninvading cells. Bone marrow progenitor cells were also cocultured with confluent cultures of TBR59 or TBR311 cells in 35-mm plastic culture dishes. The invasive and adhesive activity of bone marrow progenitor cells was assayed using a 17-hour coculture period.
Effect of inhibitors on the invasive activity of THS119 cells
To introduce pertussis toxin (PTx, Sigma) or ADP-ribosyltransferase C3 (C3 exotoxin, Calbiochem, La Jolla, CA) into THS119 hematopoietic cells, permeabilization with Streptolysin O (SLO, Sigma) was chosen because it produces large pores in the plasma membranes that allow the introduction of large molecules.11 SLO was activated by incubating 1000 U/mL SLO in PBS in the presence of 5 mmol/L dithiothreitol for 2 hours at 37°C. The activated SLO was stored at −20°C. Cocultures of THS119 and TBR59 were treated with 0.5% collagenase in DMEM and suspended by pipetting, then incubated in culture medium for an initial 2 hours to separate the 2 cell types as described above. After washing with a MgATP-free potassium glutamate buffer (150 mmol/L potassium glutamate, 10 mmol/L PIPES pH 7.2, 5 mmol/L nitrilotriacetic acid, 0.5 mmol/L EGTA, 0.2% BSA) 2 times at 4°C, THS119 cells were suspended in a potassium glutamate buffer, supplemented with 5 mmol/L MgATP at 2.5 × 10⁷cells/mL with SLO at 600 units per 107 cells, and were then allowed to stand on ice for 5 minutes. Excess toxin was removed by washing with cold potassium glutamate buffer, supplemented with 5 mmol/L MgATP. Toxins were added during the permeabilization. The cells were resuspended in PTx, C3 exotoxin, or 0.5 mg/mL flourescein isothiocyanate (FITC)-Dextran (as a monitor for the permeabilization) containing potassium glutamate buffer with 5 mmol/L MgATP at 2.5 × 10⁷ cells/mL. The 0.5-mL suspensions were then incubated at 37°C for 10 minutes to allow the pores to form. Then 9 mL of 10% FBS supplemented E-RDF medium was added, and the cells were incubated for 2 hours at 37°C before being tested in the invasion assay.
Bone marrow cell culture
Mouse femoral bone marrow was obtained from 10- to 15-week-old C57BL/6 mice and cultured for 3 to 4 weeks in Fischer's medium (Sigma) supplemented with 20% horse serum and 10−7 mol/L hydrocortisone. Cultures were maintained until many hematopoietic colonies were produced at 33°C. Hematopoietic cells released from the stromal cell layer were collected with culture medium. To assay for cobblestone area-forming hematopoietic cells, cultures were treated with 0.5% collagenase in DMEM. After the collagenase solution was aspirated and the cultures were incubated for 10 minutes, the cells were suspended by pipetting. Cells harvested from the adherent layer of long-term bone marrow cultures were then cultured for 2 hours in medium at 37°C to separate the hematopoietic cells from the stromal cells. Hematopoietic cells remained suspended after the 2 hours of culture, and could then be collected in the supernatant. Cells that had already adhered to the dish after 2 hours were designated as stromal cells.
Reverse transcriptase–polymerase chain reaction
Total RNA was isolated by the acid phenol procedure using Isogen (Wako Pure Chemicals, Tokyo, Japan) according to the manufacturer's protocol. Total RNA (0.5 μg) was applied on a 1-Step RNA PCR Kit (TaKaRa, Tokyo, Japan). The specific complementary DNA (cDNA) was transcribed by avian myeloblastosis virus (AMV) reverse transcriptase (RT) (0.1 U/μL) at 50°C for 30 minutes in the presence of the gene-specific primers, followed by polymerase chain reaction (PCR) with Taq polymerase (0.1 U/μL) and 0.4 μmol/L of each of the gene-specific primers for 25 cycles, consisting of successive incubations at 94°C (30 seconds), 62°C (30 seconds), and 72°C (1 minute). This was performed in a 15-μL reaction mixture containing 1-Step RNA PCR buffer (TaKaRa), 1 mmol/L dNTP, 5 mmol/L MgCl2, and 0.8 U/μL RNase inhibitor. The product was electrophoresed on a 2% agarose gel stained with ethidium bromide. This RT-PCR detected 2 × 10³ copies of specific messenger RNA (mRNA) in 0.5 μg of total RNA. The forward and reverse primers used for RT-PCR were as follows: edg-1, 5′-GTCCGGCATTACAACTACAC and 5′-ATGAGGGAGATGACCCA- GCA:edg-2, 5′-CCCCAAACTACAGCACTGTC, and 5′-TGGGGTTCACAGATCCACAGA: HPRT, 5′-TTGTTGGATTTGAAATTCCAGACAAGT, and 5′-GCATTTAAAAGGAACTGTTGACAAC.
Preparation of hematopoietic progenitor cells
Bone marrow cells were flushed from the femurs of C57BL/6 mice with Dulbecco's PBS containing 0.2% BSA, and 2 mmol/L EDTA (PBS-BSA-EDTA). The cell suspension was washed and passed through nylon mesh (Falcon 2350, Becton Dickinson, Lincoln Park, NJ) to make a single cell suspension. Red blood cells were lysed with lysing buffer (155 mmol/L NH4Cl, 10 mmol/L KHCO3, and 1 mmol/L EDTA). To prepare lineage marker–negative (Lin−) c-Kit positive (c-Kit+) Sca-1 positive (Sca-1+) cells, hematopoietic cells were incubated with a cocktail of FITC-labeled monoclonal antibodies specific for lineage markers (anti-B220: RA3-6B2, PharMingen, San Diego, CA; anti–Mac-1: M1/70, Caltag Laboratories, South San Francisco, CA; anti–Gr-1, RB6-8C5, PharMingen; antimouse CD3e, 145-2C11, PharMingen; and TER119: erythroid lineage marker, kindly provided by Dr T. Kina, Kyoto University), PE-conjugated anti–Sca-1 (PharMingen), biotin-conjugated anti–c-Kit (ACK2, kindly provided by Dr Nishikawa of Kyoto University), and APC-conjugated avidin in PBS-BSA-EDTA. Progenitor cells were sorted by fluorescence-activated cell sorter (FACStar Plus, Becton Dickinson). To prepare lineage marker-negative (Lin−) c-Kit–positive (c-Kit+) cells, bone marrow cells were incubated with a cocktail of monoclonal antibodies specific for lineage markers in PBS-BSA-EDTA. After 30 minutes of incubation on ice, the cells were washed twice with PBS-BSA-EDTA. To eliminate lineage marker–positive (Lin+) cells, the cells were incubated with goat-antirat-IgG–conjugated magnetic beads (Miltenyi Biotec, Germany) for 30 minutes on ice, then positive cells were removed by a magnet. Lin− cells were successively incubated with anti–c-Kit antibody (ACK2) for 30 minutes on ice. After washing with PBS-BSA-EDTA, cells were incubated with goat-antirat-IgG–conjugated magnetic beads for 30 minutes on ice, followed by washing twice with PBS-BSA-EDTA. Lin−/c-Kit+ cells were collected by magnetic cell isolation.
Results
Requirement of serum factors for invasion of THS119 cells
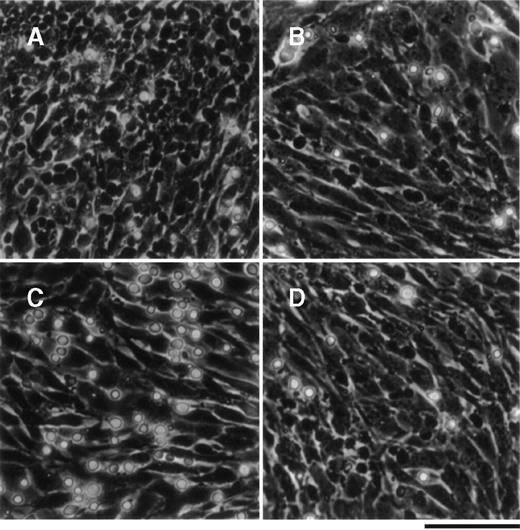
The primitive hematopoietic cell line, THS119, which was established from Lin−/Sca-1+ hematopoietic cellsfrom ts SV40 T-antigen gene transgenic mice, exhibits a stem cell surface phenotype and pattern of gene expression.8THS119 cells grew underneath TBR59 stromal cells in cocultures of these 2 cell types (Figure 1A). When the THS119 cells were seeded onto new TBR59 cells, they first adhered to the surface of the stromal cells, but within 3 hours they had invaded this layer (Figure 1B). Thus, we postulated that the invasion may be prerequisite for the maintenance of THS119 cells in such cocultures. When THS119 cells were seeded onto new TBR59 cells in the absence of FBS, they stayed on the surface of the cells and did not invade underneath the stromal cell layer. Thus, most of the cells appeared as phase-contrast bright cells (Figure 1C). In the absence of FBS, the cells were able to survive by weak adhesion to the surface of the TBR59 stromal cells over 1 day and, if FBS was then added, soon began to invade the stromal layer. Heat treatment (90°C 10 minutes) of FBS did not eliminate its ability to support this invasive activity of the THS119 cells (Figure 1D).
THS119 cells on TBR59 stromal cells.
THS119 cells were maintained within the TBR59 layer as phase-contrast nonrefractile cells (A) and are also shown in cocultures 3 hours after passage with 5% FBS (B), without FBS (C), or with heat-inactivated 5% FBS (D). Bar indicates 100 μm. THS119 under the stromal cell layer were observed as phase-contrast dark cells. Phase-contrast bright hematopoietic cells were cells in suspension or on the surface of the stromal cells.
Lipids induce invasive activity of THS119 cells
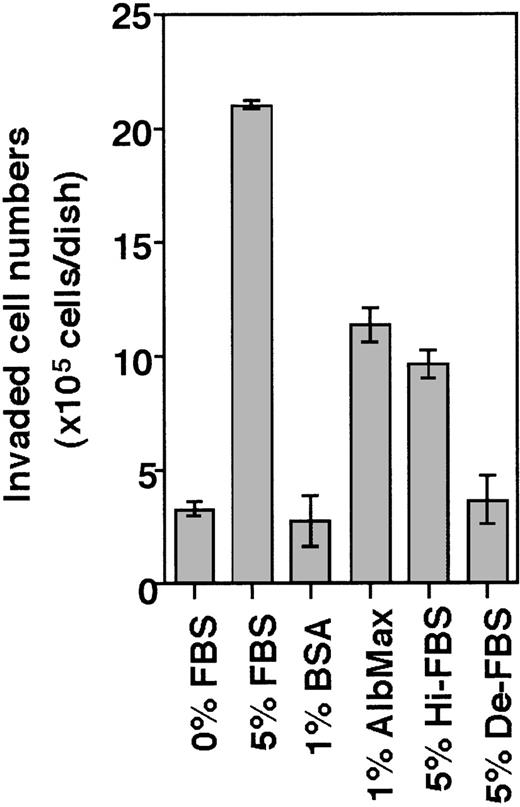
The invasive activity of THS119 cells was estimated by counting the number of cells adhering weakly to the stromal cells after 3 hours of coculture to determine the remaining number of noninvading cells (see “Materials and methods”). This endpoint was then used to identify the factors within the serum that allow THS119 cells to invade. In this assay, less than 10% of hematopoietic cells were recovered as noninvading cells in the presence of FBS, whereas, in the absence of FBS, 90% of the seeded cells were recovered in the noninvaded fraction. Invasion-inducing activity remained after heat inactivation of FBS (Hi-FBS in Figure 2), but charcoal stripping completely eliminated this activity (De-FBS in Figure 2). These results suggested that lipids might have the invasion-inducing activity of FBS. Because albumin was shown to affect the rate of movement of neutrophil populations on substrata and in micropore filters,12 the effect of lipid-conjugated BSA was examined. Lipid-conjugated BSA did show invasion-inducing activity, whereas unconjugated BSA did not. Thus, the serum that contains lipids may also have this activity.
Invasion of THS119 cells into the TBR59 cell layers.
The 2.5 × 10⁶ THS119 cells were cultured on TBR59 cells for 3 hours at 33°C with or without supplements. Adhered and suspended THS119 cells were retrieved by incubation and rinsed with EDTA-PBS. Invading cells remained under the stromal cell layer, and cells staying on the surface of the stromal cells were retrieved and counted. Invaded cell numbers were obtained by subtracting the numbers of noninvaded cells from the input cell numbers. Hi-FBS, heat-inactivated FBS at 90°C for 10 minutes; De-FBS, FBS delipidated by charcoal stripping; AlbMax, lipid-conjugated BSA. Data are the mean ± SD of 3 dishes: 5% FBS, AlbMax, and Hi-FBS versus 0% FBS (P < .0001 by Bonferroni/Dunn test); 0% FBS versus 1% BSA (P = .1639 by Bonferroni/Dunn test); and 0% FBS versus De-FBS (P = .028 by Bonferroni/Dunn test).
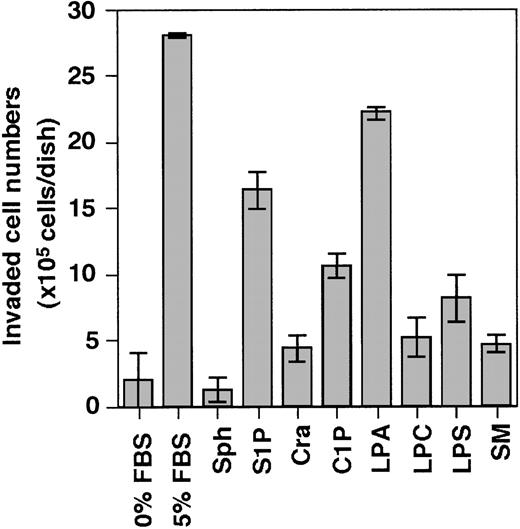
Accordingly, we evaluated the following lipids present in serum for their invasion-inducing activity on THS119 cells sphingosine (Sph), sphingosine-1-phosphate (S1P), ceramide (Cra), ceramide-1-phosphate (C1P), lysophosphatidic acid (LPA), lysophosphatidyl choline (LPC), lysophosphatidyl serine (LPS), and sphingomyelin (SM) (Figure 3). S1P and LPA showed high activity and C1P showed weak activity, whereas Sph, Cra, LPC, LPS, and SM showed none at all.
Effect of several kinds of lipids on the ability of THS119 to invade TBR59 cell layers.
The 2.5 × 10⁶ THS119 cells were cultured on TBR59 cell layers for 3 hours at 33°C with or without 5 μg/mL of indicated lipids. Adhered and suspended THS119 cells were retrieved by incubation and rinsed with EDTA-PBS. Invaded cell numbers were obtained by subtracting the numbers of noninvaded cells from the input cell numbers. Sph, sphingosine; S1P, sphingosine-1-phosphate; Cra, ceramide; C1P, ceramide-1-phosphate; LPA, lysophosphatidic acid; LPC, lysophosphatidyl choline; LPS, lysophosphatidyl serine; and SM, sphingomyelin. Data are the mean ± SD of 3 dishes: S1P, and LPA versus 0% FBS (P < .0001 by Bonferroni/Dunn test).
Rho-mediated and G-protein–coupled signaling pathways required for invasion
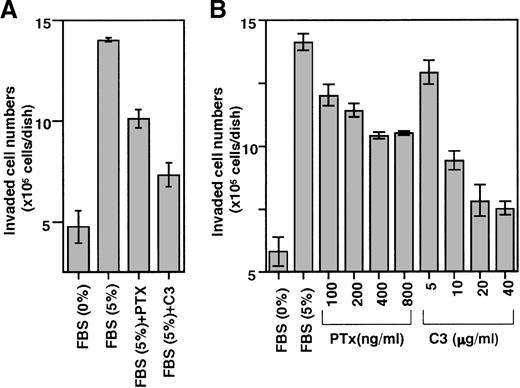
S1P and LPA appear to belong to an emerging family of bioactive LPLs that act though G-protein–coupled receptors to mediate similar responses on cytoskeletal remodeling.13 Typical receptor-mediated responses to S1P and LPA include mitogen-activated protein kinase activation through PTx-sensitive Gi protein.14 LPA activates G-protein–coupled receptor to stimulate multiple signaling pathways, including RhoA signaling, and the role of RhoA in cell adhesion and motility has been studied using C3 exotoxin (C3), a toxin that specifically inhibits Rho activity.15 Our examination of whether these signaling pathways are involved in the invasion of THS119 cells (Figure4) showed that PTx and C3 both inhibited the activity (Figure 4A) in a dose-dependent manner (Figure 4B). The results also suggested that the invasion-inducing activity of S1P and LPA is mediated by their receptors.
Effect of PTx and C3 exotoxin on the ability of THS119 cells to invade TBR59 cell layers.
SLO permeabilized 2.5 × 10⁶ THS119 cells were cultured on TBR59 cell layers for 3 hours at 33°C. (A) 200 ng/mL PTx or 10 μg/mL C3 exotoxin (C3) was added during permeabilization. Uptake of large molecules during permeabilization as measured by uptake of FITC-Dextran (0.5 mg/mL) was seen in 46% of the total cells. Cell viability was monitored after permeabilization by addition of 200 ng/mL propidium iodide, and was 88%. (B) Dose-response relation for toxins. PTx was added at 100 to 800 ng/mL and C3 exotoxin was added at 5 to 40 μg/mL during permeabilization. Uptake of large molecules was seen in 49% of total cells and cell viability was 84%. Data are the mean ± SD of 3 dishes: C3, and PTx versus 5% FBS (P < .0001 by Bonferroni/Dunn test) in (A); C3, and PTx versus 5% FBS (P < .0001 by Bonferroni/Dunn test) in (B), except for 5 μg/mL C3 versus 5% FBS (P = .0004 by Bonferroni/Dunn test).
Correlation of expression of edg-2, but not edg-1with immaturity and/or invasive activity of primitive hematopoietic cells
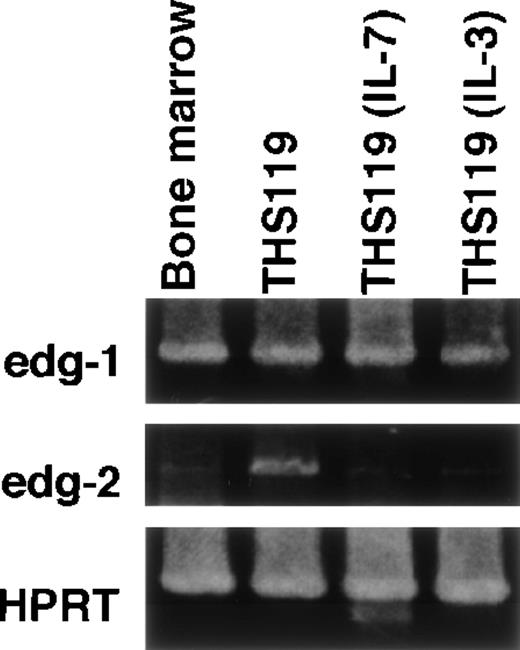
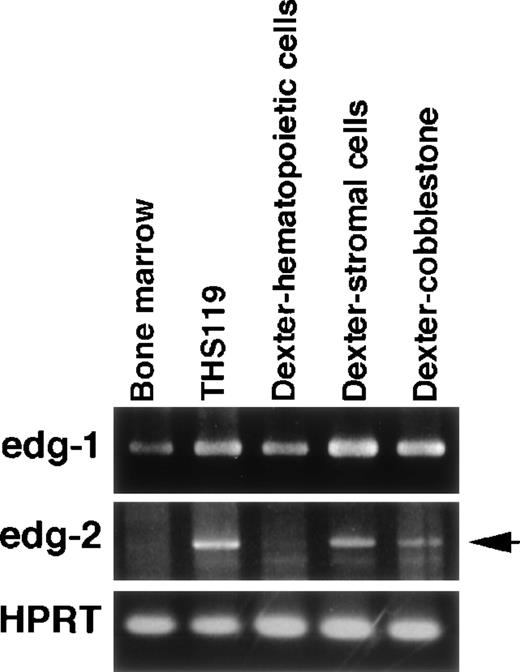
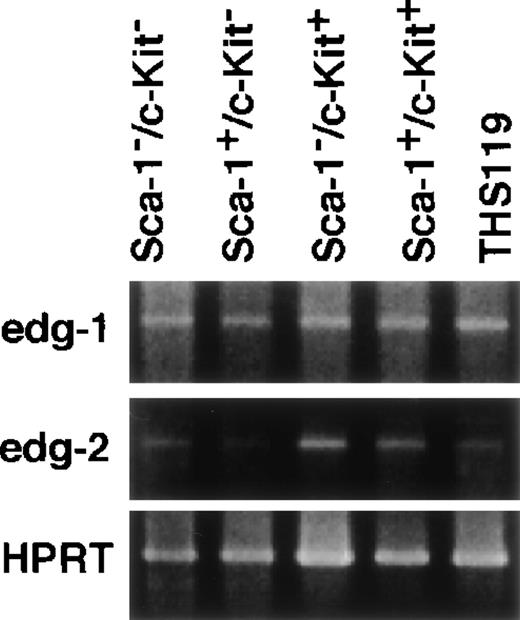
S1P and LPA are expected to induce several physiologic responses through binding to their respective receptors, edg-1 andedg-2.16-19 We were therefore interested in whether expression of either of these receptors would be correlated with the invasion-inducing activity of hematopoietic cells. In a previous work, we established 2 cytokine-dependent derivative cell lines from THS119 cell (IL-3– and IL-7–dependent). These were generated by prolonged culture of THS119 cells in the presence of these cytokines on TBR59 stromal cells. The derived cytokine-responsive sublines grow in the presence of either IL-3 or IL-7 in the absence of any stromal cells, although their patterns of expression of hematopoietic cell specific genes remain essentially similar to those of the parental cells.8 Because these cytokine-dependent sublines had lost the invasive activity (data not shown), we examined whether their expression of the receptor genes,edg-1 and edg-2, might be down-regulated, using RT-PCR analysis. The edg-2 was significantly down-regulated in both of the cytokine-dependent cell lines, whereas edg-2 was highly expressed in the parental THS119 cells (Figure5). In contrast, edg-1 was expressed almost equally by the parental THS119 cells and the 2 cytokine-dependent sublines. These results suggested that the invasive activity of immature hematopoietic cells may be regulated by levels of the edg-2, but not edg-1, receptor gene expression. To determine whether the edg-2, but not the edg-1, expression is correlated with immaturity and/or invasive activity of primitive hematopoietic cells, we used 2 approaches. First,edg-2 expression was examined in the cobblestone-forming, immature hematopoietic cells in primary long-term bone marrow cultures (Figure 6). Immature hematopoietic cells formed cobblestone areas, whereas more mature cells were released from the stromal cell layers and these were easily separated. The edg-2expression was not detected in mature hematopoietic cells, but was detected in the cobblestone-forming cells, whereas the level ofedg-1 expression was the same in the 2 cell fractions. Secondly, we examined the expression of edg-1 and edg-2in sorted hematopoietic progenitor cell fractions. Lin−/Sca-1+/c-Kit+ cells from bone marrow, which are enriched in hematopoietic stem cells,10 showed the highest cobblestone-forming activity and the Lin−/Sca-1−/c-Kit+fraction showed significant activity, whereas neither the Lin−/Sca-1+/c-Kit− nor the Lin−/Sca-1−/c-Kit−fractions produced any cobblestone areas on TBR59 stromal cells.10 Among these 4 fractions of immature hematopoietic cells, Lin−/Sca-1+/c-Kit+ and Lin−/Sca-1−/c-Kit+cells showed higher edg-2 expression and this was reduced in the Lin−/Sca-1+/c-Kit−and Lin−/Sca-1−/c-Kit−fractions (Figure 7). Expression ofedg-1 was almost equal among the 4 fractions. These findings suggested that expression of edg-2, but not edg-1, is strongly correlated with immaturity and/or invasion activity of primitive hematopoietic cells.
Expression of edg-1 and edg-2 by parental THS119 cells and cytokine-dependent THS119 sublines.
Total RNA (0.5 μg) from bone marrow, THS119, stroma-independent IL-3–dependent THS119 subline (THS119IL-3), and stroma-independent IL-7–dependent THS119 subline (THS119IL-7) were analyzed by RT-PCR.edg-1, 442 base pairs (bp) fragment specific for edg-1expression; edg-2, 1139 bp specific fragment for edg-2expression; HPRT, 516 bp specific fragment for HPRT expression.
Expression of edg-1 and edg-2 in long-term bone marrow culture cells.
Cells were obtained from the culture medium (floating hematopoietic cells), or were collected after enzyme treatment, followed by further short-term incubation to separate the stromal cells from the hematopoietic cells in cobblestone areas. Total RNA (0.5 μg) was analyzed by RT-PCR. edg-1, 442 bp fragment specific foredg-1 expression; edg-2, 1139 bp specific fragment foredg-2 expression (arrow); HPRT, 516 bp specific fragment for HPRT expression.
Expression of edg-1 and edg-2 in lineage marker–negative hematopoietic cells from bone marrow.
Total RNA from 4000 cells of Sca-1−/c-Kit−, Sca-1+/c-Kit−, Sca-1−/c-Kit+, Sca-1+/c-Kit+, and THS119 cells were analyzed by RT-PCR. edg-1, 442 bp fragment specific for edg-1expression; edg-2, 1139 bp specific fragment for edg-2expression; HPRT, 516 bp specific fragment for HPRT expression.
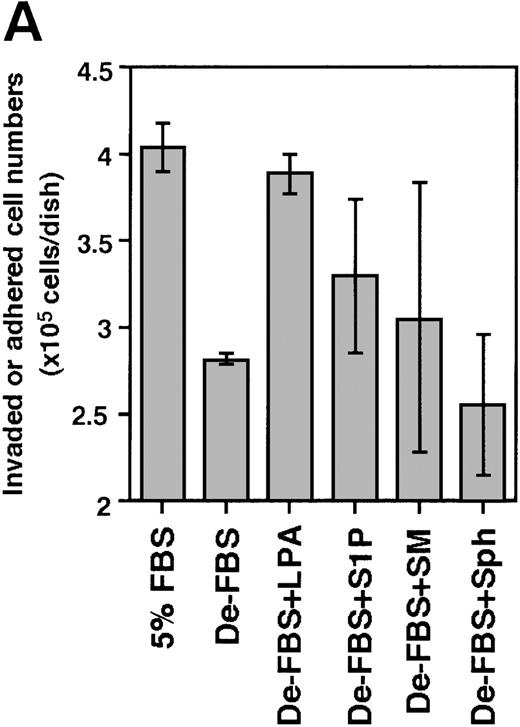
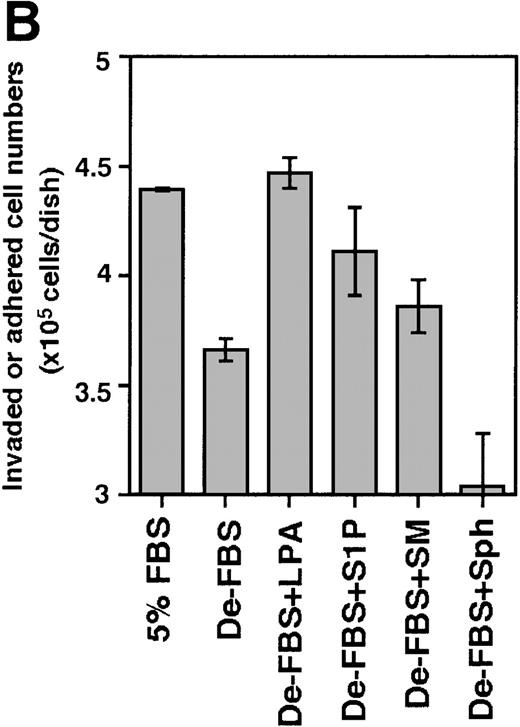
In view of these results, S1P and LPA were examined for their invasion-inducing activity on bone marrow progenitor cells. Because the Lin−/Sca-1+/c-Kit+ fraction and the Lin−/Sca-1−/c-Kit+fraction showed the highest cobblestone-forming activity on TBR59 stromal cells,10 Lin−/c-Kit+bone marrow hematopoietic progenitors were cocultured with the bone marrow stromal cell lines, TBR59 or TBR311 (Figure8). After 17 hours of coculture, many of the Lin−/c-Kit+ hematopoietic cells had adhered and invaded these stromal cell layers when FBS was present in the culture medium, but this activity was decreased when delipidated FBS was used. In the case of primary bone marrow hematopoietic cells, invasive cells are a small population (under 5%), although almost all cells had adhered to the stromal cells after 17 hours. S1P and LPA enhanced both the adhesion and the invasion of primary progenitor cells into the stromal cell layer.
Effect of S1P and LPA on the ability of Lin−/c-Kit+ bone marrow cells to invade stromal cell layers.
The 5 × 10⁵ bone marrow–derived Lin−/c-Kit+ hematopoietic progenitor cells were seeded on TBR59 (A) and TBR311 (B) bone marrow stromal cell lines and cultured for 17 hours at 33°C with or without 5 μg/mL of the indicated lipids. Suspended hematopoietic cells were retrieved by incubation and rinsed with EDTA-PBS. Adhered and invaded cell numbers were obtained by subtracting the numbers of cells retrieved in the suspended fraction from the input cell numbers. LPA, lysophosphatidic acid; S1P, sphingosine-1-phosphate; SM, sphingomyelin; Sph, sphingosine; De-FBS, 5% delipid FBS by charcoal stripping. Data are the mean ± SD of 3 dishes: De-LPS + LPA versus De-LPS (P = .0074 by Bonferroni/Dunn test) and De-LPS + S1P versus De-LPS (P = .1802 by Bonferroni/Dunn test) in (A); De-LPS + LPA versus De-LPS (P < .0001 by Bonferroni/Dunn test) and De-LPS + S1P versus De-LPS (P = .024 by Bonferroni/Dunn test) in (B).
Discussion
In a hematopoietic microenvironment such as that present in the bone marrow, the hematopoietic progenitor cells and stem cells are regulated through adhesive interaction with stromal cells, in addition to soluble factors. In long-term bone marrow cultures, primitive hematopoietic cells form cobblestone areas, illustrating the adhesive interactions of the hematopoietic cells and the stromal cells are observed. Cobblestone areas are thought to reflect the presence and proliferation activity of primitive hematopoietic cells, and their cobblestone area-forming ability may be linked to properties unique to primitive cells. The simple coculture system described here using an established hematopoietic cell line (THS119) and an established stromal cell line (TBR59) appears adequate to study the regulatory steps of cobblestone formation by primitive hematopoietic cells cocultured on stromal cells. The first step of cobblestone formation was the adhesion of THS119 cells to the surface of the stromal cell layers, followed by their invasion of the stromal cell layer. The initial adhesion of the hematopoietic cells to the surface of the stromal cells may not be strong, and the cells can easily move underneath the stromal cell layer.
In this study, we found that the ability of THS119 cells to invade requires serum, which could be replaced by lipids found in serum. Among various LPLs, S1P or LPA exhibited the most profound effect. Lipids did not affect cell adhesion; because their addition to serum-free cocultures promptly induced the invasion of weakly adhering THS119 cells, we speculated that the invasion-inducing activity of these lipids may be due to their ability to induce a locomotive activity in the THS119 cells. The principal reported effects of LPLs are growth related: induction of cellular proliferation, alterations in differentiation, and survival.20 However, LPA and S1P are also known to trigger cytoskeletal responses such as contraction, secretion, adhesion, and chemotaxis that are linked to cellular locomotive activity.20
The fact that LPA and S1P induce an invasive activity in THS119 cells may be notable because these 2 lipids have specific receptors classified as subfamilies of G-protein–coupled receptors: Edg-1 specific for S1P and Edg-2 specific for LPA.16,18 Both genes (edg-1 and edg-2) were found to be endothelial differentiation genes.16 Properties of the G-protein–coupled receptors in Edg receptors were clearly demonstrated. Cooperation of the LPA receptor (Edg-2) signaling with Rho family GTPases was reported in the invasion of T-lymphoma cells,21 and induction of morphogenesis of endothelial cells by S1P was reported to be coupled with the G-protein–coupled receptor, Edg-1.16 We confirmed the possible involvement of these G-protein–coupled receptors in the serum-induced invasive activity of THS119 cells using specific inhibitors. PTx, an inhibitor of trimeric Gi proteins,22 and C3 exotoxin, an inhibitor of Rho,15 both inhibited THS119 invasive activity, although their inhibition was partial. Therefore, the invasion was mediated at least in part by signals from G-protein–coupled receptors. The LPL-induced locomotive properties of hematopoietic progenitor cells observed here may be similar to those observed in tumor metastasis23,24 and tissue invasion of leukemia cells21,25 or the homing of mature hematopoietic cells.26 27
We observed the differential expression of the 2 edg genes among hematopoietic cells. Expression of edg-2 was well correlated with the invasion activity of hematopoietic cells because parental THS119 cells, but not stroma-independent THS119 sublines, the cobblestone-forming fraction, but not mature shed cells in long-term bone marrow cultures, and purified Lin−/c-Kit+, but not Lin−/c-Kit− bone marrow cells, all showed higher edg-2 expression. In contrast, edg-1 was ubiquitously expressed in all hematopoietic cell populations examined. Thus, LPA may induce a selective signal only in primitive hematopoietic cells that express edg-2, explaining why LPA acts only on immature hematopoietic cells. On the other hand, S1P may function only if the Edg-1 receptor can be coactivated with other signals in hematopoietic cells. A possible such costimulatory factor may be SDF-1, a chemokine produced by bone marrow stromal cells,28because it was reported that SDF-1 and SCF (kit ligand) share signaling pathways in hematopoietic progenitors for cooperative induction of chemotaxis.29,30 Although we found that SDF-1 could not promote the invasion of THS119 cells, regardless of the expression of its CXCR4 receptor,8 it is possible that SDF-1 may share functions with lipids to induce invasion. Although S1P and LPA exhibited similar invasion-inducing activity not only in THS119 cells but also in bone marrow c-Kit+ progenitor cells, the 2 lipids may have different physiologic functions in hematopoietic cells in the hematopoietic microenvironment of the bone marrow. Our results also raise the intriguing possibility that LPA may regulate immature hematopoietic cells during steady-state hematopoiesis, whereas S1P may play a role under conditions of high cytokine production.
Acknowledgments
We are grateful to Dr S. Ikawa of Tohoku University for critical comments and advice, and to Mrs K. Masuko for her excellent technical assistance.
Supported by a grant-in-aid from the Ministry of Education, Science, Sports and Culture of Japan and by the proposal-based New Industry Creative Type Technology R&D Promotion Program from the New Energy and Industrial Technology Development Organization (NEDO) of Japan.
Reprints:Nobuaki Yanai, Department of Cell Biology, Institute of Development, Aging and Cancer, Tohoku University, Seiryo-machi, Aoba-ku, Sendai 980-8575, Japan.
The publication costs of this article were defrayed in part by page charge payment. Therefore, and solely to indicate this fact, this article is hereby marked “advertisement” in accordance with 18 U.S.C. section 1734.

This feature is available to Subscribers Only
Sign In or Create an Account Close Modal