Abstract
Hypoxia stimulates angiogenesis, the formation of new blood vessels. This study evaluates the direct effect of hypoxia (1% oxygen) on the angiogenic response of human microvascular endothelial cells (hMVECs) seeded on top of a 3-dimensional fibrin matrix. hMVECs stimulated with fibroblast growth factor–2 (FGF-2) or vascular endothelial growth factor (VEGF) together with tumor necrosis factor–α (TNF-α) formed 2- to 3-fold more tubular structures under hypoxic conditions than in normoxic (20% oxygen) conditions. In both conditions the in-growth of capillary-like tubular structures into fibrin required cell-bound urokinase-type plasminogen activator (uPA) and plasmin activities. The hypoxia-induced increase in tube formation was accompanied by a decrease in uPA accumulation in the conditioned medium. This decrease in uPA level was completely abolished by uPA receptor-blocking antibodies. During hypoxic culturing uPA receptor activity and messenger RNA (mRNA) were indeed increased. This increase and, as a consequence, an increase in plasmin formation contribute to the hypoxia-induced stimulation of tube formation. A possible contribution of VEGF-A to the increased formation under hypoxic conditions is unlikely because there was no increased VEGF-A expression detected under hypoxic conditions, and the hypoxia-induced tube formation by FGF-2 and TNF-α was not inhibited by soluble VEGFR-1 (sVEGFR-1), or by antibodies blocking VEGFR-2. Furthermore, although the αv-integrin subunit was enhanced by hypoxia, blocking antibodies against αvβ3- and αvβ5-integrins had no effect on hypoxia-induced tube formation. Hypoxia increases uPA association and the angiogenic response of human endothelial cells in a fibrin matrix; the increase in the uPA receptor is an important determinant in this process.
Introduction
In pathologic disorders, low oxygen tension or hypoxia often occurs. Especially in the course of tissue damage, a loss of adequate blood supply causes hypoxia.1 Angiogenesis or the formation of new vessels is strongly induced by hypoxic conditions.2,3 A number of cell types respond to hypoxia and produce angiogenic factors such as vascular endothelial growth factor–A (VEGF-A),4 platelet-derived growth factor–B (PDGF-B),5,6 and fibroblast growth factor–2 (FGF-2).7,8 Macrophages in particular are extremely sensitive to hypoxia. They may act as oxygen sensors and initiate the process of vessel renewal by secreting a number of angiogenic factors.9-11 On the other hand, endothelial cells, which are the dominant cell type in microvessels, play a key role in the formation of new vessel networks. Endothelial cells are able to survive severe hypoxic conditions12 13 and are potential vectors of hypoxia-induced angiogenesis.
During the onset of angiogenesis, endothelial cells degrade their basement membrane, migrate into the interstitial matrix, proliferate, and form new microvascular structures. Matrix remodeling proteases of the plasminogen activator/plasmin- and matrix-degrading metalloproteinase (MMP) cascades, together with their receptors and inhibitors, play pivotal roles in several of these steps.14 Depending on the composition of the matrix proteins in the area of angiogenesis, different groups of proteases are involved. In pathologic angiogenesis of the adult, angiogenesis is often accompanied by vascular leakage and by the formation of a fibrinous exudate.15,16 The fibrin matrix in this exudate facilitates cell migration by providing additional scaffolding for invading leukocytes and endothelial cells. Endothelial invasion into a fibrin matrix and the subsequent formation of capillary structures require cell-bound urokinase-type plasminogen activator (uPA) and plasmin activities.17-19 The uPA is secreted as a single-chain inactive pro-enzyme, which binds to its cellular receptor uPAR (CD87) and is proteolytically activated. Active uPA converts plasminogen into plasmin, a broadly acting protease that degrades several matrix proteins and can activate latent MMPs.16Both plasmin and uPA are rapidly inactivated, the latter by PA-inhibitor type–1 (PAI-1). The uPA:PAI-1 complex is internalized together with uPAR and degraded, while the unoccupied uPAR returns to the plasma membrane.20
It has been shown that in a number of in vitro as well as in vivo studies, the binding of uPA to uPAR is essential for its action in angiogenesis.19,21,22 Besides a role in localizing uPA activity, the uPAR can also play a role in cell adhesion by interacting with vitronectin and integrins.23-25 This cell-matrix interaction is modified by the binding of uPA and PAI-1.26,27 In addition, the occupied uPAR is also involved in cellular signal transduction.28 29
Hypoxia may stimulate angiogenesis by several mechanisms. It increases the transcription of VEGF in a number of cells.4,10,30 In endothelial cells hypoxia-induced VEGF production is described,31 although the resistance of endothelial cells to hypoxic stimulation with regard to VEGF production can also be observed.32,33 Similarly, conflicting data have been reported regarding the effect of hypoxia on the expression of VEGF receptors in endothelial cells.33-35 In addition to this, hypoxia also induced an increase in the expression of αvβ3- and αvβ5-integrins in retinal endothelial cells,36 integrins that may play a critical role in pathologic angiogenesis.37 Furthermore, hypoxia alters the fibrinolytical potential of endothelial cells.38,39 While hypoxia induced a decrease in uPA production in endothelial cells,38 it increased the expression of uPAR.39 As both uPA and uPAR are required during angiogenesis in a fibrin matrix,18 19 the effects of hypoxia on uPA and uPAR are expected to counteract each other.
In the present study we evaluated the effect of hypoxia on the formation of capillary-like tubular structures by human microvascular endothelial cells (hMVECs) in a 3-dimensional fibrin matrix. In particular the regulation and involvement of the plasminogen activator system, VEGF, and αvβ3- and αvβ5-integrins were studied.
Materials and methods
Materials
Materials used included medium 199 (M199) supplemented with 20 mmol/L HEPES (4-(2-Hydroxyethyl)-1-piperazineethanesulfonic acid) and penicillin with streptomycin (Biowitthaker, Verviers, Belgium); newborn calf serum (NBCS) (Gibco BRL Life Technologies, Grand Island, NY); tissue culture plastics (Costar, Cambridge, MA and Falcon, Becton Dickinson Labware, Franklin Lakes, NJ); L-glutamine (ICN Pharmaceutical, Costa Mesa, CA); heparin (Leo Pharmaceutic Products, Weesp, The Netherlands); thrombin (Organon Technika, Boxtel, The Netherlands); human fibrinogen and S-2251 (Chromogenix AB, Mölndal, Sweden); Factor XIII (gift of Drs H. Boeder and P. Kappus, Centeon Pharma GmbH, Marburg, Germany); FGF-2 (Pepro Tech EC, London, England); VEGF165and soluble (s)VEGFR-1 (gift of Dr H. Weich, GFB, Braunschweich, Germany); aprotinin (Pentapharm, Basel, Switzerland); monoclonal antibodies (mAbs) αvβ3- and αvβ5-integrin blocking (clones LM609 and P1F6, respectively; Chemicon, Temecula, CA); vitronectin (Gibco, Breda, The Netherlands); plasminogen (Boehringer Mannheim, Penzberg, Germany); and uPAR-blocking mAb H-2 (gift of Dr U. Weidle, Boehringer Mannheim).42
A crude preparation of endothelial cell growth factor (ECGF) was prepared from bovine brain as described by Maciag et al.40Human serum (HS) was obtained from a local blood bank, prepared with freshly obtained blood from 10-20 healthy donors, pooled, and stored at 4°C. Human recombinant tumor necrosis factor (TNF)-α (Dr J. Travernier, Biogent, Gent, Belgium) contained 2.45 × 10⁷ U/mg protein and less than 40 ng lipopolysaccharide per mg protein. Rabbit polyclonal antibodies (pAbs) (anti-uPA and anti-tpa) were prepared in our laboratory.41
Complementary DNA probes
The following complementary DNA (cDNA) fragments were used as probes in the hybridization experiments: a 1023-base pair (bp) fragment of human uPA cDNA (gift from Dr W.-D. Schleuning, Schering AG, Berlin, Germany)43; a 585-bp BamHI fragment of human uPAR cDNA (gift from Dr F. Blasi, Milan, Italy)44; and a 1200-bp PstI fragment of hamster actin cDNA.45
The human αv- and β5-subunit cDNA probes were prepared in our laboratory by reverse transcriptase–polymerase chain reaction (RT-PCR). In short, 1 μg total RNA from human umbilical vein endothelial cells (HUVECs) was reverse transcribed using oligo-dT (Boehringer Mannheim) and Superscript II (Gibco). For each RT product, one-twentieth of the final reaction volume was amplified in a PCR reaction using the following specific primers for the αv- and β5-integrins: αv-integrin: forward, 5′-CTTCAACCTAGACGTGGACAGT-3′, and reverse, 5′-TTGAAATCTCCGACAGCCACAG-3′36; β5-integrin: forward, 5′-CATAGGTGAACATCATGACGC-3′, and reverse, 5′-GCAGCTGCAACCAGTGCTCCTG-3′. PCR cycles were as follows: 1 cycle each at 96°C for 3 minutes, 35 cycles at 96°C for 45 seconds, 54°C for 1 minute, and 72°C for 90 seconds; and 1 cycle at 72°C for 7 minutes. Subsequently, the PCR product was purified using an extraction kit (Qiagen GmbH, Hilden, Germany) and then used as a cDNA probe. Other materials used in the methods described below have been specified in detail in related references and in the text or were purchased from standard commercial sources.
Cell culture
Foreskin hMVECs were isolated, cultured, and characterized as previously described.46 47 The hMVECs were cultured on gelatin-coated dishes in M199 supplemented with 20 mmol/L HEPES (pH 7.3), 10% HS, 10% heat-inactivated NBCS, 150 μg/mL crude ECGF, 2 mmol/L L-glutamine, 5 U/mL heparin, 100 IU/mL penicillin, and 100 μg/mL streptomycin at 37°C under 5% carbon dioxide (CO2)/95% air atmosphere, unless mentioned otherwise. The experiments were performed with confluent cells (0.7 × 10⁵ cells per cm2) that were cultured without growth factor for at least 24 hours.
Establishment of hypoxic culture conditions
For culturing in hypoxic conditions, hMVECs were placed in a NAPCO incubator (serial number 7101-C1; Precision Scientific, Chicago, IL) that controls the oxygen concentration by flushing with nitrogen (N2). Oxygen levels in the incubator were monitored by an internal oxygen sensor as well as by external calibration using Dräger Tubes 6728081 (Drägerwerk Ag, Lübeck, Germany). The hypoxic condition is defined as culturing at 37°C under a 1% oxygen (O2)/5% CO2 atmosphere.
In vitroangiogenesis model
Human fibrin matrices were prepared by the addition of 0.1 U/mL thrombin to a mixture of 2.5 U/mL Factor XIII (final concentrations), 2 mg/mL fibrinogen, 2 mg/mL sodium citrate, 0.8 mg/mL sodium chloride (NaCl), and 3 μg/mL plasminogen in M199 medium (mixture, pH 7.4). We added 300-μL aliquots of this mixture to the wells of 48-well plates. After clotting at room temperature, the fibrin matrices were soaked with M199 supplemented with 10% (vol/vol) HS and 10% (vol/vol) NBCS for 2 hours at 37°C to inactivate the thrombin. Confluent endothelial cells (0.7 × 10⁵ cells per cm2) were detached and seeded in a 1.25:1 split ratio on the fibrin matrices to form a highly confluent monolayer. After a 24-hour culture in M199 medium supplemented with 10% HS, 10% NBCS, and penicillin/streptomycin, the endothelial cells were stimulated with the mediators for the time indicated. At the end of the culturing period, the media were collected, and the formation of tubular structures of endothelial cells in the 3-dimensional fibrin matrix was analyzed by phase contrast microscopy. The total length of tube-like structures of 6 randomly chosen microscopic fields (7.3 mm2 per field) was measured and expressed as mm/cm2 using a Nikon FXA microscope (Nikon, Japan) equipped with a monochrome CCD camera (MX5) connected to a computer with Optimas image analysis software.
Enzyme-linked immunosorbent assay
We performed uPA, tissue plasminogen activator (tPA), PAI-1, and VEGF antigen determinations using the following commercially available immunoassay kits: uPA EIA HS Taurus (Gaubius Laboratory, Leiden, The Netherlands); Thrombonostika tPA (Organon-Teknika, Turnhout, Belgium); IMULYSE PAI-1 (Biopool, Umea, Sweden); and VEGF ELISA (R&D Systems, Minneapolis, MN). Antibodies used in the uPA ELISA recognize single-chain uPA, 2-chain uPA, and the uPA:PAI-1 complex with the same efficiency. The PAI-1 enzyme-linked immunosorbent assay (ELISA) detects active and latent forms of PAI-1, whereas the tPA:PAI-1 and uPA:PAI-1 complexes are not recovered. The tPA ELISA recognizes both tPA and tPA:PAI-1 complexes.
Determination of specific uPA binding
Diisopropylfluorophosphate-treated uPA (Ukidan; Pierce Chemical, Rockford, IL) (DIP-uPA) was radiolabeled using Na iodine 125 (125I) and the Iodogen procedure (Pierce). The binding of125I–DIP-uPA to hMVECs was determined at 0°C. The cells were placed on melting ice and incubated for 10 minutes with 50 mmol/L glycine-hydrochloride (HCl) buffer (pH 3.0) to remove receptor-bound endogenous uPA. Subsequently, the cells were washed twice with ice-cold M199 medium and incubated with 8 nmol/L 125I–DIP-uPA in endothelial cell–conditioned medium (M199 medium supplemented with 1% HS albumin and conditioned for 24 hours) for 3 hours. Incubation was performed in endothelial cell–conditioned medium to exclude the residual binding of uPA to cell-associated PAI-1. In parallel incubations, a 50-fold excess of DIP-uPA was included to assess nonspecific binding. After the incubation period, unbound ligand was removed by extensive washing with ice-cold M199 medium. Cell-bound ligand was solubilized with 0.3 mol/L NaOH, and the radioactivity was determined in a γ-counter (Cobra Auto Gamma, Packard, Meriden, CT). Specific binding was calculated by the subtraction of nonspecific binding from the total binding.
RNA isolation and Northern blot analysis
Total RNA was isolated as described by Chomczynski and Sacchi48 and electrophoresed in a 1.2% (wt/vol) agarose gel under denaturing conditions using 1 mol/L formaldehyde. The RNA was transferred to Hybond-N filter by blotting, and the filters were hybridized overnight at 63°C in 7% (wt/vol) sodium dodecyl sulfate (SDS), 0.5 mol/L Na2HPO4/NaH2PO4 buffer (pH 7.2), and 1 mmol/L ethylenediamine tetraacetic acid (EDTA) containing a 3 ng/mL α-32P (phosphorous 32) CTP–labeled probe. The probes were labeled by a Megaprime kit (Amersham International, Little Chalfont, England), yielding an average activity of 0.0074 MBq/ng (0.2 μCi/ng) DNA. After hybridization of the filters, they were washed twice with 2 times sodium chloride/sodium citrate (SSC) (one times SSC equal to 0.15 mol/L NaCl and 0.015 mol/L sodium citrate-dihydrate [pH 7.0]) and 1% SDS and then washed twice with 1 times SSC and 1% SDS for 20-minute time periods at 63°C. The filters were exposed to a Fuji imaging plate type BAS-MP (Fuji Photo Film, Tokyo, Japan), and the quantification of relative amounts of transcribed mRNA was performed using a Phosphorimager BAS-reader (Fuji Fujix Bas 1000, Fuji).
Cell attachment assay
Cell attachment assays were performed in bacteriological 96-well plates (ELISA plates; Greiner, Frickenhausen, Germany) coated with 10 μg/mL vitronectin as previously described.19
Assay of cell-associated plasmin formation
We cultured hMVECs until confluency in 96-well culture plates and stimulated them for 72 hours with the factors indicated in the text. The cells were washed 3 times with ice-cold 0.05 mol/L Tris-HCl (tris[hydroxymethyl] aminomethane–HCl) buffer (pH 7.4) supplemented with 0.03% HS albumin. We added 40 μL substrate mix containing plasminogen at a final concentration of 200 nmol/L and chromogenic substrate S-2251 at a final concentration of 0.3 mmol/L in 0.05 mol/L Tris-HCl plus 0.03% HS albumin (pH 7.4). The culture plates were placed at 37°C, and absorbance was monitored at 405 nm using a multichannel spectrophotometer (Titertek multiscan; Flowlabs, McLean, VA), thereby producing the expected increase for p-nitroanilide from plasmin production.
Statistical analysis
The data are expressed as the mean plus or minus SD. The unpaired t test was used for comparison of groups with equal variance and normal distribution. P < .05 was considered statistically significant.
Results
Effect of hypoxia on cell viability and capillary-like tube formation
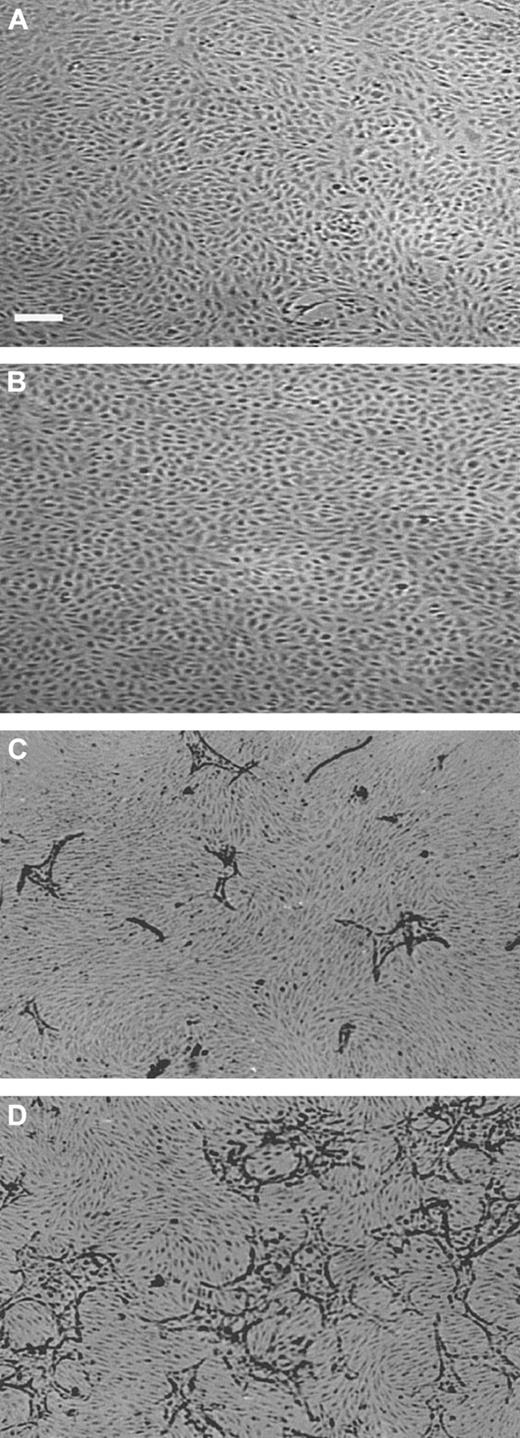
The viability of hMVECs cultured in an hypoxic condition (1% oxygen atmosphere) was comparable to that in standard oxygen atmosphere (20% oxygen, further indicated as normoxic), as determined by trypan blue exclusion. When confluent hMVECs had been incubated for 72 hours in normoxic and hypoxic conditions, without the addition of growth factors, their viabilities were 98.3% ± 0.1% and 97.0% ± 1.5%, respectively (the mean plus or minus SD of 3 experiments in duplicate, P = .81). The monolayers of hypoxic hMVECs showed a very regular cobblestone appearance on the gelatin-coated dishes (data not shown) and on a 3-dimensional fibrin matrix in the absence of angiogenesis stimulating factors (Figure1A-B).
Capillary-like tube formation is increased under hypoxic conditions.
hMVECs were cultured on top of a 3-dimensional fibrin matrix in M199 supplemented with 10% HS and 10% NBCS under (A,C) normoxic or (B,D) hypoxic culture conditions and were not stimulated (panels A,B) or stimulated (panels C,D) with 10 ng/mL each FGF-2+TNF-α. After 3 days of culturing, nonphase photomicrographs were taken.The bar indicates 300 μm.
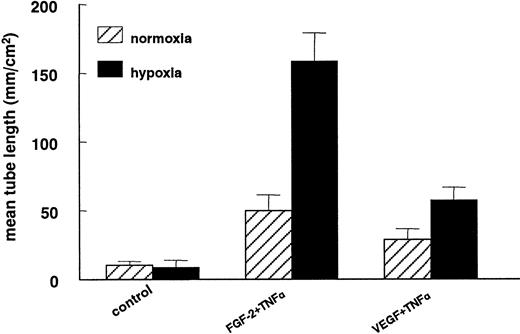
In previous studies we have shown that hMVECs cultured on top of a 3-dimensional fibrin matrix can be induced to form capillary-like structures by simultaneous exposure to FGF-2 and TNF-α (FGF-2+TNF-α) or VEGF165 and TNF-α (VEGF165+TNF-α).18,19 49 An ambient 1% oxygen atmosphere further enhanced the extent of tube formation (compare Figure 1C with 1D). The total tube length of FGF-2+TNF-α–induced tubular structures was increased by a factor 3.2 ± 0.3 (n = 5, P < .001) during a 72-hour incubation period, while the VEGF165+TNF-α–induced tubular structures increased 2-fold (2.0 ± 0.2; n = 5,P = .001) (Figure 2). The stimulation of tube formation by hypoxia could not be mimicked by cobalt chloride, nickel chloride, or deferoxamine, agents that point to the involvement of a heme protein in the oxygen-sensing mechanism (data not shown).
Capillary-like tube formation is increased under hypoxic conditions.
hMVECs were cultured on top of a 3-dimensional fibrin matrix in M199 supplemented with 10% HS and 10% NBCS under normoxic or hypoxic culture conditions and were not stimulated (control) or stimulated with 10 ng/mL each FGF-2+TNF-α or with 25 ng/mL VEGF165 and 10 ng/mL TNF-α (VEGF165+TNF-α). After 3 days of culturing, the mean tube length (mm/cm2) was measured as described. The data represent the mean plus or minus SD of 5 independent experiments performed in duplicate wells.
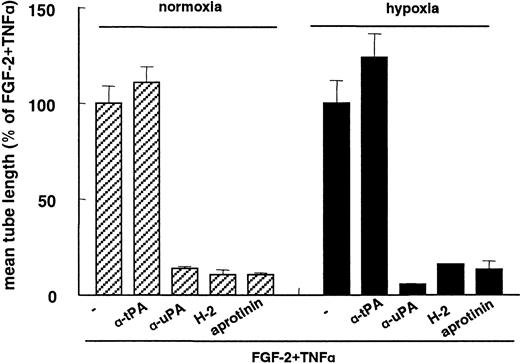
FGF-2+TNA-α–induced capillary-like tube formation under hypoxia was inhibited by the addition of antibodies directed against uPA, uPAR, and the plasmin inhibitor aprotinin, with respective inhibition rates of 86% ± 1%, 89% ± 3%, and 89% ± 1% (n = 3) (Figure 3). These degrees of inhibition did not differ significantly from those observed after the addition of these inhibitors in normoxic culture condition: 94% ± 0.4%, 84% ± 0.3%, and 86 ± 4% inhibition, respectively (n = 3). Antibodies against tPA did not affect tube formation under hypoxic conditions, which is a similar finding to that previously found in normoxic conditions19 49 (Figure 3). These data indicate that the hypoxia-enhanced in-growth of hMVECs in fibrin matrices also requires cell-bound uPA and plasmin activities.
Inhibition of capillary-like tube formation by uPAR antibodies.
hMVECs were cultured on top of a 3-dimensional fibrin matrix in M199 supplemented with 10% HS and 10% NBCS under normoxic or hypoxic culture conditions and were stimulated with 10 ng/mL each FGF-2+TNF-α in the presence of 100 μg/mL pAb anti-tPA, 100 μg/mL pAb anti-uPA, 5 μg/mL mAb H-2 (anti-uPAR), or 100 U/mL aprotinin. After 3 days of culturing, the mean tube length (mm/cm2) was measured as described and expressed as a percentage of FGF-2+TNF-α. The data represent the mean plus or minus SD of 3 independent experiments performed in duplicate wells.
Hypoxia decreases uPA levels in the conditioned media of hMVECs
To determine the effect of hypoxia on the fibrinolytic activity of hMVECs, we determined the uPA, tPA, and PAI-1 antigen levels by ELISA in the conditioned media of normoxic and hypoxic hMVECs. Under hypoxic culture conditions the uPA antigen was significantly decreased by 67% in nonstimulated cells, 74% in TNF-α–stimulated cells, and 77% in FGF-2+TNF-α–stimulated cells compared to normoxic culture conditions (Table 1). The amounts of PAI-1 and tPA produced by the cells were comparable in hypoxic and normoxic cells (Table 1). The effect of hypoxia on uPA levels in the conditioned media of hMVECs could not be mimicked by incubation with cobalt chloride, nickel chloride, or deferoxamine (data not shown). This decrease in the fibrinolytic potential in response to hypoxia was not expected because the formation of capillary-like structures requires the presence of cell-bound uPA (previous paragraph).
Effect of hypoxia on uPA, tPA, and PAI-1 antigen levels
| Addition . | Normoxia . | Hypoxia . | Inhibition by hypoxia, % . |
|---|---|---|---|
| uPA | |||
| Control | 0.09 ± 0.03 | 0.03 ± 0.01* | 67 |
| TNF-α | 0.83 ± 0.10 | 0.22 ± 0.03* | 74 |
| FGF-2 + TNF-α | 2.23 ± 0.18 | 0.51 ± 0.02* | 77 |
| tPA | |||
| Control | 1.82 ± 0.14 | 1.35 ± 0.47 | 26 |
| TNF-α | 1.82 ± 0.23 | 1.67 ± 0.18 | 8 |
| FGF-2 + TNF-α | 2.70 ± 0.10 | 2.56 ± 0.25 | 5 |
| PAI-1 | |||
| Control | 136 ± 54 | 115 ± 54 | 15 |
| TNF-α | 599 ± 60 | 608 ± 87 | −2 |
| FGF-2 + TNF-α | 560 ± 81 | 524 ± 85 | 6 |
The measurements are given as ng/105 cells. hMVECs were cultured on gelatin-coated wells for 72 hours in normoxic and hypoxic conditions in M199 supplemented with 10% HS and were stimulated with 10 ng/ml TNF-α or 10 ng/mL each FGF-2 + TNF-α or not (control). After the incubation period the uPA, tPA, and PAI-1 antigen levels were determined by ELISA and described and expressed as ng/105 cells. The data represent the mean plus or minus SD of 9 cultures in 3 independent experiments.
The asterisk indicates P < .05, which is significantly different from normoxia.
uPAR expression is upregulated in hypoxic conditions
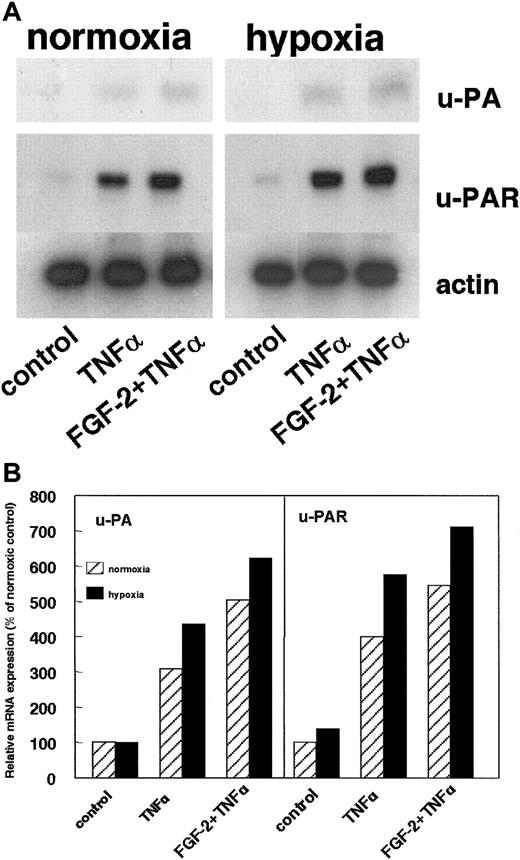
The uPA level in the conditioned medium of cells is the result of its production and internalization by the cellular receptor uPAR. The effect of hypoxia on the uPAR expression was assayed. Hypoxic conditions increased uPAR mRNA in nonstimulated cells as well as in TNF-α– or FGF-2+TNF-α–stimulated hMVECs (Figure4A-B). The uPAR mRNA signal was normalized for actin mRNA and quantified (Figure 4B). Compared to the normoxic situation, hypoxia stimulated uPAR mRNA expression by 139%, 144%, and 130% in nonstimulated cells, TNF-α–stimulated cells, and FGF-2+TNF-α–stimulated cells, respectively. The uPA mRNA levels were also determined (Figure 4A-B). These signals were very weak but clearly enhanced after hypoxic treatment: 101%, 141%, and 124% in nonstimulated cells, TNF-α–stimulated cells, and FGF-2+TNF-α–stimulated cells, respectively (Figure 4B).
Effect of hypoxia on uPA and uPAR mRNA expression.
(A) hMVECs were cultured for 72 hours in normoxic and hypoxic conditions in M199 supplemented with 10% HS and not stimulated (control) or stimulated with 10 ng/mL TNF-α or 10 ng/mL each FGF-2+TNF-α. After 72 hours, total RNA was isolated and analyzed by Northern blotting using α-32P CTP-labeled probes for uPA, uPAR, and actin. (B) The signals for uPA and uPAR mRNA were quantified by Phosphorimager analysis and adjusted for the corresponding actin mRNA. The data are expressed as a percentage of normoxic control cells. Similar results were obtained in 3 independent experiments.
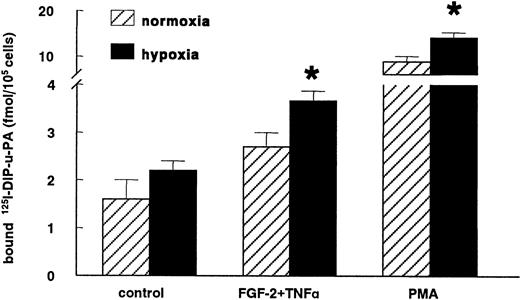
The increase in uPAR mRNA expression in hypoxic conditions was accompanied by an enhanced uPAR antigen level compared to normoxic conditions. The increase in specific-bound 125I-labeled DIP-uPA was evident in nonstimulated hMVECs (138% ± 38%; n = 4,P = .2) and significantly increased in cells stimulated with FGF-2+TNF-α (142% ± 17%; n = 4, P = .02) or with the strong inducer of the uPAR expression, phorbol myristate acetate (164% ± 11%; n = 4, P = .03) (Figure5).
Hypoxia increases uPAR antigen levels.
hMVECs were cultured for 72 hours in normoxic and hypoxic conditions in M199 supplemented with 10% HS and not stimulated (control) or stimulated with 10 ng/mL each FGF-2+TNF-α or with 10−8mol/L phorbol myristate acetate (PMA). Subsequently, the cells were cooled on ice, and the specific binding of 125I-labeled DIP-uPA to hMVECs was determined and expressed as fmol125I-uPA/105 cells. The data represent the mean plus or minus SEM of 4 independent experiments performed in duplicate wells. The asterisk indicates P < .05, which is significantly different from the normoxic counterpart.
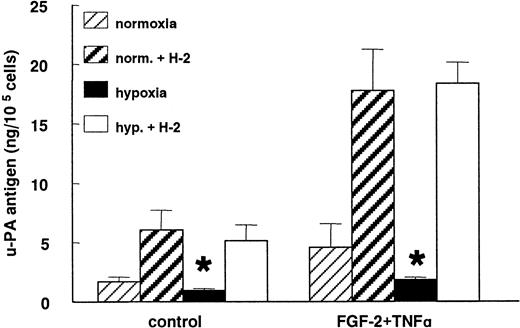
When the uPA:uPAR binding was prevented by the blocking mAb H-2 against uPAR, the decrease in the uPA antigen level observed under hypoxic conditions was completely abolished in nonstimulated as well as in FGF-2+TNF-α–stimulated cells (Figure6). After incubation with mAb H-2, 5 times more uPA accumulated in the media of the control cells as well as the FGF-2+TNF-α–stimulated normoxic hMVECs. In nonstimulated and FGF-2+TNF-α–stimulated hypoxic cells, 6 and 24 times more uPA was accumulated in the conditioned media, respectively.
Hypoxia does not decrease uPA production.
hMVECs were cultured for 72 hours in normoxic and hypoxic conditions in M199 supplemented with 10% HS and not stimulated (control) or stimulated with 10 ng/mL each FGF-2+TNF-α in the presence of 0 or 5 μg/mL mAb H-2. After the incubation period, the uPA antigen levels were determined in the conditioned media by ELISA, as previously described, and expressed as ng uPA/105 cells. The data represent the mean plus or minus SD of 3 independent experiments performed in duplicate wells. The asterisk indicates P < .05, which is significantly different from the normoxic counterpart.
Plasmin generation is enhanced in hypoxic culture conditions
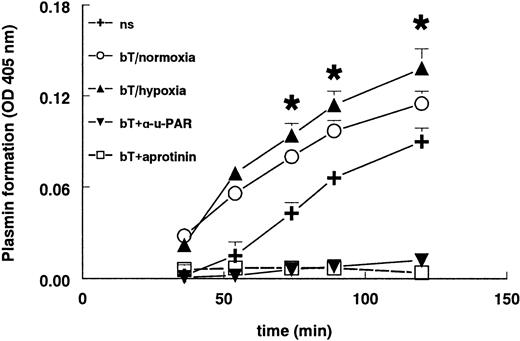
Stimulation of hMVECs with FGF-2+TNF-α resulted in an increased plasmin formation (Figure 7) compared to unstimulated cells. The plasmin generation was completely blocked by aprotinin. Parallel to the increased uPAR expression, hypoxia further increased plasmin formation by FGF-2+TNF-α–stimulated hMVECs compared to their normoxic counterparts (P < .002). This plasmin formation was completely inhibited by the addition of the blocking antibody H-2 against uPAR, indicating that solely receptor-bound uPA was responsible for plasmin formation (Figure 7). Antibodies against tPA did not influence plasmin formation (data not shown), meaning that only uPA was responsible for the activation of plasminogen.
Plasmin formation is increased in hypoxia.
hMVECs were cultured in M199 supplemented with 10% HS and 10% NBCS and not stimulated (ns) or stimulated with 10 ng/mL each FGF-2+TNF-α in normoxia (bT/normoxia) or hypoxia (bT/hypoxia). Normoxic hMVECs were cultured in the presence of 5 μg/mL mAb H-2 or 200 U aprotinin. After 72 hours the plasmin formation was measured as described in “Materials and methods.” H-2 and aprotinin were also present during the plasmin formation assay. The data are expressed as the mean plus or minus SD. Each condition was performed 8-fold. The asterisk indicatesP < .002, which is significantly different from normoxic FGF-2/TNF-α–stimulated cells.
VEGF165 is not involved in hypoxia-induced tube formation by hMVECs in a fibrin matrix
It has been reported that VEGF165 expression is enhanced in hypoxic conditions in a number of cell types, including endothelial cells,31 by an increased transcriptional activation50 as well as by mRNA stabilization.51,52 Furthermore, it has been shown in HUVECs and hMVECs that VEGF165 can up-regulate uPAR expression.18 53 Therefore, it was investigated whether endogenous synthesis of VEGF165 might play a role in the observed increase in tube formation of hMVECs in a fibrin matrix under hypoxic conditions.
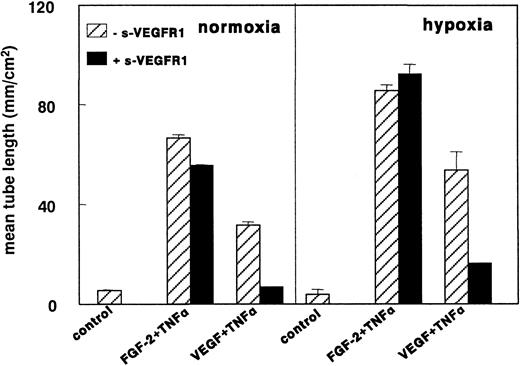
VEGF165 could not be detected by ELISA (detection limit, 5 pg/mL) in the conditioned media of both normoxic and hypoxic hMVECs. In addition, VEGF165 mRNA was not detected by Northern blot analysis at 8, 24, or 72 hours nor by RT-PCR (data not shown). The addition of 29 nmol/L sVEGFR-1 (a 50-fold excess over the VEGF165 concentration used in the in vitro angiogenesis experiments) did not affect the increased tube formation of FGF-2+TNF-α–stimulated hMVECs in hypoxic conditions (Figure8). In the same group of experiments sVEGFR-1 completely inhibited VEGF165+TNF-α–induced tube formation in normoxic conditions, indicating the ability of sVEGFR-1 to neutralize all VEGF165 from the media. In addition, a blocking antibody to VEGFR-2 was unable to block FGF-2+TNF-α–induced tube formation in normoxic as well as in hypoxic conditions (data not shown).
sVEGFR-1 does not inhibit FGF-2+TNF-α–induced tube formation in hypoxia.
hMVECs were cultured on top of a 3-dimensional fibrin matrix in M199 supplemented with 10% HS and 10% NBCS under normoxic or hypoxic culture conditions and were not stimulated (control) or stimulated with 10 ng/mL each FGF-2+TNF-α or with 25 ng/mL VEGF165 and 10 ng/mL TNF-α (VEGF165+TNF-α) in the presence of 0 or 2 g nmol/L sVEGFR-1. After 3 days of culturing, the mean tube length (mm/cm2) was measured as described. The data represent the mean plus or minus SD of 3 independent experiments performed in duplicate wells.
Involvement of αvβ3- and αvβ5-integrins in hypoxia-induced tube formation
Besides the importance of proteolytic activity, the ability of the endothelial cells to reattach to the matrix is essential for cell migration and angiogenesis. The importance of αvβ3- and αvβ5-integrins in angiogenesis and their regulation by hypoxia have been shown in a number of studies.36 54-56
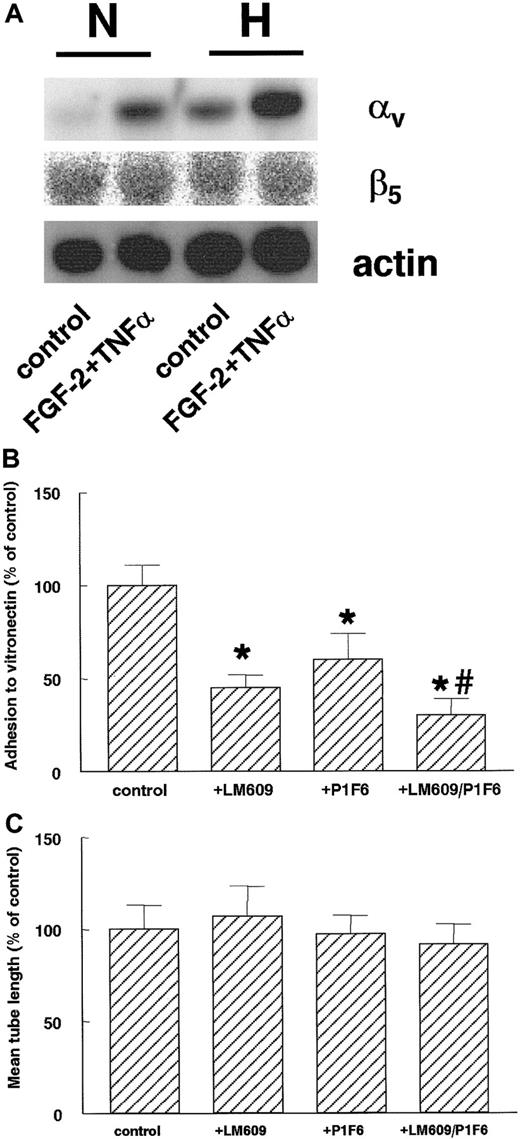
After 16 hours of hypoxic culturing, hMVECs showed an increase of αv-subunit mRNA expression compared to normoxic conditions (Figure 9A). This increase was evident at both control (4-fold induction compared to normoxia) and FGF-2+TNF-α–stimulated cells (2.6-fold induction). At this time-point, no effect of hypoxia on the β5-subunit mRNA could be detected on both the control and FGF-2+TNF-α–stimulated cells (Figure 9A). The β3-integrin mRNA remained below the detection limit by Northern blot assay.
Hypoxia increases αv-integrin mRNA expression.
(A) hMVECs were cultured for 16 hours in normoxic (N) and hypoxic (H) conditions in M199 supplemented with 10% HS and not stimulated (control) or stimulated with 10 ng/mL each FGF-2+TNF-α. After the incubation period, total RNA was isolated and analyzed by Northern blotting using α-32P CTP-labeled probes for αv-integrin, β5-integrin, and actin. (B) The cell adhesion assay was performed as described in “Materials and methods.” hMVECs were allowed to adhere to vitronectin for 90 minutes in the presence of control antibody 10 μg/mL anti-FITC (fluorescein isothiocyanate), 10 μg/mL LM609, 10 μg/mL P1F6, or a combination of 10 μg/mL each LM609 and P1F6. The data are expressed as the mean percentage of the control plus or minus SD. Each condition was performed 4-fold. The different groups were compared by an analysis of variance (ANOVA). The asterisk indicates P < .001, which is significantly different from control, and the number sign indicatesP = .005, which is significantly different from P1F6. (C) hMVECs were cultured on top of a 3-dimensional fibrin matrix in M199 supplemented with 10% HS and 10% NBCS under normoxic or hypoxic culture conditions and were stimulated with 10 ng/mL each FGF-2+TNF-α (control) alone or in the presence of 10 μg/mL of the αvβ3-blocking mAb LM609, the αvβ5-blocking mAb P1F6, or a combination of these antibodies (LM609/P1F6). After 3 days of culture, the mean tube length (mm/cm2) was measured as described. The effect of LM609 and P1F6 is expressed as the mean percentage of FGF-2+TNF-α–stimulated cells plus or minus the range of 2 independent experiments performed in duplicate wells.
The involvement of αvβ3- and αvβ5-integrins in hypoxia-induced tube formation was investigated by adding blocking mAbs directed against the αvβ3- and αvβ5-integrins. When hMVECs were seeded in vitronectin-coated dishes, cell adherence was significantly inhibited by the mAb LM609 (P < .001), which blocks the αvβ3-integrin, and by the mAb P1F6 (P < .001), which blocks the αvβ5-integrin. The strongest inhibition was seen after incubation with both antibodies (Figure 9B). No significant reduction was observed in capillary-like tube formation (Figure 9C) by either antibody or the combination of the 2 antibodies.
Discussion
In this report we have shown that hypoxia strongly enhances the formation of capillary-like tubular structures by hMVECs in a 3-dimensional fibrin matrix. Our data indicate that enhanced expression of uPAR by hypoxia, at least in part, explains the increased angiogenic response of endothelial cells. In our experimental model, which only contains endothelial cells, the expression of αv-integrin, but not that of VEGF165, also was enhanced by hypoxia. However, neither VEGF165expression nor the expression of the αvβ3- and αvβ5-integrins significantly contributed to the hypoxia-induced increase in tube formation.
Hypoxia is a potent stimulus for angiogenesis.2,3 In vivo macrophages are highly sensitive to hypoxia and are induced by it to produce angiogenic factors such as VEGF.9-11 VEGF is also induced in other tissue cells such as stroma cells and smooth muscle cells.4,10,30 In these cells hypoxia can act both on gene transcription and mRNA stability.50 57 In this report we have shown that hypoxia increases the formation of capillary-like tubular structures in a model in which endothelial cells invade a fibrin matrix. No accessory cells were present, indicating that hypoxia directly affected endothelial cells. This affect appears independent of an increased VEGF165 production because VEGF165mRNA was not detectable in the cells, VEGF165 antigen was not detectable by ELISA, and the effect could not be inhibited by sVEGFR-1 or anti–VEGFR-2 immunoglobulin G (IgG).
While Namiki et al31 reported the induction of VEGF165 in human endothelial cells, other investigators33 could not detect any increase in VEGF165 by hypoxia, which is similar to our findings. In line with this latter study, our data does not support an autocrine stimulation of VEGF165-induced angiogenesis by hypoxia and provides information regarding a mechanism in addition to the presently established paracrine stimulation of VEGF165-induced angiogenesis by hypoxia. A hypoxia-induced up-regulation of VEGF165 receptors in endothelial cells may be of interest in this context.33-35 Such mechanisms may contribute to the hypoxia-enhanced VEGF165+TNF-α–stimulated formation of capillary-like tubes. While the latter process is completely inhibited by sVEGFR-1, sVEGFR-1 had virtually no effect on hypoxia-enhanced FGF-2+TNF-α–dependent angiogenesis in our model. This suggests that other mechanisms not related to the expression of and the response to VEGF165 contribute to this hypoxia-induced capillary-like tube formation.
Human endothelial cells invade a fibrin matrix after exposure to an angiogenic growth factor, VEGF165 or FGF-2, and the cytokine TNF-α.18 This process requires cell-bound uPA activity, which depends on the availability of the uPAR.19Wojta et al38 reported a decrease in uPA activity after hypoxic treatment of endothelial cells due to an increased production of PAI-1. In the present study we also found a dramatic decrease in the amount of uPA antigen that accumulated in the conditioned medium. However, we did not detect an increase in the PAI-1 antigen nor a decrease in the uPA mRNA. By the use of an mAb that prevented the interaction of uPA with its receptor, it was demonstrated that the decrease in uPA accumulation was caused by a uPAR–mediated process. Probably it reflects the cellular uptake of the uPA:PAI-1 complex.58 The increase in the uPAR expression by hypoxia found in our hMVECs closely agrees with similar findings in other cell types, ie, throphoblasts, HUVECs, and breast carcinoma cells.39,59 An increased binding of uPA to its receptor and thus a higher internalization rate of uPA can efficiently deplete the conditioned medium of uPA.19 Because uPA is taken up by the cell only after activation and subsequent inhibition by PAI-1,60 the decrease in uPA not only reflects the cellular consumption of uPA, but it also reflects the fact that uPA had been active, probably on the cell surface. This is also proven by an increased plasmin formation in hypoxic conditions.
In line with our previous observations that the uPA:uPAR interaction is required for tube formation in a fibrin matrix and that modulation of the uPAR expression influences the rate of this process,18 19 the higher expression of uPAR and consequently a higher plasmin formation are likely to contribute to the increased angiogenic response of hMVECs under hypoxic conditions. In pericellular proteolysis, the uPA/plasmin and MMP cascades often cooperate. One may expect that hypoxia alters the expression of MMPs. Under our experimental conditions we observed that there was no difference in the expression of the mRNA of MMP-1 and MMP-3 as compared to the normoxic conditions. Similarly the expression of MMP-2 and MMP-9 remained unaltered, as revealed by gelatin zymography (our unpublished data). However, these data do not exclude the possibility that another proteolytic enzyme or an unknown proangiogenic factor is influenced by hypoxia.
The mechanism by which hypoxia increases the expression of uPAR is not yet known. Cobalt chloride, nickel chloride, and deferoxamine could not mimic the hypoxic response in our system, indicating that a heme protein was not involved. This finding is in contradiction to the studies of Graham et al,39,59 who suggested the involvement of a heme protein in uPAR induction. The difference in these results is not easy to explain. Probably they are caused by the use of different cell types or the different time scale in which the experiments were performed (24 hours compared to 72 hours in this study). In addition to the involvement of a heme protein, redox-based signaling is indicated as a possible oxygen-sensing mechanism.61,62 The activity of a well-studied hypoxia-induced transcription factor–1 (HIF-1) has been linked to the redox state of the cell.63 Three potential HIF-1 binding sequences can be found in the 5′-flanking region of theuPAR gene,39 indicating that hypoxia can directly influence uPAR transcription. In addition or alternatively to its effect on gene transcription, hypoxia may also increase the stability of the uPAR expression. Because hypoxia also affects the expression of other proteins, such as VEGF16557and erythropoietin,64 by increasing mRNA stability, this is a plausible option.
In addition to matrix degradation, the ability of the endothelial cells to re-adhere to this matrix is also indispensable for invasion. The matrix-receptors, αvβ3- and αvβ5-integrins, bind to vitronectin and other matrix proteins.37 These integrins play essential roles in cell migration65 and angiogenesis.55,66 It has previously been shown in bovine retinal endothelial cells that the expression of αv-, β3-, and β5-subunits is increased in response to hypoxia36 and in this manner may promote cell migration. In hMVECs the αv-subunit mRNA expression is enhanced after 16 hours of hypoxia, while the expression of the β5-integrin subunits is not altered by hypoxia. The β3-integrin mRNA was not detectable by Northern blot, probably due to its low expression in human endothelial cells.47 Although the αv-subunit is regulated by hypoxia and may lead to a higher expression of integrins containing the αv-subunit, hypoxia-induced tube formation was not influenced by αvβ3- or αvβ5-blocking antibodies. The possibility that other integrins present on endothelial cells may interact with fibrin cannot be excluded.
In conclusion, this study shows that endothelial cells by themselves are able to increase their angiogenic potential in response to hypoxia. In our experimental conditions, the increase of uPAR expression by hypoxia appears an important determinant in this process. We would like to stress that angiogenesis in different conditions is regulated by a number of regulators and that our findings reflect angiogenesis in the temporary repair matrix fibrin. In other conditions, such as development and bone repair, the role of uPA and uPAR may be less prominent, and other proteins, such as MMPs, play a dominant role. We conclude that cell bound uPA is an important determinant in capillary-like tube formation in fibrin matrices. In particular, it is anticipated to act in particular in the recanalization of fibrin clots and fibrous exudates in addition to the paracrine effects of hypoxia involving the induction of VEGF165 by adjacent tissue cells.
Acknowledgments
We would like to thank Erna Peters and Mario Vermeer for their excellent technical assistance.
Supported by grant 95.193 from The Netherlands Heart Foundation, The Hague, The Netherlands, and grant TNOP 97-1511 from The Dutch Cancer Society, Amsterdam, The Netherlands.
The publication costs of this article were defrayed in part by page charge payment. Therefore, and solely to indicate this fact, this article is hereby marked “advertisement” in accordance with 18 U.S.C. section 1734.
References
Author notes
Victor W. M. van Hinsbergh, Gaubius Laboratory TNO-PG, PO Box 2215, 2301 CE Leiden, The Netherlands; e-mail: vwm.vanhinsbergh@pg.tno.nl.

This feature is available to Subscribers Only
Sign In or Create an Account Close Modal