Circulating endothelial cells (CECs) were enumerated in 20 healthy controls and 76 newly diagnosed cancer patients by means of 4-color flow cytometry. In breast cancer (n = 46) and lymphoma (n = 30) patients, both resting and activated CECs were increased by 5-fold (P < .0008 vs control). CECs significantly correlated with plasma levels of vascular cell adhesion molecule-1 and vascular endothelial growth factor. Resting and activated CECs were similar to healthy controls in 7 lymphoma patients achieving complete remission after chemotherapy, and activated CECs were found to decrease in 13 breast cancer patients evaluated before and 24 hours after quadrantectomy.
Introduction
Circulating endothelial cells (CECs) have been found to be increased in the peripheral blood (PB) of patients affected by sickle cell anemia,1 cytomegalovirus,2rickettsial3 infection, myocardial infarction, and endotoxinemia.4,5 Moreover, increased CECs have been reported in patients bearing intravascular instrumentation.6 Considering that the generation of new blood vessels (angiogenesis) and co-option of preexisting vessels are crucial steps in cancer progression,7 8 we developed a novel 4-color flow cytometry procedure to measure CECs and circulating endothelial cell progenitors (CEPs) in cancer patients. Studies were performed in whole blood with commercially available monoclonal antibodies.
Study design
PB was collected in ethylenediaminetetraacetic acid (EDTA) tubes through 21G needles in 76 newly diagnosed cancer patients (30 with lymphoma and 46 with breast cancer [BC]) and 20 controls. Among lymphoma patients, 28 had B-cell low-grade (n = 16, including 8 patients with chronic lymphocytic lymphoma) or high-grade (n = 12) non-Hodgkin lymphoma and 2 had Hodgkin disease. Five lymphoma patients (1 mantle cell, 1 marginal zone, 3 chonic lymphocytic lymphoma) had leukemic disease. Among 46 BC patients, all with infiltrating duct carcinoma, 9 were in stage N0, 10 had axillary lymph node metastases, and 27 had distant metastatic diseases. Patients bearing intravascular instrumentation were excluded from the study.
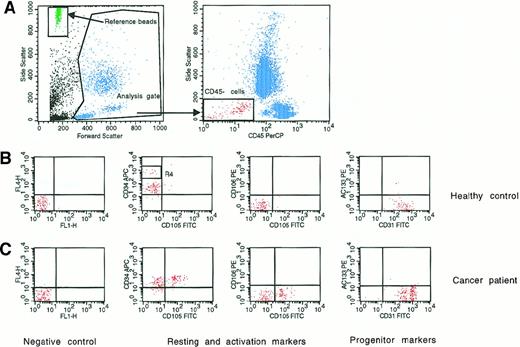
A panel of monoclonal antibodies, including anti-CD45 to exclude hematopoietic cells, anti-CD31, -CD34, -CD36, -CD105, -CD106, -CD133, and -P1H12,1,9 and appropriate analysis gates (Figure1) were used to enumerate resting and activated CECs and CEPs. Monoclonal antibodies (Table1) were conjugated with fluorescein isothiocyanate (FITC), R-phycoerythrin (PE), peridinin chlorophyll protein (PerCP), or allophycocyanin (APC), and cell suspensions were evaluated by a FACSCalibur equipped with a second red-diode laser (Becton Dickinson, San Jose, CA). Absolute cell numbers were calculated by reference fluorescent beads, and “lyse-no-wash” procedures were used to increase sensitivity and reproducibility.10 After acquisition of at least 100 000 cells per PB sample, analyses were considered as informative when adequate numbers of events (> 100, typically 3-400) were collected in the CEC enumeration gates.
Four-color flow cytometry evaluation of circulating endothelial cells and endothelial progenitors.
(A) Representative panel (left) shows the analysis gate used to exclude platelets, death cells, and debris and the reference beads used to obtain absolute cell count. The other panel (right) shows the gate used to exclude hematopoietic cells expressing the CD45 antigen. (B,C) Middle and bottom panels indicate negative controls and the expression of antigens used to evaluate resting (CD31 and CD34), activated (CD105 and CD106), and progenitor (CD133) endothelial cells. (B) Middle panels show the resting phenotype of a representative healthy control; (C) bottom panels show the more activated phenotype of a representative newly diagnosed BC patient. R4 indicates CD45-hematopoietic progenitors depicted by high CD34 expression.
Target antigens, related cluster designations, antibody clones, and conjugation of monoclonal antibodies used in the study
| Antigen . | Cluster designation . | Antibody clone . | Conjugation . |
|---|---|---|---|
| PECAM-1 | CD31 | WM59* | FITC |
| Glycoprotein 105-120 | CD34 | HPCA-2† | APC |
| LCA | CD45 | 2D1† | PerCP |
| Endoglin | CD105 | 8E11‡ | FITC |
| VCAM-1 | CD106 | 5110C9* | PE |
| AC133 | CD133 | AC133/11-153 | PE |
| P1H12 | Not yet designated | P1H121-155 | FITC |
PECAM-1 indicates platelet endothelial cell adhesion molecule-1; LCA, leukocyte common antigen; VCAM-1, vascular cell adhesion molecule-1; FITC, fluorescein isothiocyanate; APC, allophycocyanin; PerCP, peridinin chlorophyll protein; PE, R-phycoerythrin.
Products were supplied by BD Pharmingen (San Diego, CA).
Products were supplied by BD (Mountain View, CA).
Products were supplied by Euroclone (Devon, United Kingdom).
Products were supplied by Miltenyi (Bergisch Gladbach, Germany).
Products were supplied by Chemicon (Temecula, CA).
Resting CECs were defined as negative for hematopoietic marker CD45; positive for endothelial markers P1H12, CD31, and CD34; negative for activation markers CD105 and CD106; and negative for the progenitor marker CD133. Activated CECs were defined as CD45−, P1H12+, CD31+, CD34+, CD105 or CD106+, and CD133−. According to Rafii,11 CEPs were depicted by expression of CD133. Although some of the monoclonal antibodies used in our CEC panel (namely, CD31, CD34, CD105, and CD133) react with defined hematopoietic cell populations in addition to CECs, the P1H12 monoclonal antibody is highly specific as an endothelial marker. Unlike other commonly used endothelial markers, P1H12 specifically localizes to endothelial cells of all vessels including cancerous tissues and does not react with hematopoietic or epithelial cells.9 Regarding activated CEC markers, high levels of CD105 (endoglin), a receptor for transforming growth factor-β, and vascular cell adhesion molecule-1 (VCAM-1) are currently considered hallmarks of activated endothelial cells either in vitro and in tissues undergoing angiogenesis in vivo.12 13
Sensitivity and specificity of our procedure were evaluated by serial dilution of human umbilical cord endothelial cells (expressing an “activated CEC” phenotype) in the U-937 cell line. The detection limit of our procedure was 0.1 cell/μL, and specificity was more than 90%. Anti-CD34 antibodies conjugated with APC, when compared with PE, have decreased mean fluorescence intensity.10 Although most CD34+ hematopoietic progenitors were excluded from our analysis gate by CD45 expression,10 APC-conjugated anti-CD34 was useful to discriminate between the very tiny population of CD45-hematopoietic progenitors, which were CD34+++(bright), and CD34+ CECs (Figure 1).
Microvessel density (MVD) was evaluated by anti-CD34 staining in paraffin-embedded tumor samples as we described in detail elsewhere.14 In brief, sections were immunostained with CD34-reactive Qbend/10 (Signet Laboratories, Dedham, MA). The substitution of the primary antibody with nonimmune mouse serum was used as negative control. For MVD enumeration, at least 10 fields were evaluated at ×250 magnification (0.78 mm3). Any brown-staining endothelial cell (or cluster) that was clearly separated from adjacent microvessels was considered a single, countable microvessel, and vessel lumens were not a prerequisite to define a structure as a microvessel. In duplicate independent readings, MVD intrareader variability was found to be 14% ± 10% (r = 0.879).
Circulating vascular endothelial growth factor (VEGF) and VCAM-1 were measured in the plasma of patients and controls by commercial enzyme-linked immunosorbent assay kits (R&D Systems, Minneapolis, MN, and Biosource, Camarillo, CA, respectively) as we previously described.15 It has been suggested in the past that VEGF measurements in EDTA-plasma samples may in part reflect VEGF release from activated platelets. As described by Wynendaele et al,16 however, EDTA may influence platelet shape, but no statistically significant difference in VEGF levels is observed in plasma samples collected with EDTA versus plasma samples collected with 4 different anticoagulants (sodium citrate, theophylline, adenosine, and dipyridamole) to obtain maximal platelet stabilization.
Results and discussion
In healthy controls (n = 20), mean values of resting and activated CECs were 7.9/μL (95% confidence interval [CI], 4.7-11.1) and 1.2/μL (95% CI, 0.1-2.3), respectively. Seven female controls were reevaluated during the menstrual period associated with physiologic active angiogenesis. Mean activated CECs were found to increase from 2.4/μL (95% CI, < 0.1-5.5) to 4.4/μL (95% CI, < 0.1-10.5). However, this trend did not reach statistical significance (P = .15 by Wilcoxon matched-pairs test).
In 76 newly diagnosed patients, mean resting and activated CECs were 39.1/μL (95% CI, 16.8-61.4) and 6.8/μL (95% CI, 5.0-8.6), ie, increased by 5-fold (P < .0008 vs control by ANOVA). CEC distribution was normal in controls and skewed in patients. Three of 5 lymphoma patients in leukemic phase contributed to most of the skewing observed in CEC distribution among patients; and lymphoma patients, compared with BC patients, had higher mean resting (78.0/μL [95% CI, 22.8-133.5] vs 15.8/μL [95% CI, 12.0-19.7],P = 0.0078 by ANOVA) and activated (8.7/μL [95% CI, 5.1-12.3] vs 5.6/μL [95% CI, 3.7-7.4], P = 0.18) CECs. Differences between BC patients with early or metastatic diseases were not significant. In controls and patients, the number of CECs did not significantly increase with age. Studies are ongoing to fully understand the clinical features associated with the particularly elevated CEC values observed in some patients, and repeated CEC measurements in patients and controls indicated a low longitudinal CEC variation. Evaluation of CD36 expression showed that in patients and controls at least half of the CECs were microvascular in origin.1 In patients and controls, the count of resting and activated CECs did not correlate with the count of white cells, red cells, or platelets.
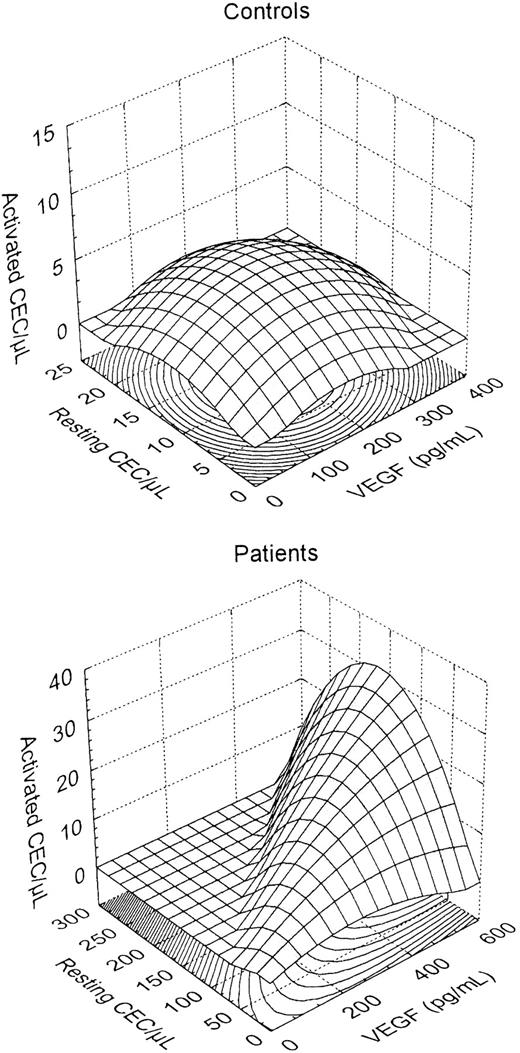
VEGF is produced by most tumor cells7,8 and is involved in CEP mobilization.17 Mean VEGF was 83 pg/mL (95% CI, 27-140) and 192 pg/mL (95% CI, 103-281) in controls and patients, respectively (P = .03 by ANOVA). Correlation between MVD and VEGF and between MVD and CECs did not reach statistical significance. On the other hand, a positive correlation (r = 0.419, P = .009 by multiple regression) was found between CECs per microliter and plasma VEGF. As shown in Figure 2, a normal distribution of resting CECs, activated CECs, and plasma VEGF was observed in controls, whereas a switch to increased VEGF, increased CECs, and activated CEC phenotype was observed in cancer patients. Circulating VCAM-1, a glycoprotein produced by angiogenic endothelial cells, was significantly increased in patients (mean 1496 ng/mL [95% CI, 1161-1831]) compared with controls (838 ng/mL [95% CI, 737-938], P = .003). VCAM-1 strongly correlated with CECs per microliter (r = 0.582,P < .0001) but not with MVD, and lymphoma patients had significantly higher VCAM-1 levels compared with those with BC (P = .002).
Three-dimensional surface plots showing plasma VEGF and resting and activated CECs in healthy subjects and cancer patients.
A normal distribution was prevalent in controls, whereas a switch to increased VEGF, increased CECs, and an activated CEC phenotype was observed in cancer patients.
Three-dimensional surface plots showing plasma VEGF and resting and activated CECs in healthy subjects and cancer patients.
A normal distribution was prevalent in controls, whereas a switch to increased VEGF, increased CECs, and an activated CEC phenotype was observed in cancer patients.
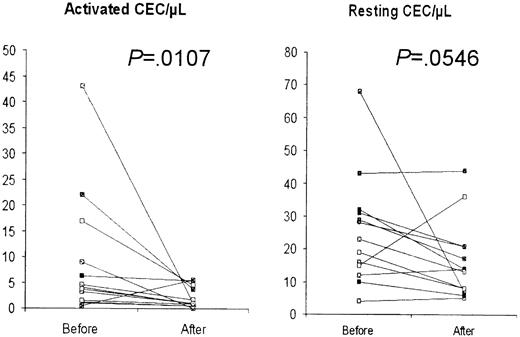
CECs were found to be similar to control values in 7 lymphoma patients who achieved complete remission after chemotherapy. In these patients, mean resting and activated CECs were 12.8/μL (95% CI, 4.0-21.6) and 0.8/μL (95% CI, 0.4-1.2), respectively (P = .0001 and .63 vs newly diagnosed patients and healthy controls, respectively). Furthermore, CECs were found to decrease in 13 BC patients evaluated before and 24 hours after quadrantectomy (Figure3). In these BC patients, activated CECs significantly decreased from 9.0/μL (95% CI, 2.4-15.5) to 2.0/μL (95% CI, 0.9-3.1, P = .0107 by Wilcoxon matched-pairs test), whereas mean resting CECs decreased from 25.3/μL (95% CI, 16.3-34.4) to 16.4/μL (95% CI, 10.0-22.8), and statistical significance was borderline (P = .0546).
CECs in 13 BC patients before and after quadrantectomy.
A decrease was observed in both activated and resting CECs.P values were calculated by the Wilcoxon matched-pairs test.
CECs in 13 BC patients before and after quadrantectomy.
A decrease was observed in both activated and resting CECs.P values were calculated by the Wilcoxon matched-pairs test.
CEPs were below 0.5/μL in all controls and newly diagnosed patients evaluated. Higher CEP counts were found in 4 of 11 patients evaluated while recovering from high-dose chemotherapy-induced aplasia and in 2 of 7 healthy controls evaluated during the menstrual period. In these 6 cases, CEP values ranged from 1.1/μL to 9/μL.
Increased CECs have been described so far only in conditions that have in common the presence of vascular injury.1-6 Our finding that resting and activated CECs are increased in newly diagnosed cancer patients and decline after cure underlines the crucial role of angiogenesis in both solid tumors and hematopoietic malignancies. Moreover, resting and activated CECs appear to be novel and promising surrogate angiogenesis markers. Interestingly, our data about the increase of activated (CD105 or CD106+) CECs in cancer patients offer a rationale for recent reports about the predictive potential of soluble CD105 and CD106 in the PB of BC patients.18 19
The increase of resting and activated CECs in cancer patients may be due to different biological reasons: CECs may derive from newly formed tumor vessels or, alternatively, represent ingress of proliferating endothelial cells from neighboring normal tissue or even from distant uninvolved vessels activated by tumor's derived cytokines. To better distinguish between these hypotheses, we are evaluating CEC kinetic and cell cycle in animal models of human cancer. In parallel, the measurement of CEC viability is currently under investigation to ascertain whether a given drug therapy has antiangiogenic properties.
The publication costs of this article were defrayed in part by page charge payment. Therefore, and solely to indicate this fact, this article is hereby marked “advertisement” in accordance with 18 U.S.C. section 1734.
References
Note added in proof
Chang et al20 have recently provided evidence indicating that tumor blood vessels may be mosaics in which both endothelial and tumor cells form the luminal surface. These data provide a possible explanation for the finding of high CEC numbers in cancer patients.
Author notes
Francesco Bertolini, Hematology-Oncology, European Institute of Oncology, via Ripamonti 435, 20141 Milan, Italy; e-mail: francesco.bertolini@ieo.it.


This feature is available to Subscribers Only
Sign In or Create an Account Close Modal