Abstract
This study introduces a method for monitoring a component of serum non–transferrin-bound iron (NTBI), termed “desferrioxamine-chelatable iron” (DCI). It is measured with the probe fluorescein-desferrioxamine (Fl-DFO), whose fluorescence is stoichiometrically quenched by iron. DCI was found in the serum of most patients with thalassemia major (21 of 27 tested, range 1.5-8.6 μM), but only in a minority of patients with hereditary hemochromatosis (8 of 95 samples from 39 patients, range 0.4- 1.1 μM) and in none of 48 controls. The method was applied to monitoring the appearance of iron in the serum of patients under chelation therapy. Short-term (2 hours) follow-up of patients immediately after oral administration of deferriprone (L1) showed substantial mobilization of DCI into the serum (up to10 μM within 30-60 minutes). The transfer of DCI from L1 to Fl-DFO was observed in vitro with preformed L1-iron complexes, and occurred even at L1/iron ratios exceeding 3:1. Simultaneous administration of oral L1 and intravenous DFO to patients abrogated the L1-mediated rise in DCI, consistent with the shuttling of iron from L1 to DFO in vivo. A similar iron transfer from L1 to apo-transferrin was observed in vitro, lending experimental support to the notion that L1 can shuttle iron in vivo to other high-affinity ligands. These results provide a rationale for using chelator combinations, with the highly permeant L1 acting as an intracellular chelator-shuttle and the less permeant DFO serving as an extracellular iron sink. Potential applications of the DCI assay may be for studying chelator action and as an index of patient chelation status.
Introduction
The capacity of desferrioxamine (DFO) to chelate iron (Fe) and mediate its excretion in Fe-overloaded patients is well documented. DFO is thought to access the pools of Fe in the liver and reticuloendothelial system, which carry a major proportion of the body Fe burden. However, because DFO permeates into cells relatively slowly, due to its large molecular size and hydrophilicity, its efficiency as an intracellular chelator is limited.1-4 Serum Fe constitutes another and more accessible potential target for DFO.2 Although DFO does not mobilize significant amounts of Fe from transferrin (Tf), the Fe-carrier protein of serum, unless exogenous mediators such as nitrilotriacetate (NTA) or citrate are added,5 a substantial proportion of Fe-overloaded patients also have non–transferrin-bound iron (NTBI) in the serum.6-10 NTBI has been assumed to be more labile than Tf-bound Fe and therefore could constitute a potential source of catalytically active Fe and a target for chelation by DFO.7-9 However, in vitro physicochemical measurements in sera of patients with hereditary hemochromatosis showed that DFO did not effectively chelate NTBI.11 Similar studies regarding DFO-accessible pools in sera from patients with thalassemia major were not reported. We have considered the possibility that the nature of NTBI might vary in different patients and might depend on the degree of Fe overload. Thus, sera from patients with thalassemia major, which tend to have higher Tf saturation levels than sera from patients with hemochromatosis, might also contain forms of NTBI that are DFO-chelatable.
In the present work we introduce an assay for DFO-chelatable iron (DCI) based on fluorescein-DFO (Fl-DFO), a probe that has similar Fe-binding properties as DFO but contains a fluorescent reporter group that undergoes quenching on binding of Fe, analogous to our previously published nitrobenzofurazan analog (NBD-DFO).12 The use of the fluorescent Fe-responsive probe allowed us to directly verify the existence of a DFO-chelatable component of NTBI. In addition to determining DCI in serum, the assay enabled us to follow this serum Fe fraction during chelator therapy with deferriprone (L1) and DFO. Previous attempts to quantify the effect of DFO treatment on NTBI levels showed an initial decrease followed by a rebound toward original levels within hours.10,13 These tests differed from the present assay in that they measured the total levels of NTBI mobilized with very high concentrations of agents such as NTA13 or oxalate.10 It is conceivable that a significant proportion of NTBI might never be accessed by a chelator in vivo. By measuring only the fraction of NTBI directly available to DFO, the assay used here provided a measure of the efficiency of chelation of this fraction and, by implication, of the immediate potential benefit that a patient might derive from DFO therapy. The assay also detected significant L1-mediated mobilization of Fe into serum, detected as DCI, indicating that Fe transfer from L1-Fe complexes to DFO can occur. The results provide a mechanistic basis for the efficacy of combined chelator therapy involving simultaneous administration of L1 and DFO,14-16 similar to what has been proposed before for other chelators.17
Patients, materials, and methods
Materials
Ferrous ammonium sulfate (FAS) and NTA were from Sigma Chemical (St Louis, MO); Hepes from Beit Haemek Biological Industry (Kibbutz Beit Haemek, Israel); DFO from Novartis Pharma AG (Basel, Switzerland); and Fl-DFO from Molecular Probes (Eugene, OR). Plastic 96-well plates with clear, flat bottoms were “F96 Maxisorp” from Nunc (Roskilde, Denmark). Hepes-buffered saline (HBS: 150 mM NaCl, 20 mM Hepes, pH 7.3) was rendered Fe-free by mixing with approximately 5% of the volume of chelating resin (Chelex 100, Sigma Chemical) for 5 minutes and removing the beads.
Measurement of Fl-DFO chelatable Fe in serum (DCI)
The principle of the method is outlined in Figure1. Samples of 20 μL serum (defined as “input sample”) or Fe-free HBS (blank) are first placed in quadruplicate in 96-well plates. Two reagent solutions are prepared. Reagent A is Fe-free HBS (150 mM NaCl, 20 mM Hepes, pH 7.3) containing 2.5 μM Fl-DFO, and reagent B: same as reagent A, but contains 100 μM DFO. Both reagents must be used fresh; however, they can be prepared complete, stored frozen at −20°C in portions, and thawed only once. Repeated freeze-thaw is not recommended because it causes loss of fluorescence.
Scheme of the DCI assay.
The scheme depicts the steps of the assay for both normal (left) and NTBI-containing sera (right). The iron is depicted as a filled circle and the Tf molecules denoted by ‘T’. Step 1: Serum samples are mixed with reagent A (HBS containing 2.5 μM fluorescein-DFO [Fl-DFO, *]) or reagent B (same as reagent A, but containing 100 μM DFO, **) in the wells. In reagent A the accessible Fe binds to the Fl-DFO and quenches its fluorescence, whereas in reagent B the Fe binds to the excess nonfluorescent DFO rather than to Fl-DFO. Step 2: Fluorescence is determined after a 2-hour incubation. In normal serum, the ratio of fluorescence of samples treated with reagent A and B is near 1, whereas in Fe-containing serum, the fluorescence in reagent A is lower than in B, giving a ratio less than 1. The ratio of the fluorescence readings (A/B) is inversely proportional to the concentration of DCI in the original sample.
Reagent A (100 μL) is added to 2 of the wells; reagent B (100 μL) is added to the 2 other wells. The plates are then incubated for 2 hours at 37°C. The fluorescence in the wells is determined in a multiwell plate reader (BMG Labtechnologies, Offenburg, Germany) with excitation/emission filters of 485/538 nm and gain of 25. Finally, the ratio between the fluorescence of the samples obtained with reagents A (reading A) and B (reading B) is calculated, and the Fe concentration is derived from the calibration curve.
Construction of an Fe calibration curve
To 0.1 mL of 10 mM FAS freshly prepared in double deionized water (DDW) in a microcentrifuge tube is added 0.1 mL 70 mM NTA, sodium form, pH 7.0, to produce an Fe:NTA (5:35 mM) complex. A serial 1:1 dilution of the Fe:NTA is then performed in Fe-free HBS for up to 12 steps, to give Fe concentrations from 200 μM down to 0.2 μM. Twenty microliters of each Fe concentration is transferred in quadruplicate to 96-well plates and reagents A and B are added, as for serum samples. A plot of the ratio of fluorescence A/B versus the input [Fe] is generated, and the linear portion (0-7 μM Fe) used for calculating the serum [NTBI] values.
Patient treatments
All of the drug treatments carried out in this study were within the framework of the patients' routine therapeutic regimens. Israel: total 11 patients, ages 10 to 16, all with transfusional Fe overload, comprising 8 with thalassemia major, 1 with thalassemia intermedia, and 2 with aplasia. Thailand: total 16 patients, ages 30 to 44, all with non–transfusion-dependent β-thalassemia/Hb E disease. Eight Israeli and 3 Thai patients participated in the short-term kinetic studies. The patients arrived at the clinic in the morning, having been instructed not to take any medications prior to arrival. A serum sample was taken (time 0 minutes) and, immediately afterward, the patient took L1 per os (75 mg/kg). In combined chelator studies, the patient was infused with DFO within 15 minutes after taking L1, for a period of 30 to 60 minutes. The total DFO dose was usually 0.5 to 1 g. Blood samples for DCI determination were taken every 30 minutes for 2 to 2.5 hours. Serum Fe and Tf saturation were measured as described.18
Results
Configuration of the assay for DCI
The assay schematized in Figure 1 is based on the fluorescent, Fe-sensitive probe Fl-DFO, which is quenched on binding of Fe. Fl-DFO responds reliably to Fe when the Fe is presented in a clear, aqueous solution of Fe-NTA (not shown). However, this form of Fe detection cannot be applied to serum samples in a similar manner, because these vary markedly in color and turbidity, both of which can significantly influence the fluorescence signal. Therefore, any decrease in Fl-DFO fluorescence could be due either to the presence of Fe or to some fluorescence-interfering component. This difficulty is overcome by measuring each sample under 2 separate conditions: A, with Fl-DFO only, and B, as in condition A, but in the presence of a large excess of nonfluorescent DFO. The change in fluorescence obtained in condition A is due to the binding of Fe (if any) to Fl-DFO and the possible effect of other, unknown factors in the sample. The fluorescence obtained in condition B is determined only by the other, unknown factors, because the excess DFO sequesters the Fe in the sample, preventing its binding to Fl-DFO. The ratio of the fluorescence signals obtained in the 2 conditions (condition A/condition B) indicates the presence or absence of Fe in the sample. In principle, a ratio A/B = 1 indicates no detectable Fe in the sample, and a ratio A/B < 1 indicates the presence of Fe.
The relative affinities of Fl-DFO and DFO for Fe were compared by premixing Fl-DFO and DFO at equivalent concentrations (2.5 μM) and assaying the response to increasing concentrations of Fe:NTA (1.25-10 μM Fe). DFO decreased the quenching of Fl-DFO by about 50%, indicating that the fluorescein-derived DFO has roughly equal affinity for Fe as DFO (not shown).
Calibration of the DCI assay
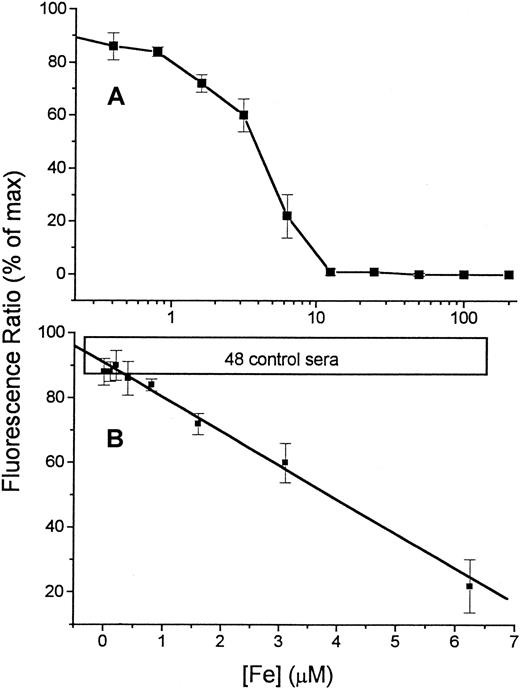
The sensitivity of the assay was examined by measuring the response of Fl-DFO (2.1 μM final concentration) to a series of Fe concentrations in HBS (Figure 2A). The titration with Fe shows that the Fe-binding capacity of the Fl-DFO reagent is fully saturated when the Fe concentration in the input sample is 12.5 μM, giving a final concentration of 2.1 μM in the assay (20 μL input sample is diluted 6-fold by the addition of 100 μL of the 2.5 μM Fl-DFO reagent). This 1:1 quenching ratio matches the predicted stoichiometry of Fl-DFO:Fe because each DFO molecule binds one Fe.1 The linear and reliable range of the titration curve, shown in Figure 2B, corresponds to Fe concentrations of 0.6 to 7.0 μM in the original input sample or 0.1 to 1.1 μM in the assay. Standard curves of the type shown in Figure 2B were used as calibration curves for assessing DCI in serum samples from patients.
Calibration of Fe concentration versus fluorescence.
A series of concentrations of Fe, ranging from 0 to 200 μM (described in “Patients, materials, and methods”), was prepared by serial dilution of Fe:NTA in HBS buffer (input sample). From each dilution 20 μL was transferred to 96-well plates followed by 100 μL 2.5 μM Fl-DFO in HBS. Replicate wells were treated with the same reagents containing in addition 100 μM DFO, to give the “maximal” fluorescence for each sample. The fluorescence ratio (expressed as “% of maximal value” obtained in the presence of excess DFO) was calculated for each sample (see “Patients, materials, and methods”) and plotted semilogarithmically against the concentration of Fe in the original 20-μL input sample (A). The linear region of the calibration curve (0-6.25 μM Fe) is shown in panel B. The values are averages ± SD of 6 separate calibration curves. The boxed area labeled “48 control sera” represents the range of values obtained for serum samples of 48 individuals without Fe overload.
DCI in Fe-overloaded patients
We have used the assay to screen for the presence of serum DCI in patients with Fe overload. Table 1 shows the results obtained in control (non–Fe-overloaded), hereditary hemochromatosis, and thalassemia major individuals. DCI was not detected in 48 random controls. On the other hand, the great majority of patients with transfusional Fe overload were DCI positive. Those with hereditary hemochromatosis, all under phelobotomy treament, showed a much lower frequency, 9% and 0%, for Portuguese and Dutch patients, respectively. It is noteworthy that the patients with hereditary hemochromatosis tested here tended to have lower Tf saturation values (8%-108% for Portuguese and 25%-89% for Dutch patients) than the patients with thalassemia major whose Tf saturations all exceeded 85%.
Desferrioxamine-chelatable iron in iron-overloaded patients
| Group . | Total number . | % DCI (+) samples . | Average of DCI (+) (μM) . | Range of DCI (+) (μM) . |
|---|---|---|---|---|
| Thalassemia major (TL)* | 16 | 91 | 4.9 | 1.7-8.6 |
| Thalassemia major (IL)* | 11 | 69 | 5.3 | 1.5-6.9 |
| HHC (Portugal)† | 30 | 9 | 0.6 | 0.4-1.1 |
| HHC (NL) | 9 | 0 | — | — |
| Controls‡ | 48 | 0 | — | — |
DCI indicates desferrioxamine-chelatable iron; TL, Thailand; IL, Israel; HHC,hereditary hemochromatosis; NL, Netherlands.
Sera from patients with transfusional iron overload, predominantly β-thalassemic children in Israel, and non–transfusion-dependent βE Hb adults in Thailand.
Sera from Portuguese hemochromatosis patients (Oporto area) sampled over a period of several months (1-5 samples per patient, total of 86) during a course of venesection treatment. Calculation of % DCI (+) samples was done on a pool of all of the results.
Randomly selected serum samples from non–Fe-overloaded individuals. All values of < 0.3 μM were taken as negative.
Accessibility of DCI to apo-Tf
We hypothesized that DCI emerges in conditions of very high Tf saturation, where the serum Fe-binding capacity was exceeded, and hence it may be potentially accessible to exogenous apo-Tf. We found that the addition of 0.32 mg/mL apo-Tf (equivalent to 4 μM) to a DCI-positive thalassemia major serum was sufficient to eliminate all detectable DCI (data not shown). Similar results were obtained for sera from 2 other thalassemia major individuals. The ready accessibility of DCI to apo-Tf confirms the hypothesis that it may arise when the serum Fe-binding capacity is exceeded. However, among the DCI-positive samples from hereditary hemochromatosis patients there were 3 with Tf saturations below 40% (data not shown), indicating DCI might not always represent apo-Tf–accessible Fe.
Accumulation of DCI in patients undergoing treatment with L1
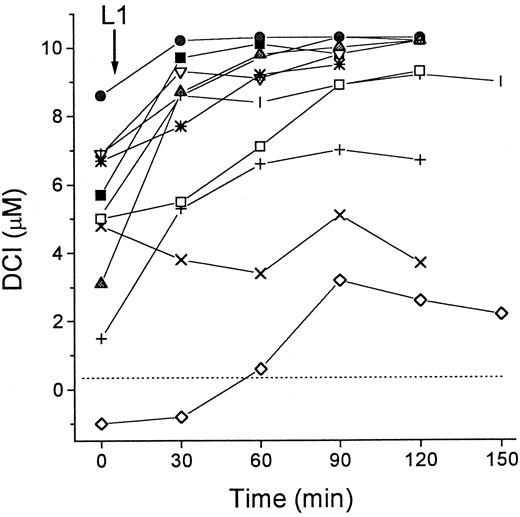
We investigated the effect of L1 on the levels of DCI in sera of patients with thalassemia major. As shown in Figure3, the patients showed various levels of DCI at the onset of the treatment, which increased by 1.5 to 7.0 μM in 10 of 11 cases after oral administration of L1. The L1-mobilized Fe remained elevated for at least 2 hours after administration of the chelator. Because parallel determination of total serum Fe by the acid-bathophenanthroline method indicated an average increase of 10 ± 4 μM 1 hour after L1 administration (not shown), the values of DCI obtained during L1 treatment account for most but not all of the mobilized Fe.
DCI in patients during L1 therapy.
Blood samples from 11 patients with thalassemia major were taken immediately before (0 minute) and at intervals of 30 minutes after administration of L1 (75 mg/kg) per os. Two groups of patients were tested, 8 in Israel (open symbols) and 3 in Thailand (filled symbols). Serum was isolated from the samples after overnight storage at 4°C, and stored frozen. All samples were assayed for DCI in duplicate as described in “Patients, materials, and methods.” Dashed line indicates 0 value.
The above observations could be explained by 2 major mechanisms of L1-mediated drug action: (1) Fe mobilization from serum Tf or from NTBI, particularly with Fl-DFO present and (2) Fe mobilization from cells and its appearance in the serum in forms that can be transferred to Fl-DFO. We assessed the feasibility of mechanism one by treating in vitro 6 different sera from thalassemia major and hemochromatotic patients with 100 μM L1 and 2 μM Fl-DFO. We found that despite the fact that all the selected sera had high Tf saturations (> 80%) and all had substantial NTBI levels (data not shown), the L1-dependent increase in DCI was detected in only 2 cases and neither one exceeded 1.5 μM Fe (data not shown). Therefore, a possible mobilization of Fe from Tf or from NTBI is not a likely explanation for the above results. Nonetheless, it cannot be excluded that in in vivo conditions, where the serum concentrations of DFO exceed those used in our assay by more than 10-fold, L1 might promote DFO-mediated extraction of Fe from Tf.
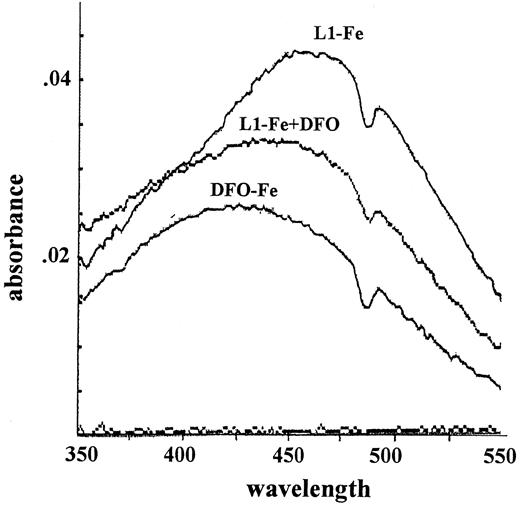
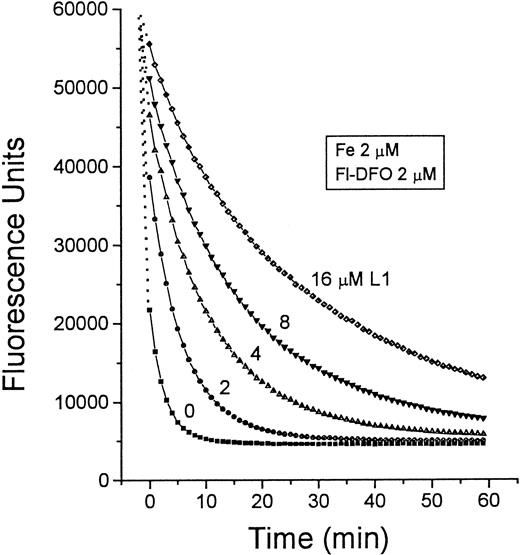
Mechanism two relies on the transfer of Fe from L1 to DFO. The pM values of L1 and DFO, which reflect their affinities for Fe in solutions containing physiologic salt concentrations and pH 7.4, are 19.4 and 26, respectively.19 Thus, at roughly equivalent concentrations of L1 and DFO, a potential transfer of Fe from L1 to DFO can be anticipated. We tested this possibility first by measuring the absorbance of complexes of Fe with L1 and DFO (Figure4). The maximum absorbances of L1-Fe and DFO-Fe complexes occur at 450 to 470 nm and 430 to 460 nm, respectively. When 50 μM DFO was added to preformed L1-Fe complexes formed by 100 μM L1 plus 10 μM Fe, the absorbance peak characteristic of L1-Fe shifted to that characteristic of DFO-Fe. These chelator concentrations are within the range found in vivo during chelation therapy, indicating that transfer of Fe from L1 to DFO could indeed occur. This phenomenon was also observed using Fl-DFO (2 μM) when added to preformed L1-Fe complexes containing a fixed Fe concentration (2 μM) with increasing L1 ratios from 1:1 to 8:1 (Figure 5). Although L1 slowed down the transfer of Fe to Fl-DFO in a concentration-dependent manner, it did not prevent it. A significant fraction of the L1-bound Fe was transferred to Fl-DFO even at an L1:Fe ratio of 8:1, albeit with a t1/2 of 22 minutes compared to less than 1 minute in the absence of L1. We also analyzed the steady-state distribution of Fe (2 μM) between L1 and Fl-DFO (after 2 hours of incubation). The concentration of L1 required for 50% prevention of Fl-DFO quenching was 80 μM, or a 40-fold excess over Fl-DFO (data not shown).
Spectrophotometric determination of Fe transfer from L1 to DFO.
A complex of L1-Fe was formed by mixing Fe and NTA (5 mM FAS:35 mM NTA) with L1 to give final concentrations of 100 μM L1 and 10 μM Fe, followed by incubation for 1 hour at room temperature. A spectrum (range, 350-550 nm) of the L1-Fe complex was obtained (“L1-Fe complex”), followed by addition of 50 μM DFO to the cuvette, incubation for 10 minutes, and determination of a second spectrum (“L1-Fe complex + DFO”). The “DFO-Fe complex” was generated by mixing Fe and NTA (5 mM FAS:35 mM NTA) with DFO, to give final concentrations of 50 μM DFO and 10 μM Fe and incubating for 1 hour. The absorbance dip at 470 nm is due to instrument noise.
Time dependence of Fe transfer from L1 to Fl-DFO.
Preformed L1-Fe complexes containing 2 μM Fe and increasing concentrations of L1 (0-16 μM) were prepared from Fe:NTA and L1 as described in Figure 4. At 0 minute, 20 μL of each solution was mixed with 100 μL 2.5 μM Fl-DFO in HBS, and the fluorescence was monitored with time. The final concentrations of both Fe and Fl-DFO were 2 μM in each system, whereas the concentration of L1 (μM) varied: ▪, 0; ●, 2; ▴, 4; ▾, 8; ♦, 16.
Transfer of Fe from L1 to apo-Tf
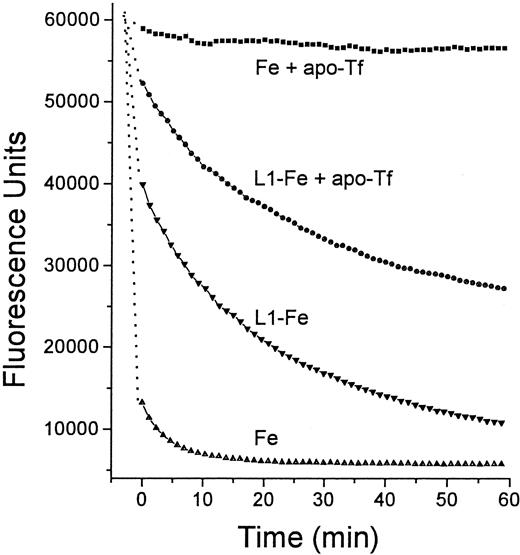
The finding of Fe transfer from L1 to DFO prompted us to test whether a similar process can occur with other high-affinity ligands, such as apo-Tf. To assess this possibility, HBS containing L1-Fe complexes composed of 100 μM L1 and 30 μM Fe+++ was mixed with apo-Tf (25 μM) and incubated for 30 minutes. The high-molecular-weight components (apo-Tf and Tf-Fe) were separated from the low-molecular-weight components (L1 and L1-Fe) by ultrafiltration on a 10 000 D cut-off microfilter. The concentrations of the remaining L1-Fe in the filtrate and of the newly generated Tf-Fe in the retentate were determined by absorbance at 460 nm. Under the above conditions, 35% of the L1-bound Fe was transferred to apo-Tf. We confirmed this finding indirectly, by measuring the effect of apo-Tf on the transfer of Fe from L1:Fe complexes to Fl-DFO. Preformed L1-Fe complex (ratio 8.4:1) was incubated with apo-Tf (ratio of L1 to apo-Tf, 4:1) for 15 minutes at room temperature, followed by the addition of Fl-DFO (ratio of L1:Fl-DFO, 7.9:1) and monitoring of its fluorescence quenching (final concentrations of L1, Fe, apo-Tf, and Fl-DFO in the reaction mixture were 14.3, 1.7, 3.6, and 1.8 μM, respectively) (Figure6). Apo-Tf substantially decreased the rate of transfer of Fe from L1-Fe to Fl-DFO, as shown by the increased t1/2 (time required to produce 50% quenching of Fl-DFO) from 7.5 minutes to ∼60 minutes in the absence and presence of apo-Tf. We attribute this effect to sequestration of Fe from L1-Fe by apo-Tf, which results in a lowered concentration of available Fe in the system.
Time dependence of Fe transfer from L1 to apo-Tf.
Two solutions were prepared in HBS, one containing 12 μM Fe as Fe:NTA, and the other preformed L1-Fe complexes containing 100 μM L1 and 12 μM Fe. From each solution 20 μL was mixed with an equal volume of either HBS or HBS containing 25 μM apo-Tf, and incubated for 15 minutes at room temperature. To each mixture was added 100 μL 2.5 μM Fl-DFO in HBS and the fluorescence was monitored with time: ▪, Fe + apo-Tf; ●, L1-Fe + apo-Tf; ▾, L1-Fe; ▴, Fe alone. The final concentrations of L1, Fe, apo-Tf, and Fl-DFO in the reaction mixture were 14.3, 1.7, 3.6, and 1.8 μM, respectively.
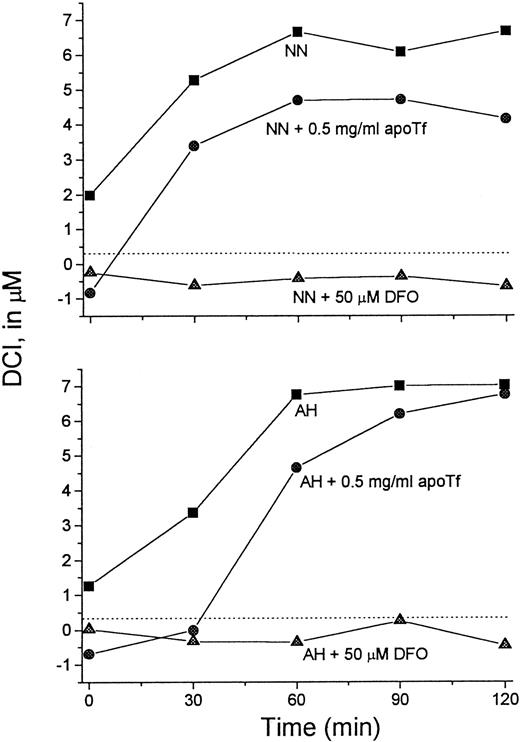
It was of interest to test whether transfer of Fe from L1 to apo-Tf can occur at L1 concentrations achieved in vivo. For this purpose we used serum samples taken from patients immediately after L1 administration, such as shown in Figure 3. Sera from 2 patients were mixed with apo-Tf or DFO (final concentrations 0.5 mg/mL and 50 μM, respectively) for 15 minutes at room temperature and assayed for DCI (Figure 7). Addition of DFO to the samples resulted in the loss of detectable DCI. Apo-Tf completely abrogated the detectable DCI in 0-time samples (taken before L1 administration) and decreased it by 32% at 60 minutes in both sera, indicating that at least partial Fe transfer from L1 to apo-Tf could occur at concentrations of L1 reached in vivo.
Apo-Tf extracts Fe from L1-Fe complexes formed in vivo.
Serum samples taken from 2 patients (NN and AH) immediately after L1 administration (▪) (Figure 3) were mixed with apo-Tf (●) or DFO (▴) (final concentrations 0.5 mg/mL and 50 μM, respectively) for 15 minutes at room temperature. The samples were then assayed for DCI as described. Dashed line indicates 0 value.
DCI levels during L1-DFO combination therapy
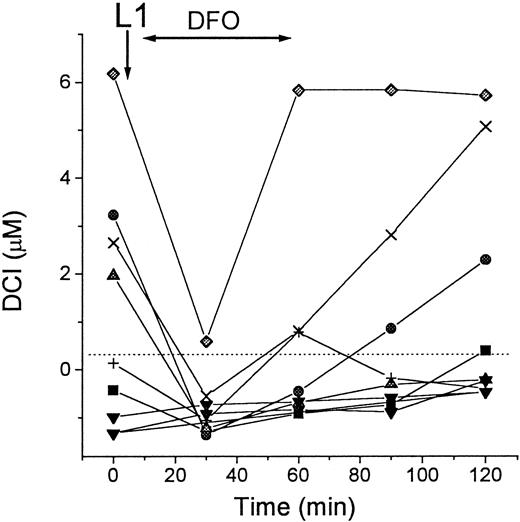
The capacity of L1 to mobilize Fe and then transfer it to DFO has implications for the potential uses of the 2 chelators in combination. We tested the possibility that such transfer can occur in vivo, by measuring DCI in patients' sera during simultaneous treatment with L1 and DFO. As shown in Figure 8, intravenous infusion of DFO immediately after oral administration of L1 prevented the rapid rise in DCI, which was found with L1 alone (Figure3). We infer from the results that DFO chelated all of the L1-mobilized Fe in the circulation, thus preventing the detection of DCI in the sera, at least at the 30-minute time point. The rebound of DCI in 3 of the patients at the end of the DFO infusion is attributable to an excess of L1-Fe complexes over DFO in the circulation. This may be due to the rapid removal of DFO or due to a gradual accumulation of L1-Fe complexes, which eventually overwhelms the binding capacity of the DFO, or both.
DCI in patients during L1-DFO combination therapy.
Blood samples of 8 patients with thalassemia major were taken immediately before (0 minutes) and at intervals of 30 minutes after oral administration of L1, followed by 30- to 60-minute intravenous infusion of DFO (shown by arrows). Serum was obtained from the blood samples after overnight storage at 4°C and subsequently stored frozen. All samples were assayed for DCI in duplicate as described in “Patients, materials, and methods.” Dashed line indicates 0 value.
Discussion
In the present paper we introduce an assay for the direct detection of DCI in serum, which makes use of the Fe-sensitive probe Fl-DFO. It has the advantages of simplicity, relatively low cost, and high throughput capacity. The present assay differs fundamentally from previously published assays for the determination of serum NTBI, a component found in sera of patients with various Fe-overload conditions and imbalances of Fe metabolism.6-10 Whereas assays for NTBI use mobilizing agents for rendering the NTBI accessible to a chelator or probe, the method presented here does not. The distinctive feature of this approach is that only the directly DFO-accessible fraction of serum Fe is detected. Because DFO is in widespread use for the treatment of Fe-overload conditions, the present study has clinical and pharmacologic implications.
DCI and NTBI
We hypothesize that the DCI represents a subfraction of NTBI, on the basis of 3 premises: (1) previous studies have shown that although DFO has a higher affinity for Fe than Tf, it removes little Tf-bound Fe, due to its slow kinetics.5 In the present study, 13 of a total of 95 hemochromatotic serum samples tested, which had Tf saturations above 80% (range, 81%-97%), lacked detectable DCI levels (not shown). Therefore, we assume that DCI is not derived from Tf but is associated with some components of NTBI. We also confirmed this directly, by showing that DCI was retained in a thalassemia major serum sample, even after Tf was quantitatively removed from it with agarose beads carrying anti-Tf antibody (data not shown). (2) NTBI is probably comprised of heterogeneous forms of Fe complexes, some of which might not be directly accessible to DFO. This was implicit in a study carried out on hemochromatotic sera, using high-resolution nuclear magnetic resonance.11 The studies showed that citrate and citrate-acetate-Fe complexes are components of NTBI but are chelated by DFO at a very slow rate, even at high chelator concentrations (mM). Also, the prior mobilization of NTBI with agents such as EDTA, citrate,6 NTA,20 or oxalate10 was necessary for its detection in various NTBI assays. (3) Nine hemochromatotic sera from the Netherlands were all found to be negative for DCI (Table 1). These sera were also tested for NTBI, using an assay in which NTBI is mobilized with oxalate.10 Five of the 9 sera contained NTBI (range, 0.9-4.5 μM). Therefore, DCI is an operational definition for a fraction of serum Fe, which is probably a component of NTBI but not necessarily synonymous with it.
Methodologic aspects of the DCI assay
Variability due to the combination of pipetting errors and instrument noise of the fluorescent plate reader is usually less than 10%, based on duplicate samples in the same microplate. The reproducibility of the assay was assessed by repeated tests of several sera. The day-to-day variability of DCI values did not exceed 15%. We established an empirical value for 0 μM DCI based on values obtained with 48 sera from individuals without Fe overload (Figure 2B). The highest DCI value in this group was 0.3 μM, and it was adopted as the 0 value in our system. A number of sera gave strongly negative DCI values. These are evidently artifactual, although they have also been obtained in other NTBI tests.8-10,20 21 Although the source of the negative values is unclear, they are apparently due to the removal of contaminant Fe by the Fe-binding activity in the sera, as illustrated in Figures 4 and 8, where the addition of apo-Tf or DFO to the samples caused the generation of negative values. Therefore all concentrations less than 0.3 μM were considered DCI-negative, and this zero value is indicated by dashed lines in the figures.
The fluorescence of the probe Fl-DFO is quenched by Cu+ and Cu++, Co+++, and Fe++ and Fe+++, but not by Ca++, Mg++, Zn++, Cd++, or Mn++.22Fl-DFO, like DFO itself, binds Al+++ and Ga+++, but it is not quenched by them (data not shown). Because neither Cu nor Co are likely to be found in serum at micromolar concentrations, we assume that the signals obtained in the assay are solely due to Fe.
Mobilization of Fe by L1 and its transfer to DFO in vitro and in vivo
The detection of increased DCI in patients' sera immediately after L1 administration (Figure 3) was interpreted to result from L1-mediated Fe mobilization from tissues followed by transfer to Fl-DFO in the in vitro assay. This conclusion was based on the documented capacity of L1 to mobilize Fe in vivo23 and from cells in vitro4 and to transfer it to Fl-DFO in vitro (Figure 5). Moreover, we found that the increase in serum Fe induced by L1 and identified as DCI (Figure 3), was paralleled by an increase in the total serum Fe content measured by the acid-bathophenanthroline method (data not shown).
Because the Fe was most likely mobilized into the serum in the form of L1-Fe complexes and its detection by Fl-DFO involved metal transfer from L1 to DFO, it was essential to demonstrate that such transfer indeed occurs. First we used in vitro preformed L1-Fe complexes and measured spectrophotometrically the change in the optical absorbance of L1-Fe evoked by addition of DFO (Figure 4). The concentrations of L1 and DFO in the experiment approximated those observed in vivo. The transfer of the metal from L1-Fe to DFO was reflected by a decrease in the original L1-Fe and an increase in the newly formed DFO-Fe. Second, we also showed that Fe is readily transferred from L1-Fe complexes to Fl-DFO (Figure 5). Although the kinetics of transfer were markedly slowed down by increasing L1/DFO concentration ratios, almost complete transfer was eventually attained even when L1 was present in 8-fold excess over Fe and DFO.
Like DFO, apo-Tf is another high-affinity ligand that could compete in vivo for L1-bound Fe. We confirmed this possibility in vitro by measuring the capacity of apo-Tf to sequester Fe from L1-Fe complexes and render it unavailable for binding to Fl-DFO (Figure 6). In addition, we could show that apo-Tf had the same effect on L1-Fe complexes formed in vivo, that is, in sera taken from patients during L1 therapy (Figure 7). The transfer of Fe from L1 to apo-Tf implied by these results conforms with the observation of Evans and coworkers,24 that administration of L1 to a healthy individual led to a gradual rise of Tf saturation from 20% to 80% over 6 hours as determined by urea gel electrophoresis. This striking observation can be explained by L1-mediated mobilization of Fe and its transfer to apo-Tf.
Implications for combination L1-DFO therapy
The present results provide experimental support for the idea of enhancing the efficacy of chelation by the simultaneous administration of L1 and DFO to patients.14-16 The rationale for such therapy would be that a chelator with a high Fe-mobilizing capacity (L1), but with a tendency to give up its Fe to other high-affinity ligands, is complemented by a second chelator with a lower mobilizing activity (DFO) and a tendency to retain its Fe. Presumably, by removing Fe from L1-Fe complexes, DFO would regenerate free L1, resulting in higher L1 activity in serum and greater Fe-mobilization capacity. Conversely, by supplying mobilized Fe to circulating DFO, L1 would maximize DFO chelating potential and minimize the wasteful excretion of the uncomplexed form. Furthermore, in patients with some serum Fe-binding capacity, the efficiency of L1 might be impaired due to transfer of Fe to partially saturated Tf. The presence of DFO would counteract such futile cycling of Fe. Some of these principles were originally tested with the permeant tridentate chelator salicylaldehyde hydrazone in combination with DFO in a cell model of malaria.17
Potential applications of the assay
A potential use of the assay could be as an index of the chelation status of patients who are actively undergoing or are candidates for chelation therapy. Although the absence of DCI from a patient's serum would not necessarily mean that the patient is well chelated, its presence would be a clear indication that more aggressive chelation therapy is warranted. Future applications of the assay include its adaptation to measurements of serum NTBI requiring Fe mobilization by shuttle agents (Breuer and coworkers, in preparation).
Acknowledgments
We would like to thank the staff and patients at the Childrens' Day Hospital, Shaare Zedek Medical Center, Jerusalem, Israel, and at the Thalassemia Research Center, Institute of Science and Technology for Research and Development, Mahidol University, Salaya Campus, Thailand, and Pornpan Sirankapracha and Rawiprapa Khumbunlue for their assistance and cooperation. We are grateful to Drs Carla Sofia Cardoso, Graca Porto (IBMC and ICBAS, Porto, Portugal) and Prof J. J. M. Marx (Utrecht University, The Netherlands) for providing sera from hemochromatosis patients, and to the partners of the Biomed II group for advice and encouragement.
Supported in part by a grant from the Israel Science Foundation, by Biomed II Programme of the European Economic Community, and by National Institutes of Health grant 54199-02.
The publication costs of this article were defrayed in part by page charge payment. Therefore, and solely to indicate this fact, this article is hereby marked “advertisement” in accordance with 18 U.S.C. section 1734.
References
Author notes
William Breuer, Department of Biological Chemistry, Institute of Life Sciences, Hebrew University of Jerusalem, Jerusalem 91904, Israel; e-mail: billb@vms.huji.ac.il.

![Fig. 1. Scheme of the DCI assay. / The scheme depicts the steps of the assay for both normal (left) and NTBI-containing sera (right). The iron is depicted as a filled circle and the Tf molecules denoted by ‘T’. Step 1: Serum samples are mixed with reagent A (HBS containing 2.5 μM fluorescein-DFO [Fl-DFO, *]) or reagent B (same as reagent A, but containing 100 μM DFO, **) in the wells. In reagent A the accessible Fe binds to the Fl-DFO and quenches its fluorescence, whereas in reagent B the Fe binds to the excess nonfluorescent DFO rather than to Fl-DFO. Step 2: Fluorescence is determined after a 2-hour incubation. In normal serum, the ratio of fluorescence of samples treated with reagent A and B is near 1, whereas in Fe-containing serum, the fluorescence in reagent A is lower than in B, giving a ratio less than 1. The ratio of the fluorescence readings (A/B) is inversely proportional to the concentration of DCI in the original sample.](https://ash.silverchair-cdn.com/ash/content_public/journal/blood/97/3/10.1182_blood.v97.3.792/6/m_h80310628001.jpeg?Expires=1769881155&Signature=L4BXLB~JxCPTqhkLA7qvmc4c5nIvwKvvD9P1R5sISdOPMFAK2ejJfuYVrSHAZlHq1juvcdcack3rQ9Dsg1Cc5j7fkV5IgaCuBEFugUhzXV5NP0vYpRlvtrLs7VO7DAQki51v8vxynFS0MFXi6wxKtXv43MjI-h3bxa3OawCBSNIKsdDdazAiZiyCMnLVm~gaDECIV1ia3IJMj13QRMrFGYBXzCX0gO4DyvowHUrza1MBdCGdtlXsho8UfYToScSViV6uzkayYqdsYH1X99jzUNUGk6UlD3jOvCCHrkFz4QKseh0LS08kFjfpnV3Zm36e9syEnhHH-zFn3CzvfpiR4Q__&Key-Pair-Id=APKAIE5G5CRDK6RD3PGA)
This feature is available to Subscribers Only
Sign In or Create an Account Close Modal