Abstract
DYRKs are a new subfamily of dual-specificity kinases that was originally discovered on the basis of homology to Yak1, an inhibitor of cell cycle progression in yeast. At present, mDYRK-3 and mDYRK-2 have been cloned, and mDYRK-3 has been characterized with respect to kinase activity, expression among tissues and hematopoietic cells, and possible function during erythropoiesis. In sequence, mDYRK-3 diverges markedly in noncatalytic domains from mDYRK-2 and mDYRK-1a, but is 91.3% identical overall to hDYRK-3. Catalytically, mDYRK-3 readily phosphorylated myelin basic protein (but not histone 2B) and also appeared to autophosphorylate in vitro. Expression of mDYRK-1a, mDYRK-2, and mDYRK-3 was high in testes, but unlike mDYRK1a and mDYRK 2, mDYRK-3 was not expressed at appreciable levels in other tissues examined. Among hematopoietic cells, however, mDYRK-3 expression was selectively elevated in erythroid cell lines and primary pro-erythroid cells. In developmentally synchronized erythroid progenitor cells, expression peaked sharply following exposure to erythropoietin plus stem cell factor (SCF) (but not SCF alone), and in situ hybridizations of sectioned embryos revealed selective expression of mDYRK-3 in fetal liver. Interestingly, antisense oligonucleotides to mDYRK-3 were shown to significantly and specifically enhance colony-forming unit–erythroid colony formation. Thus, it is proposed that mDYRK-3 kinase functions as a lineage-restricted, stage-specific suppressor of red cell development.
Introduction
Mammalian DYRKs are a subfamily of dual-specificity tyrosine phosphorylation-regulated kinases and were originally discovered on the basis of homology to Saccharomyces cerevisiae Yak1 and Drosophila mini-brain (MNB) kinases.1 All are related distantly to mitogen-activated protein kinases (MAPKs)2,3 yet each contains several distinguishing features including a YxY motif between domains VII and VIII (ie, the activation loop), a DFGSSC motif in domain VII, unusual C residues in domain VII and between IV and V domains, and an acidic DDDNxDY DYRK homology box immediately proceeding catalytic domains I through XI.1-3 With regard to function, the founding member of the DYRK family of kinases, Yak1, acts in yeast to suppress Ras and protein kinase A–dependent growth pathways,4,5 while mutations in MNB reduce neuron numbers in Drosophila central brain and optic lobes.6To date, 7 mammalian DYRKs have been reported7: DYRK-1a, DYRK-1b, DYRK-1c, DYRK-2, DYRK-3, DYRK-4a, and DYRK-4b, among which DYRK-1a has been studied most extensively.7-17 In humans DRYK-1a is expressed primarily in brain, although transcripts are also present in heart, skeletal muscle, and placenta.11,12 Similarly to MNB,6 hDYRK-1a is thought to play an important role in neuronal development and has been mapped to the Down syndrome–critical region of chromosome 21q22.2, a region associated with learning defects in partial trisomy 21 patients.14-17 In mice, expression of either a 180-kilobase contig containing the human DYRK-1agene or an extra copy of the murine DYRK-1a gene has also been correlated to learning defects.11 A closely related family member, DYRK-1b, is expressed in heart, muscle, and testes,18 while expression of DYRK-2, DYRK-3, and DYRK-4 has been observed only in testes.7
Less is known about factors that regulate DYRK expression and activity or about the precise biological functions of DYRKs. With regard to expression, no cis-regulatory features of DYRK genes have been analyzed to date. However, some information is available on compartmentalization, and interestingly, DYRK-1a and DYRK-1b (but not DYRK-1c, DYRK-2, DYRK-3, DYRK-4a, or DYRK-4b) contain a predicted nuclear translocation signal, and when expressed as green fluorescent protein, fusion proteins in transfected COS cells are transported to the nucleus.7,18,19 In addition, activation of DYRK-1a9 can occur through autophosphorylation at the above-mentioned activation loop YxY motif, although the possible existence of distinct DYRK-activating kinases merits consideration. Activated DYRK-1a can phosphorylate histone 3 and myelin basic protein (MBP) at S and T residues (single-letter amino acid codes), and a consensus target sequence of RPX(S/T)P has been proposed.13 Unlike DYRK-1a, hDYRK-2 and hDYRK-3 have also been demonstrated to phosphorylate histone 2B.7 To date, however, no physiological DYRK substrates have been defined. To advance an understanding of DYRK expression, structure, and function, we have currently cloned complementary DNAs (cDNAs) for mDYRK-2 and mDYRK-3, and have analyzed mDYRK-1a, mDYRK-2, and mDYRK-3 expression in murine tissues, hematopoietic cell lines, and select primary hematopoietic lineages. Remarkably, high-level expression of mDYRK-3 appears to be restricted to testes and to erythroid cells. In addition, the timing of mDYRK-3 expression during erythropoiesis appears to be sharply limited to a late progenitor stage, and antisense oligonucleotides to mDYRK-3 are shown to selectively enhance colony-forming unit–erythroid (CFU-E) development. Thus, it is proposed that mDYRK-3 functions as an important lineage- and stage-specific regulator of red blood cell production.
Materials and methods
DYRK cDNAs
We prepared 5′ subdomains of hDYRK-1, hDYRK-2, and hDYRK-3 cDNAs by reverse transcription–polymerase chain reaction (RT-PCR) on the basis of sequences described by Kentrup et al.9For hDYRK-3, this corresponded to nucleotides 490 to 750, and this latter probe was used to clone mDYRK-3 cDNAs from a Lambda Zap erythroleukemic SKT6 cell library.20 21 Positive clones were converted to phagemids and sequenced. For mDYRK-1a, a cDNA fragment spanning nucleotides 61 to 519 was prepared from murine brain RNA by RT-PCR, was cloned to pCRScript (Stratagene, La Jolla, CA), and was sequenced. To clone mDYRK-2, hDYRK-2 was used to search GenBank for murine end sequence tags (ESTs). One EST (W66995) shared considerable homology with hDYRK-2. Nested primer pairs (5′ direction, 5′-TGC CCA AAA GCT CGA TCA TAC AAG -3′ and 5′-GAT GCA ACC CAG GCT CCA CA -3′; 3′direction, 5′-GCT TAA GCC CGA GAA CAT TTT G -3′ and 5′AAA GCA GCA GGG TCG AAG CAG TAT TA -3′) were designed to extend this sequence in both the 5′ and 3′ directions with the use of a murine heart cDNA Marathon RACE kit as described by the manufacturer (Clontech, Palo Alto, CA). The amplified products were T/A cloned into pCR2.1-TOPO (Invitrogen; Carlsbad, CA) and the inserts sequenced. A second round of 5′ and 3′ RACE using nested primers (5′ direction, 5′-CTT TTC AAC CCA GTA AGG CTC AGC -3′ and 5′-GAT ACA AAT GAG TAG AGT TAT TGA GCA AA -3′; 3′direction, 5′-GGG TAA CCC TTG GAG CTC ACG AAA T -3 and 5′-GCA GTG CTT GGA TGC TTT GCA CAA GAA –3;) was required to obtain the full-length cDNA. Once the entire coding region was identified, RT-PCR was used to obtain a contiguous full-length cDNA with the use of murine kidney and brain cDNAs. These products were T/A cloned into pCR2.1-TOPO, and the inserts were sequenced and compared to ensure that no PCR errors were introduced.
RNA isolation, Northern blotting, RT-PCR, and in situ hybridizations
RNA from murine cell lines and tissues was isolated by means of Trizol reagent (Life Technologies, Gaithersburg, MD). In Northern blotting, RNA was electrophoresed in formaldehyde agarose gels, blotted to Nytran membranes, and fixed. Arrays of murine polyA+ RNA were from Clontech. Hybridization to randomly primed32P-cDNA probes was in Quick-Hyb (Stratagene) (4 hours at 68°C). In quantitative RT-PCR, cDNA was prepared by means of Superscript II RNase H− reverse transcriptase (Life Technologies) and 1 μCi of [alpha-32P] deoxyadenosine triphosphate (3000 Ci/mmol) per reaction. At the cycle intervals indicated, products were analyzed by electrophoresis and autoradiography. In each reaction, primers for hypoxanthine guanosine phosphoribosyl transferase (hgprt) were included. Primer pair sequences were as follows: For mDYRK-1a, 5′-CAT GGC AAA CCT TCA TCT GTC C -3′ and 5′-CGA TTT CAT ACC GAT CCG ATC CAT CC -3′; for mDYRK-2, 5′-CAC ACC ATG AAT GAC CAC CTC C -3′ and 5′-TTG ACC ACC TGC CCA AAG C -3′; for mDYRK-3, 5′-CAC CCT ATT CGG ACA CAT TCA GC -3′ and 5′-GAG TCA GCG GCA GCA CCT TAG -3′; for murine erythropoietin (mEpo) receptor, 5′-GCT CTA GAC TAA GCT TCA TCC ATA GTC ACA GGG TCC AC -3′ and 5′-TGG TCC TCA TCT CGC TGT TGC TGA -3′; for m-alphaIIb, 5′-AGG CAG AGA AGA CTC CGG AT -3′ and 5′-TAC CGA ATA TCC CCG GTA AC -3′, for mPF4, 5′-CTC TTG ACA TGA GCG TCG CTG CGG -3′ and 5′-CTT GAT CAC CTC CAG GCT GGT GAT -3′; for m-mac-1, 5′-CCC CTC ACT CCA ATT TCC -3′ and 5′-CTC TCT CTC TCT CTC CCT CTC C -3′; and for m-hgprt, 5′-CAC AGG ACT AGA ACA CCT GC -3′ and 5′-GCT GGT GAA AAG GAC CTC T -3′. In situ hybridizations were to a 33P–uridine triphosphate UTP (33P–UTP)–labeled antisense transcript generated from nucleotides 263 to 815 of mDYRK3 cDNA by means of T7 RNA polymerase. This probe is specific for mDYRK3 and is hybridized specifically to a target in both Northern and Southern blots. Staged and sectioned embryos were from Novagen (Madison, WI), and hybridizations were performed essentially according to specifications. Exposure to LM-1 Hypercoat emulsion (Amersham, Piscataway, NJ) was for 14 days.
Kinase assays and Western blotting
For use in kinase assays, a full-length mDYRK-3 cDNA was tagged at its 5′ terminus with a Myc epitope–containing cassette22 and was cloned to pCDNA3.1 (Invitrogen). As a negative control, the codon for K202 (single-letter amino acid code) was mutated (from AAA to AGA), and the resulting construct (mDYRK-3–K202R [single-letter amino acid code]) was likewise cloned to pCDNA3.1. Transfections of 293 cells were with Ca2PO4-DNA co-precipitates, and total cell lysates were prepared at 48 hours posttransfection. Immunoprecipitations were with anti-myc mouse monoclonal antibody (mAb) 9E10 (Invitrogen) and protein L agarose (Santa Cruz Biotechnology, Santa Cruz, CA). For kinase assays, immunoprecipitates were washed in 5 mM MgCl2, 1 mM Na2EDTA acid, 25 mM 3-(N-morpholino) propanesulfonate (MOPS), pH 7.2, supplemented with 25 mM beta-glycerol phosphate, 0.5 mM dithiothreitol, and 0.02 mM sodium vanadate, and were incubated for 25 minutes at 30°C in this buffer with 1 μCi [32P]γ–adenosine triphosphate (ATP) and either MBP (100 μg/mL) (UBI, Lake Placid, NY) or histone 2B (100 μg/mL) (H-2B, Boehringer Mannheim, Indianapolis, IN). Also included were 0.2 μM protein kinase C inhibitor (peptide RFARKGALRQKNV), 0.02 μM protein kinase A inhibitor (peptide TYADFIASGRTGRRNAI), and 0.2 μM compound R24571. Products were denatured at 100°C in 1.6 mM sodium dodecyl sulfate, 0.1 M dithiothreitol, 0.3 mM bromophenol blue, 5% glycerol, and 0.06 M Tris-HCl, pH 6.8, and were electrophoresed and analyzed by autoradiography. Western blotting was performed as described previously.23
Primary hematopoietic cells and cell lines
Cells isolated from bone marrow of 8-week-old DBA-1 mice were exposed for 3 minutes to a freshly prepared solution of 50 mM NH4Cl plus phosphate-buffered saline (PBS) (combined upon use at 9:1), collected through 50% fetal bovine serum (FBS) in PBS at 1000g for 10 minutes, washed in Dulbecco's modified Eagle's medium (DMEM), and adjusted initially to 5 × 10⁶ cells per milliliter in either Stem Span medium or Megacult C medium (Stem Cell Technologies, Vancouver, BC, Canada). Erythroid progenitor cells were propagated at 1 × 10⁶cells per milliliter in DMEM containing 15% FBS, 1% bovine serum albumin, holo-transferrin (0.13 mg/mL), 1.9 mM NaHCO3, 0.1 mM β-ME, 1 μM dexamethasone, 1 μM β-estradiol, human insulinlike growth factor–1 (40 ng/mL), mSCF (50 ng/mL), and hEpo (1 U/mL).23 Granulocytic plus monocytic progenitor cells were propagated in Stem Span medium containing mSCF (50 ng/mL), murine interleukin (IL)–3 (mIL-3) (10 ng/mL) and hIL-6 (10 ng/mL). Megakaryocytic progenitor cells were propagated in Megacult C medium containing human Tpo (50 ng/mL) and mIL-3 (10 ng/mL). Cultures were initiated (and maintained) at 1 × 10⁶ cells per milliliter, and one-third of the culture volume was replaced with fresh medium every 36 hours. For erythroid splenocytes, mice were injected subcutaneously with phenylhydrazine (50 mg/kg in PBS) on days 1, 2, and 4 prior to splenectomy on day 5. Alternatively, mice were treated with thiamphenicol (TAP).24-26 TAP was administered as a subcutaneous implant on day 1 (14 g/kg); mice were phlebotomized on days 2 through 4; TAP was withdrawn on day 6; and splenocytes were prepared on day 9.5. Disrupted splenocytes from TAP-treated mice were prepared as described above for marrow and were cultured at 1 × 10⁶ cells per milliliter in Stem Span and 10% FBS media containing hEpo plus mSCF (2.5 U/mL and 100 ng/mL, respectively) or mSCF alone (100 ng/mL). Cytospin preparations were stained with Hema 3 (Fisher Scientific, Pittsburgh, PA). Murine cell lines used were erythroid MEL,27 SKT6,23 and B6SUt.EP.28 Also analyzed were lymphoid CTLL-2(ER) cells,29 myeloid FDC(ER) cells,30 and NIH 3T3 fibroblasts. (As described in Quelle and Wojchowski28 and Jiang et al,29 ER denotes the ectopic expression of the Epo receptor in CTLL-2 and FDC cells).
Colony-forming assays and antisense oligonucleotides
Bone marrow cells or splenocytes from TAP-treated mice were isolated as above, washed, and adjusted to a density of 3 × 10⁶ cells per milliliter in PBS containing mSCF (100 ng/mL). Oligonucleotides were added to a final concentration of 5 μM and were incubated with cells for 6 hours at 37°C. These included sense 5′-ggC GAG CTC GCG ATG GGa gG -3′), antisense 5′-ccT CCC ATC GCG AGC TCg cG -3′), and a randomly scrambled antisense oligonucleotide with retained overall nucleotide composition 5′-tgC CCC CGA GAC CGT CGt cC -3′) (lower-case bases indicate a 3′-phosphothiolate linkage). Additional control cultures contained no oligonucleotides. Cells were then plated directly in Methocult media (Stem Cell Technologies) at a density of 3 × 10⁵ per milliliter in the presence of mSCF (50 ng/mL) and mIL-6 (10 ng/mL) for assays of CFU–granulocytic-monocytic (CFU-GM). CFU-E cells were identified by staining hemoglobin-positive colonies with benzidine (0.2% in 13% glacial acetic acid, 4.3% H2O2) and were scored at 2.5 days of culture. CFU-GM cells were scored at day 12.
Results
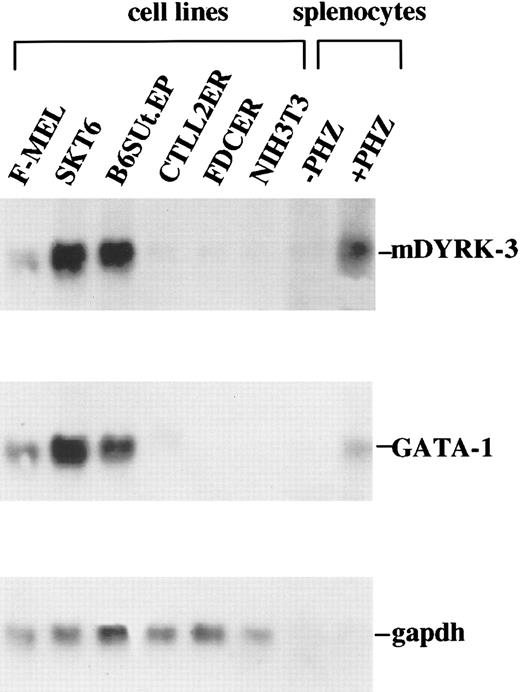
In primary experiments, probes specific for DYRK-1, DYRK-2, and DYRK-3 were prepared from extant human cDNAs and were used in Northern blots to assay levels of mDYRK transcripts in a panel of murine hematopoietic cell lines. For mDYRK-1 and mDYRK-2, transcript levels in these lines were uniformly low (ie, near limits of detection; data not shown). In contrast, mDYRK-3 transcripts were expressed at relatively high levels in each of 3 erythroid lines tested (MEL, SKT6, and B6SUt.EP) but were low (or undetectable) in lymphoid CTLL-2(ER) cells, myeloid FDC(ER) cells, and 3T3 fibroblasts (Figure1, left lanes). On the basis of this initial observation, mDYRK-3 transcript levels were also assayed in splenocytes from normal control and anemic phenylhydrazine-treated mice. In erythroid splenocytes, mDYRK-3 expression proved to be elevated (Figure 1, right lanes). Also assayed were levels of GATA-1 and GAPDh transcripts (Figure 1, center and lower panels).
mDYRK-3 transcripts are expressed at high levels in erythroid cell lines.
In a panel of murine cell lines, levels of mDYRK-3 transcript expression were assayed by Northern blotting. Included were Friend-virus–transformed MEL and SKT6 erythroleukemic cells, Epo-responsive and εy-globin positive B6SUt.EP cells, lymphoid CTLL-2(ER) cells, myeloid FDC(ER) cells, and NIH 3T3 fibroblasts. Also analyzed were splenocytes from control and phenylhydrazine-treated mice. Probes used were 32P-labeled 5′ fragments of human DYRK-3 and murine GATA-1 cDNAs. Equivalence in loading was assessed by hybridization to a32P-GAPDh cDNA.
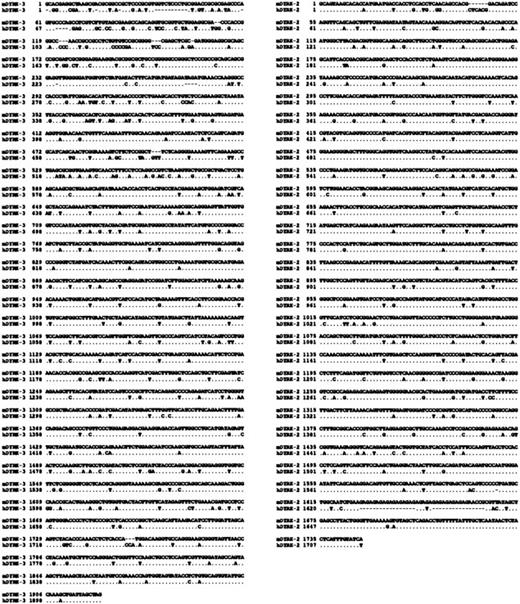
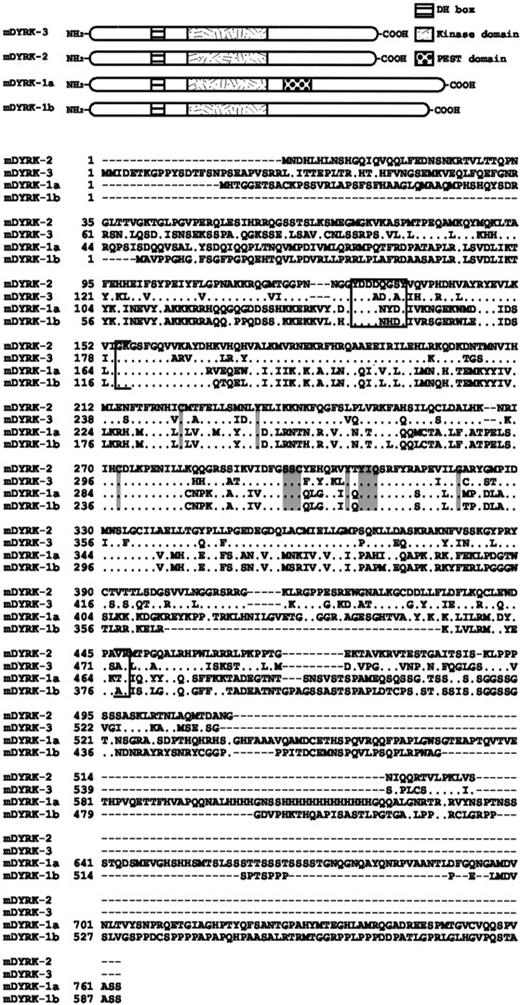
In subsequent investigations, an hDYRK-3 cDNA fragment was used to clone full-length cDNAs from a murine SKT6 cell phage Lambda library. We isolated 4 independent clones, each of which was approximately 2150 base pairs (bp) in length and extended approximately 210 bp 5′ beyond a predicted ATG translational initiation codon. The tentative assignment of ATG at nucleotides 263 through 265 as a site of translational initiation was done by comparison with this assignment for a conserved site in a human DYRK-3 cDNA.7 However, it is noted that an additional ATG site lies upstream from this site within a common open-reading frame (positions 158 through 160) in both murine and human DYRK-3. To identify the authentic site of translation, antibodies specific to DYRK-3 will be required. In Figure2, the sequence of a representative mDYRK-3 cDNA clone is shown and is compared with that of hDYRK-3. Within coding domains, mDYRK-3 and hDYRK-3 are 85.0% identical in nucleotide sequence (and 90% identical at the amino acid level, not shown). By comparison, mDYRK-3 is at most 25.1% identical to other known DYRK genes and is most homologous to hDYRK-2. To allow for comparative analyses of expression profiles, mDYRK-2 was also cloned and sequenced. At the nucleotide level, mDYRK-2 is 89% identical to hDYRK-2, and at the amino acid level (not shown), it is 98% identical. Between hDYRK-2 and mDYRK-3, nucleotide homology within coding domains was 66.1%. Sequence comparisons were also made at the amino acid level. These are shown in Figure3 (together with cartoons of DYRK kinase subdomains) and illustrate high homology within catalytic subdomains I through XI. Beyond this, a DYRK homology box (DDDNxDY consensus) that immediately precedes these subdomains and a previously identified activation loop that contains a YxY motif (rather than the TxY motif that occurs in MAP kinases) are also conserved.
mDYRK-3 and mDYRK-2: novel members of the DYRK family of dual-specificity kinases.
Shown are Clustal W alignments between cDNAs for murine vs human DYRK-3 (left column) and murine vs human DYRK-2 (right column). Homologies are 83.3% between murine vs human DYRK-3, and 90.1% between murine vs human DYRK-2.
Structural features of mDYRK kinases.
Upper panel: Cartoons depict mDYRK-3, mDYRK-2, mDYRK-1a, and mDYRK-1b, including conserved kinase subdomains, DYRK homology (DH) boxes, and, in mDYRK-1a, a PEST domain. Lower panel: Shown are Clustal W sequence alignments for mDYRK-3, mDYRK-2, mDYRK-1a, and mDYRK-1b. Indexed are DH boxes (boxed), predicted kinase subdomains I through XI (bracketed), and residues characteristic of DYRK kinases that in other kinases are rare at these positions (shaded residues).
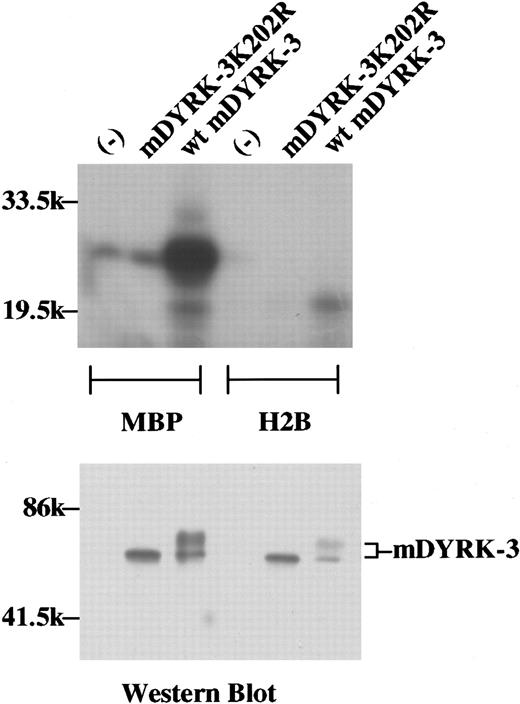
To initially characterize kinase properties, the above mDYRK-3 cDNA was expressed in 293 cells. As a negative control, K202 within a predicted kinase region subdomain II was mutated to arginine to yield a predicted inactivating mutation, mDYRK-3–K202R, and this cDNA (pEF-Neo) was transfected in parallel. As immunoprecipitated from 293 cells, wild-type mDYRK-3 efficiently phosphorylated MBP but not histone 2B (Figure 4, upper panel). In addition, Western blotting of eluted immunoprecipitates revealed apparent molecular-weight forms of 68 000 and 70 000 for wild-type mDYRK-3, while mDYRK-3–K202R migrated as a singular molecular weight–68 000 species (Figure 4, lower panel). This difference is consistent with (auto)phosphorylation (and activation) of the apparent 70 000 molecular weight mDYRK-3 species (although such predicted phosphorylation events have not yet been analyzed directly).
Phosphorylation of MBP by mDYRK-3 and apparent autophosphorylation in 293 fibroblasts.
To initially assess catalytic activity, mDYRK-3 (and the type II subdomain mutant mDYRK-3–K202R) were expressed transiently as Myc epitope–tagged constructs in 293 cells. At 48 hours posttransfection, mAb 9E10 immunoprecipitates were prepared from whole-cell lysates and were used together with 32P γATP plus MBP or histone 2B (H2B) in in vitro kinase assays. Shown in the upper panel are electrophoresed and autoradiographed 32P products. Immunoprecipitates were also eluted, and epitope-tagged wild-type mDYRK-3 and mDYRK-3–K202R were assayed by Western blotting (lower panel). Indexed are 2 forms of mDYRK-3 (ie, molecular-weight 68 000 and 70 000 forms), and the positions of molecular-weight standards.
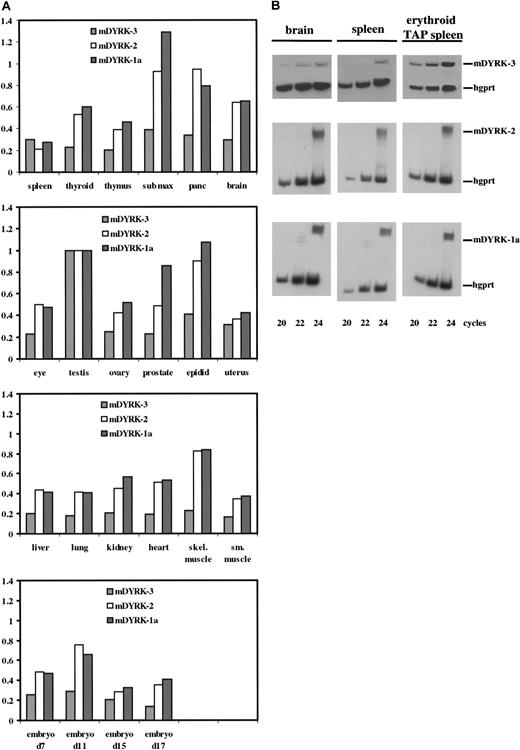
Murine DYRK-3, m DYRK-2, and m DYRK-1 were then used to investigate transcript expression profiles in murine tissues and primary hematopoietic progenitor cells. Non–cross-reacting probes were prepared from 5′ domains from each cDNA and were used to screen expression in the above panel of cell lines. Results were essentially identical to those obtained with hDYRKs 1 through 3 cDNA probes (see Figure 1) (data not shown). Expression of mDYRK-1a, mDYRK-2, and mDYRK-3 in a panel of poly-A+ RNAs from 18 murine tissues and 4 stages of embryogenesis was assessed next (Figure5). As reported previously for hDYRKs,7 relatively high-level expression of each mDYRK was observed in testes (and levels of expression in other tissues were therefore normalized to testes). Also, mDYRK-2 and mDYRK-1 were each expressed at comparably high levels in several other tissues, including submaxillary gland, pancreas, and epididymis. In contrast, mDYRK-3 transcript expression was uniformly low in all other tissues and in all embryonic stages assayed. Given this result, RNA was prepared from spleen (in which relative levels of mDYRK-3 expression was slightly higher than levels of mDYRK-1 or mDYRK-2), from brain (in which levels of mDYRK-1 and mDYRK-2 were higher than those of mDYRK-3), and from the erythroid spleens of mice treated with TAP; transcript levels for mDYRK-1, mDYRK-2, and mDYRK-3 were assayed in these tissues by32P–RT-PCR. As shown in Figure 5B (and consistent with the above preliminary results) (see Figure 1), levels of mDYRK-3 (but not mDYRK-1 or mDYRK-2) expression were increased markedly in erythroid splenocytes.
Expression of mDYRK-3, mDYRK-2, and mDYRK-1a among murine tissues and within control splenocytes, erythroid splenocytes, and brain.
(A) Transcript-specific probes were prepared by RT-PCR, cloned to pCRScript, 32P-labeled, and hybridized to an array of polyA+ RNAs from murine tissues. Graphed are relative levels of transcript expression, with values normalized to levels in testes. (B) 32P–RT-PCR was used to assay levels of mDYRK-3, mDYRK-2, and mDYRK-1a transcripts in brain, control splenocytes (“spleen”), and erythroid splenocytes from mice treated with TAP. As an internal control, hgprt transcripts were also assayed. At the cycles indexed, products were analyzed by polyacrylamide gel electrophoresis and autoradiography.
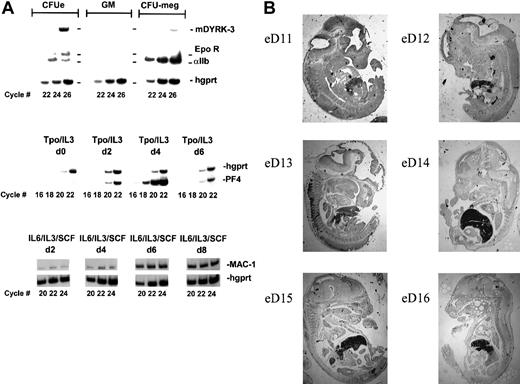
The above findings suggested that the expression of mDYRK-3 (in tissues other than testes) might be limited to erythroid cells. Therefore, mDYRK-3 transcript expression was then analyzed in select lineages of primary hematopoietic progenitor cells expanded in vitro from marrow, including erythroid, granulocytic/monocytic, and megakaryocytic lineages. Erythroid progenitor cells were propagated in the presence of SCF, Epo, dexamethasone, and beta-estradiol under conditions recently shown by Panzenbock et al24 to selectively support the proliferation (but inhibit the differentiation) of CFU-E. Direct colony-forming assays showed that frequencies of CFU-E in this murine system peaked at day 3 of culture (with a more than 100-fold enrichment) (unpublished data). Granulocytic-monocytic progenitor cells were propagated in the presence of SCF, IL-3, and IL-6 under conditions used for CFU-GM outgrowth, and these conditions were confirmed to provide for peak expression of mac-1 transcripts at 6 to 8 days of culture (see Figure 6, lower panel). Megakaryocytic progenitor cells were propagated in serum-free medium under conditions that promote CFU-megakaryocytic development, and these conditions were shown to support peak expression of pf4 transcripts at day 4 of culture (see Figure 6A, center panel, and Gaines et al31). As shown in the upper panels of Figure 6A, mDYRK-3 transcript expression is high in marrow-derived erythroid progenitor cells, but undetectable in the populations of granulocytic-monocytic progenitor cells assayed. Interestingly, mDYRK-3 transcripts were also detected at low to moderate levels in primary megakaryocytic progenitor cells. While these data do not preclude expression of mDYRK-3 transcripts within other hematopoietic lineages or developmental stages, they (together with the above cell-line and tissue-expression data) at least begin to define the erythroid nature of mDYRK-3. To define this further, expression of mDYRK3 transcripts in sectioned embryos were also assayed by in situ hybridization to a33P-labeled mDYRK3-specific antisense RNA probe. As shown in Figure 6B, mDYRK3 gene expression was restricted largely to fetal liver, with peak expression at days 13 through 15. This indicates hematopoietic-restricted expression and again is consistent with erythroid-specific expression.
Expression of mDYRK-3 at high levels in primary progenitor cells of erythroid lineage.
(A) To determine the extent to which mDYRK-3 expression might be limited to erythroid progenitor cells, marrow cells were cultured under conditions selective for the outgrowth of erythroid, granulocytic and monocytic (g/m), or megakaryocytic progenitor cells.31 At time points determined in advance to correspond to maximum enrichment of late progenitor cells in each series, RNA was prepared and levels of mDYRK-3 (and hgprt) transcripts were assayed (upper panel). (For erythroid, granulocytic and monocytic, and megakaryocytic lineages, this corresponded to days 3, 7, and 4 of culture, respectively). Illustrated in center and lower panels are profiles of pf4 transcript expression in Tpo/IL-3–expanded cultures (megakaryocytic cells), and of mac-1 transcript expression in IL-6/IL-3/SCF–expanded cultures (granulocytic and monocytic). For erythroid cells, profiles have been characterized previously.24 31 (B) The mDYRK3 transcript expression was also analyzed in staged and sectioned mouse embryos at days 11 through 16 by in situ hybridization to a33P-UTP–labeled mDYRK3-specific antisense RNA probe. The strong hybridization to fetal liver shown is representative of 4 independent sections and was maximal at days 12 through 15.
Another potentially important clue to mDYRK-3 function in erythroid cells concerns the timing of expression during development. This was addressed by experiments in which developmentally synchronized erythroid progenitor cells were prepared from the spleens of TAP-treated mice32 (ie, at day 3 following the removal of TAP) and were expanded in vitro in the presence of either SCF plus Epo or SCF alone. At 4 hours (day 0), 28 hours (day 1), and 76 hours in culture (day 3), levels of mDYRK-3 transcript expression in these cells were analyzed by 32P–RT-PCR (Figure7, upper panels) as well as by Northern blotting (Figure 7, lower left panel). In the presence of Epo plus SCF, mDYRK-3 transcript expression peaked sharply at day 1 and returned to low levels as cells matured (at day 3 as visibly hemoglobinized cells). As in analyses of marrow-derived erythroid progenitor cells, expression of mDYRK-3 transcripts peaked at, or slightly after, peak levels of Epo receptor transcript expression (unpublished data). In contrast, in the presence of SCF alone, no such increase in mDYRK-3 transcripts was observed. In these experiments, the 4-hour time point reflects the overall approximate time involved in splenocyte preparation. Also, levels of mDYRK-3 at this time point did not vary significantly in the absence or presence of SCF or SCF plus Epo. In cytospin preparations, cells propagated in SCF alone were observed to retain blastlike morphologies and, as shown by RT-PCR analyses, failed to increase levels of beta-major globin gene expression (Figure 7, lower right and upper panels). Thus, expression of mDYRK-3 in primary erythroid progenitor cells appears to peak sharply yet transiently at a late stage estimated to correspond to a CFU-E or late CFU-E compartment. In limiting exposures of the above Northern blot, it is also noteworthy that 2 distinct mDYRK-3 transcripts were present. Each was detected in RNA from TAP splenocytes at day 1 of culture in Epo, and each occurred at approximately equal levels (J.N.G. and D.M.W., unpublished data). These might correspond to alternatively spliced transcripts as recently reported for the hDYRK-3 homolog, regulatory erythroid kinase K (REDK).20
Peaking of mDYRK-3 expression at a late stage of erythroid development.
To examine the timing of mDYRK-3 gene expression during erythropoiesis, mice were treated with TAP and phlebotomized to generate an accumulation of early erythroid progenitor cells in spleen.25 26 TAP was then removed, and at 3 days after TAP removal, developmental synchronized erythroid progenitor cells from spleen were prepared and placed in liquid culture in the presence of Epo plus SCF or SCF alone. At days 0, 1, and 3, 32P–RT-PCR was performed, and levels of mDYRK-3, Epo receptor, beta-major globin, and hgprt transcripts were analyzed. In addition, mDYRK-3 (and GAPDh) transcript levels were assayed directly by Northern blotting (lower left panel). Cell histo-morphologies were also analyzed in cytospin preparations (lower right panel). Note the blastlike appearance of cells maintained in SCF only (vs the apparent enucleated morphology of cells cultured for 3 days in Epo plus SCF [arrows]).
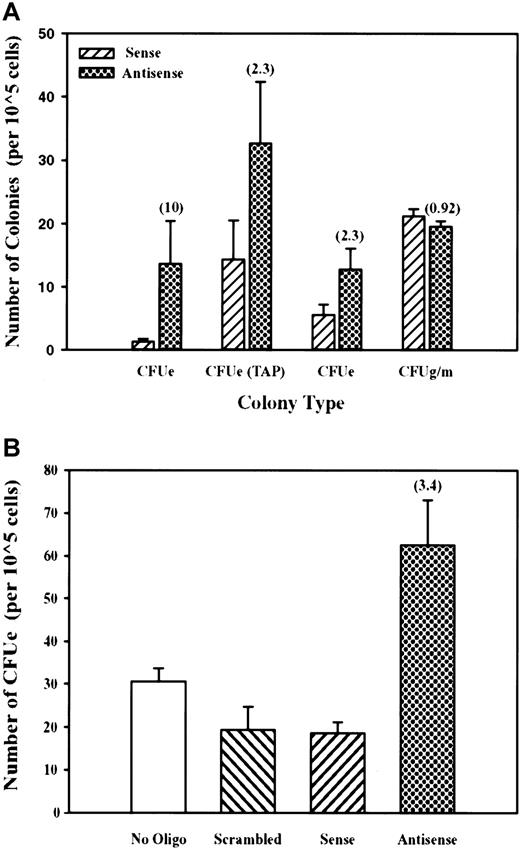
On the basis of the above profile of mDYRK-3 expression during erythroid development and to initially address function, we investigated the possibility that mDYRK-3 antisense oligonucleotides might affect CFU-E formation. Marrow cells or TAP-treated splenocytes were prepared and were cultured for 6 hours in PBS in the presence of mSCF plus an antisense oligonucleotide directed against mDYRK-3 (or a sense oligonucleotide as a control). CFU-E and CFU-GM formation was then assayed. As illustrated in Figure 8A (left histograms), mDYRK-3 antisense oligonucleotides were observed to significantly enhance CFU-E development. Results are shown for 3 independent experiments and reproducibly establish specific enhancing effects of antisense oligonucleotides on CFU-E formation. No such effects were exerted by antisense (or sense) oligonucleotides on CFU-GM formation (Figure 8A, right histograms). In repeated experiments using progenitor cells from erythroid spleens, the additional controls of no oligonucleotide or a scrambled antisense oligonucleotide were included. As shown in Figure 8B, only the above antisense oligonucleotide exerted significant effects and again enhanced CFU-E formation (in these experiments, by 2- to 3-fold). Together, these data support the notion that mDYRK-3 normally functions to attenuate CFU-E development.
Selective enhancement of CFU-E formation by mDYRK-3 antisense oligonucleotides.
(A) Bone marrow cells or TAP-treated erythroid splenocytes were incubated (in PBS plus mSCF) with antisense (filled histogram) or sense oligonucleotides (hatched histogram) to mDYRK-3 transcripts and were transferred directly to colony-forming assays. Indexed in parentheses are fold-increases in CFU-E numbers that are due to exposure to antisense (vs sense) oligonucleotides. Also illustrated is the absence of effects of mDYRK-3 antisense (or sense) oligonucleotides on CFU-GM formation. (B) The results of additional independent experiments in which erythroid sphenocytes from TAP-treated mice were used and in which the additional controls of a scrambled antisense oligonucleotide, or no oligonucleotide, were included.
Discussion
Several distinct classes of MAPK-related kinases have evolved to occupy important positions as regulators of cell growth and/or development. MAPKs per se are proline-directed S/T kinases, but are distinguished in part by a signature TxY activation loop. Phosphorylation of this loop motif by dual-specificity MAPK kinases directs interactions with arginine-binding sites and catalysis.2 Through PCR and EST database approaches, several new subclasses of MAPK-related kinases have recently been discovered, including IME2/MAK/MRK/MOK/KKIAMRES kinases, NLK kinase, PRP4 kinases, and DYRKs.3IME2/MAK/MRK/MOK/KKIAMRES kinases are related most closely to CDKs (including the occurrence of T14Y15/T15F15/S14Y15 motifs), yet each contains a TDY or TEY activation loop. In S cerevisiae, IME2 kinase is essential for mating-type switching,33 while in mammals MAK is expressed at high levels during the meiotic phase of spermatogenesis and may modulate this process.34Two KKIAMRES kinases have also been described that likewise are expressed most highly in reproductive tissues and may affect germ cell proliferation: p42 in ovary and p56 in testes.3 By comparison, NLK is related to Drosophila nemo kinase and possesses a loop motif (TQE) more like that of CDC2. InXenopus, NLK interestingly phosphorylates the transcription factor TCF-4 and suppresses beta-catenin–dependent axis duplication.35 PRP4 kinase contains a TPY loop structure similar to JNK-type MAPKs, phosphorylates the splicing factor ASF, and in Schizosaccharomyces pombe may regulate the splicing and subcellular distributions of (pre) mRNAs.36 Finally, DYRKs (including DYRK-3) contain distinct YxY motifs in their (auto)activation loops, yet act primarily as S/T kinases. Accordingly, DYRKs have been classified as dual-specificity kinases.37As discussed above, hDYRK-1a maps to the Down syndrome–critical region of 21q22.214-17; mutations in the Drosophilahomolog MNB kinase perturb brain neuron growth,6 and inS cerevisiae the homolog Yak1 acts to suppress growth.4 5 Thus, it is suggested that DYRKs, perhaps in particular, act as important developmental regulators. In the present study, investigations have focused on mDYRK-3 expression profiles and the possible function of mDYRK-3 during late erythropoiesis.
Initial analyses indicated that mDYRK-3 expression among tissues studied was restricted to testes and was regulated more stringently than the more broadly expressed mDYRK-1a and mDYRK-2 kinases (see Figure 4). Assays of expression in murine hematopoietic cell lines and primary progenitor cells, however, revealed high-level mDYRK-3 transcript expression selectively within the erythroid lineage (see Figures 1 and 6). Beyond this, analyses of expression in staged erythroid splenocytes from TAP-treated mice showed that mDYRK-3 expression is precisely programmed and peaks sharply but transiently at a late stage estimated to correspond to a CFU-E compartment (see Figure7). Three notions that relate to this restricted pattern of expression merit discussion. First, to our knowledge, this may be one of the more sharply stage-restricted profiles of erythroid gene expression described to date, and RT-PCR analyses suggest that regulation of mDYRK-3 expression is somewhat more stringent than for the Epo receptor gene.38-40 Second, this raises interesting questions regarding activators of mDYRK-3 gene transcription. The marked increase in expression observed upon the culture of pro-erythroid splenocytes in Epo plus SCF (but not SCF alone) is perhaps consistent with Epo regulation of mDYRK-3 gene activation. However, in several Epo-responsive erythroid cell lines (including SKT6,23B6SUt.EP,28 and FDC[ER]-GATA130 cells) no significant effects of Epo exposure on mDYRK-3 transcriptions levels were observed (L.P., J.N.G., D.M.W., unpublished data). This is in contrast to the marked induction in these cell line models of several other Epo response genes,21 and it is therefore speculated that mDYRK-3 gene activation may instead be the consequence of intrinsically programmed erythroid development. Third, a series of questions are also raised regarding the possible functional roles exerted by mDYRK-3. When initially considered, activation of mDYRK3 expression in rapidly expanding erythroid progenitor cells may appear incongruous to the proposed role of mDYRK3 as a suppressor of CFU-E growth and/or development. However, the results of repeated antisense oligonucleotide experiments are consistent with this overall inhibitory function, and the first-described DYRK kinase, Yak1, is known to act as a growth inhibitor in yeast (especially at the G1/G0 phase of the cell cycle). Until molecular targets or partners of mDYRK3 are identified, specific roles for mDYRK3 in erythroid progenitor cells are a matter for speculation. These might involve a possible direct inhibition of certain of the proliferative signals provided by Epo and SCF, a reinforcement of the action of known intracellular suppressors of pro-erythroid cell growth (eg, SOCS3, Cis, HCP), or apoptotic factors.
Finally, while the present investigations in murine systems were in progress, Lord et al20 reported on the tissue-restricted expression and possible function of a human homolog of DYRK-3. On the basis of differences in its amino terminal residues from hDYRK-3, and the discovery of an apparently alternatively spliced transcript that encodes an amino terminal extended product, this hDYRK kinase was termed REDK. As denoted by this nomenclature, REDK (like mDYRK-3) was discovered to be expressed at high levels in erythroid cell lines, and when examined in tissue, REDK was observed to be expressed at high levels in marrow, fetal liver, and testes and in marrow cells expanded in the presence of Epo. In addition, antisense oligonucleotides to REDK were shown to enhance frequencies of erythroid colony formation. By comparison, the present studies independently confirm an analogous erythroid-restricted profile of mDYRK-3 in murine cells and, by identifying CFU-E as a stage-specific compartment for peak expression, provide at least initial insight into possible mechanisms of action of this proposed suppressor of late erythroid development.
Supported by National Institutes of Health R01 grants DK40242 and HL44491.
All authors contributed significantly to this work, and J.N.G. and G.T.K. contributed equally to these investigations as co–first authors.
The publication costs of this article were defrayed in part by page charge payment. Therefore, and solely to indicate this fact, this article is hereby marked “advertisement” in accordance with 18 U.S.C. section 1734.
References
Author notes
Don M. Wojchowski, 115 William L. Henning Bldg, The Pennsylvania State University, University Park, PA 16802; e-mail:dmw1@psu.edu.

![Fig. 7. Peaking of mDYRK-3 expression at a late stage of erythroid development. / To examine the timing of mDYRK-3 gene expression during erythropoiesis, mice were treated with TAP and phlebotomized to generate an accumulation of early erythroid progenitor cells in spleen.2526 TAP was then removed, and at 3 days after TAP removal, developmental synchronized erythroid progenitor cells from spleen were prepared and placed in liquid culture in the presence of Epo plus SCF or SCF alone. At days 0, 1, and 3, 32P–RT-PCR was performed, and levels of mDYRK-3, Epo receptor, beta-major globin, and hgprt transcripts were analyzed. In addition, mDYRK-3 (and GAPDh) transcript levels were assayed directly by Northern blotting (lower left panel). Cell histo-morphologies were also analyzed in cytospin preparations (lower right panel). Note the blastlike appearance of cells maintained in SCF only (vs the apparent enucleated morphology of cells cultured for 3 days in Epo plus SCF [arrows]).](https://ash.silverchair-cdn.com/ash/content_public/journal/blood/97/4/10.1182_blood.v97.4.901/5/m_h80410702007.jpeg?Expires=1769098141&Signature=0r05M9hAFCr-L2Q8FTfI9rG6m2sDnKqMRlLh2HLHLLj8e2ZjFQmHWKeOBl1k8ubtlSu58nq8u9PmBgpfGydtkuA8zS-egTL8jTTZu5RFEc0ORdt3NLFkA~cvjZgWSB17rKe9XjIqtMTRwd4QCO8u9wKylIfUqiHvsnP~JSO126XkVHTiCv-d~2ho6HV9zaXWRxJT2JndVVIIdNVUL6Mmwn9A1DZtqL436rJhzMHGg43-VQhy1ed-Ht5sO-W6JH-XsGjYSdGHeL9FCj8tKge~RlE5YOr2dbN3SsyWkzxOnT5Gv4oAn-o-z26kfUAppqRJC2h4Qo1YBOYGoj3pJjmskA__&Key-Pair-Id=APKAIE5G5CRDK6RD3PGA)
This feature is available to Subscribers Only
Sign In or Create an Account Close Modal