Skewed X-chromosome inactivation in peripheral blood granulocytes becomes more frequent with increasing age, affecting up to half of those over 75 years old. To investigate the mechanisms underlying this phenomenon, X-inactivation profiles in 33 monozygotic and 22 dizygotic elderly twin pairs were studied. Differential methylation-sensitive restriction enzyme cutting at a hypervariable locus in the human androgen receptor gene (HUMARA) was studied on purified granulocytes using T cells as controls. A large genetic effect on skewed granulocytic X inactivation was shown (P < .05); heritability was estimated to be 0.68. A minor part (SD .0151 relative allele frequency [ie, larger/smaller] units) of the observed variance is due to experimental error. A further contributor to acquired skewing is stochastic asymmetric stem cell division, which was modeled and shown as unlikely to account for a substantial part of variance. Two monozygotic twin pairs had X-inactivation ratios skewed markedly in opposite directions, evidence for a further stochastic mechanism, suggestive of a single overrepresented clone. In conclusion, all 3 suggested mechanisms contribute to acquired X inactivation but the dominant mechanism is genetic selection. The observed proportion of putatively clonal hematopoiesis is similar to the lifetime incidence of hematopoietic stem cell malignancy consistent with the concept that clonal hematopoiesis precedes stem cell malignancy.
Introduction
One of 2 X chromosomes is randomly inactivated early in female embryonic development,1 so that it becomes transcriptionally inactive and thereby equalizes the dosage of X-linked genes between males and females. After this period, techniques able to distinguish between the 2 X chromosomes can be used to track the fate of the 2 different cellular populations. Initially distinction was achieved using polymorphic enzyme variants,2 but, more recently, the fact that placental mammals methylate the inactive X chromosome and certain restriction enzymes selectively cut the unmethylated allele has allowed more widespread application.3,4 In particular, the human androgen receptor locus has been found to be useful due to its high proportion (about 90%) of polymorphism.5 In this way, many tumors,6 including leukemias,7,8myelodysplasia,9 and myeloproliferative disorders,10-12 have been shown to express only one X chromosome, implying derivation from a single cell.
The process of X inactivation is thought to be initiated by acis-acting element at the X-inactivation center, Xist,13-16 first expressed at the 4-cell stage. A genome-wide demethylation occurs between the 8-cell stage and the blastocyst stage, so that Xist expression is expressed randomly with respect to the paternal and maternal X chromosomes. The X inactivation that ensues, before the gastrula stage, is then believed to be random. X inactivation, or lyonization, ratios in tissues then follow a binomial distribution. This theory has allowed estimation of the number of hemopoietic precursor cells at the time of lyonization to be calculated in bone marrow,17-20 with other organs tending to inactivate at different times.21 However, as more experience has been gained it was suspected,22 then demonstrated, that it is a common event occurring in up to half of elderly women.20 23-25 Furthermore, this acquired skewing seems to be most marked in the granulocytic fraction, the distribution for elderly T cells being similar to that for younger subjects.
Three mechanisms underlying acquired skewed X inactivation have been proposed. First, a “selective advantage” of one X chromosome over the other, the only nonstochastic mechanism.26 This is a well-described phenomenon in the extreme case where one X chromosome is known to carry a disease gene and appears to be selected against.27 That this mechanism can operate in the absence of an obviously deleterious phenotype has been shown in cats, where the X chromosome of the Geoffroy cat has a selective advantage over that of the domestic cat.28 Furthermore, a genetic influence on X-chromosome representation in the blood of elderly monozygotic human twins has been reported.29 Second, because it is believed that stem cell division may stochastically result in zero, 1, or 2 daughter stem cells,25,30 certain stem cells may become overrepresented or correspondingly underrepresented by chance. This effect may be accentuated by stem cell depletion.30 Third is the expansion of a clone derived from a single stem cell or stem cell precursor with a “proliferative advantage.”
In this paper, the importance of the first proposed mechanism is assessed by reporting the skewing of X inactivation in monozygotic and dizygotic twins. If genetic selection were an important mechanism, then the direction and magnitude of acquired skewing in granulocytes compared to T cells should be more similar in monozygotic twins than expected by chance alone. We assess stochastic mechanisms by both measuring the variance of the difference within twin pairs beyond experimental error and also by modeling stem cell division mathematically. Finally, by deducting the contributions of the first 2 mechanisms, we assess the relative importance of the third.
Materials and methods
Subjects
Following informed consent, 5 to 10 mL blood was obtained from subjects in the St Thomas's twin registry; 120 women comprising 33 monozygotic and 27 dizygotic pairs were recruited. The mean ages (SD; range) were 61 (6.0; 51-73) and 63 (3.4; 55-72) years, respectively. Zygosity of twins was documented by an initial validated questionnaire with 95% accuracy, followed by genetic fingerprinting in ambiguous cases using microsatellite analysis at 6 to 7 polymorphic loci.
Cellular fractionation
After overnight transport, peripheral blood granulocytes and mononuclear cells (PBMC) were isolated by density gradient centrifugation on Histopaque 1077 and 1119 (Sigma, Poole, United Kingdom) according to the manufacturer's instructions. Granulocyte fractions were assessed morphologically and were typically more than 99% pure. T cells were isolated from the mononuclear cell fraction predominantly by E-rosetting, but anti-CD2–coated magnetic beads (Dynal, Oslo, Norway) were also used according to the manufacturer's instructions. E-rosetting was performed by diluting sheep blood 4:1 into Alsever solution, buffy coat depleting, then washing 3 times in physiologically buffered saline or Hanks buffered salt solution before resuspension in RPMI 10 medium at 2%. Heat-inactivated fetal calf serum (2 mL) and 2 mL sheep red blood cells were added to 1 mL PBMC (1.107 cells/mL) in RPMI 10 medium. The mixture was incubated for 10 minutes at 37°C, then on ice for 1 to 16 hours. The mixture was then centrifuged through 10 mL Histopaque 1077 at 900g. RPMI 10 medium (45 mL) was added to the pellet and the red cells lysed with 1 mL water. The T cells were then spun down and washed before DNA extraction. T-cell fractionation was assessed morphologically and granulocytic contamination was always less than 5%. Two samples were assessed by flow cytometry using anti-CD45 and anti-CD2, coupled with phycoerythrin and fluorescein isothiocyanate, respectively, and were more than 90% CD2+.
X-chromosome inactivation analysis
DNA was extracted from granulocytes and T cells using the Nucleon kit (Scotlab, Coatbridge, United Kingdom).
Analysis of the X-inactivation status at the HUMARA locus was performed according to Allen and coworkers5 with slight modifications. DNA (2 μg) was incubated with 20 U HpaII (MBI Fermentas, Vilnius, Lithuania) in a 30-μL reaction; then 3 to 6 μL of the restricted product was subject to polymerase chain reaction (PCR) in 10 mM Tris HCl, pH 8.8, 50 mM KCl, .08% Nonidet-40 using 1.5 Us Taq DNA polymerase (MBI Fermentas) on a Techne Progene (Cambridge, United Kingdom) thermal cycler. Primer sequences were 5′-GCT GTG AAG GTT GCT GTT CCT CAT-3′ and 5′-TCC AGA ATC TGT TCC AGA GCG TGC-3′. Cycling conditions were 120 seconds at 40°C, 300 seconds at 95°C: 28 × 45 seconds at 95°C, 30 seconds at 60°C, 30 seconds at 72°C. The former primer was labeled with 5′ FAM (Oswel, Southampton, United Kingdom). PCR products were analyzed on 4% denaturing acrylamide gels using an Applied Biosystems Prism 377 (PerkinElmer, Foster City, CA). Band quantitation was performed using the peak values defined by ABI software.
Data were taken as a ratio of peak heights of the longer to shorter alleles. No correction was performed for efficiency of PCR of the 2 alleles using undigested samples because we found that the degree of methylation of each allele was inversely correlated with efficiency of amplification. This effect will be analyzed in a subsequent paper (in preparation).
Statisticalanalysis
Ideally, a summary measure of the direction and magnitude of acquired skewing in granulocytes away from T cells would be used to analyze concordance between twin pairs. However, due to the underlying distribution of T-cell values, no such unbiased measure exists. To illustrate this point, consider whether G = 0.7 versus T = 0.5 exhibits a greater or lesser degree of skewing than G = 0.2 versus T = 0.1. Instead, we analyze the concordance of allele ratios for each cell type.
The statistical analyses presented here are of 3 forms: nonparametric randomization tests, Pearson or Spearman correlations on both untransformed and transformed data, and Bayesian inferenceUsing Gibb's Sampling using the BUGS program.31
For randomization tests, a statistic is calculated from the data and is then compared to a large number of such statistics calculated from randomly matched pairs of individuals. These were generated through permutation, by selecting one member of each twin pair, and matching unselected twins at random. The P value of the test is the proportion of permuted values more extreme than our observed value.
We can measure the direction of drift of granulocytes from T cells by subtracting the observed proportion of the upper allele of the granulocytes from the proportion in the T cells. The degree of drift can then be compared in the twin pair by subtracting this measurement of drift in one of the pairs from the other. In this case, if the degree of acquired skewing were the same in each of the twin pairs then the difference would be 0. If they were different, and we ignore the sign by taking the modulus, that is ‖x‖, then the value would be greater. In summary,d = ‖(t1 − g1) − (t2 − g2)‖.
To make the data amenable to analysis using normal distributions, the natural logarithm of the ratio of the height of the longer, hl, and shorter, hs, allele—often called the logit transformation—r = logit(p) =log[p/(1 − p)] = log(hl/hs), as hs = constant(1 − hl).
The BUGS package is designed for complex problems with the potential to make inferences about many unknown parameters. The program does not output point estimates; rather it generates the entire joint distribution of the parameters of interest. This is in the form of large (typically 10 000 here) numbers of samples from which we can recreate the distribution or calculate statistics such as the median or mean as point estimates. The structure of these models can be described as Directed Acyclic Graphs. We used 2 models here: one for the joint estimation of experimental errors and the variance covariance matrix, described in this section, and one to estimate stem cell numbers, described in a later section. Further details of the models and code are available from our Web site,http://www.maths.abdn.ac.uk/∼ijw/BUGS.
For many of the twin pairs we have results from 2 PCR reactions and 3 gel runs, for others 2 gel runs and either one or 2 PCR reactions. This gave us the opportunity to investigate the relative errors in different parts of the genetic analysis: digestion, PCR, gel electrophoresis, and quantification. The errors arising from the quantification of the gel peaks were very small (data not shown). To model these inferences we used a 2-stage process. If the logit of the allele frequency for a cell type in an individual is r, then the logit frequency after extraction and the PCR reaction isrpcr = r + epcr,where epcr is a normally distributed error term with mean 0 and SD ςpcr.
The running of the gel and quantification of bands was also assumed to produce an error, erun, which is also normally distributed with mean 0 and SD ςrun. Thus the observed logit relative allele frequency robs = r + epcr + erun.
BUGS allowed us to take account of these errors and estimate their SDs, assuming independence between errors. BUGS treats the true values of r and rpcr as unobserved random variables, and samples from the joint distribution with the error SDs conditional on the observed set of robs.
The logit T-cell relative allele frequencies and logit granulocytic relative allele frequencies, r, were then assumed to come from a multivariate normal distribution with mean 0, with an unknown variance-covariance matrix that could be different for both monozygotic twin pairs and dizygyotic twin pairs. BUGS sampled from the posterior distribution of covariance matrices given the data. The correlation could then be calculated from these matrices.
We minimized dependence on the estimates of prior parameters by using very weakly informative (flat) priors. The error terms for PCR and gel runs had independent gamma priors for the precision (1/variance) with mean 1 and variance 1000. The prior precision matrix had a Wishart prior with diagonal elements 1 and off-diagonal elements 0 giving prior correlations between twin pairs with mean 0, and variances with a large range and order of magnitude 1.
Mathematical modeling of stem cell division to explain acquired skewing
Assuming a constant number of stem cells, when a stem cell divides, the 2 daughter cells may both become stem cells. Alternatively, one or neither may become stem cells, instead differentiating or dying. Therefore, the progeny of any single stem cell may become overrepresented or underrepresented in later generations by chance and it has been suggested that this mechanism of asymmetric stochastic stem cell division might explain all or some of acquired X inactivation.19,23 We propose that this mechanism is equivalent to random genetic drift, which has been analyzed extensively by population geneticists.32 If a steady-state population of organisms is considered, where 2 alleles are represented with no selective pressure associated with either, the proportion of the population with either allele can similarly fluctuate with time by chance alone. If 2 organisms/stem cells are taken at random, they may both have arisen from a single organism/stem cell that has just divided or alternatively 2 different organisms/stem cells. With N organisms/stem cells and no selection, the probability that they have not come from a single cell is 1/N. The probability that after g generations they still do not share a common ancestor is
This probability of nonrelatedness is equal to 1 − F, where F is the probability of identity, the probability that genes (here cells) share a common ancestral allele more recently than at some reference in the past. The geometric distribution for nonidentity is well approximated by an exponential distribution, giving F = 1 − exp( − g/N), where g is the average number of cell divisions andN is the effective population size (which is the actual population size divided by the variance in the number of offspring, which in a purely random model is one). It can be shown that the beta distribution is an exact model for the island model of genetic drift,33 and is a good approximation when the initial allele frequency is 0.5 and there is no significant fixation, that is, allele proportions of 0 or 1. Our and others' data appear to fit these assumptions. The distribution of allele frequencies follows approximately a beta distribution with parameters α = (1/F − 1)p and β = (1/F − 1)(1 − p), where p is the initial allele frequency.32
We measure the drift of the allele frequency of T cells away from 0.5, and the drift of granulocytes away from T-cell frequencies using g, N, and the beta distribution. The model assumes that the amount of drift is different for each twin pair and estimates the mean and variance of the individual Fs. Priors for PCR- and gel-run errors were the same as for the multivariate-normal model, described in the last section. Details of this model are available from our Web site,http://www.maths.abdn.ac.uk/∼ijw/BUGS.
Results
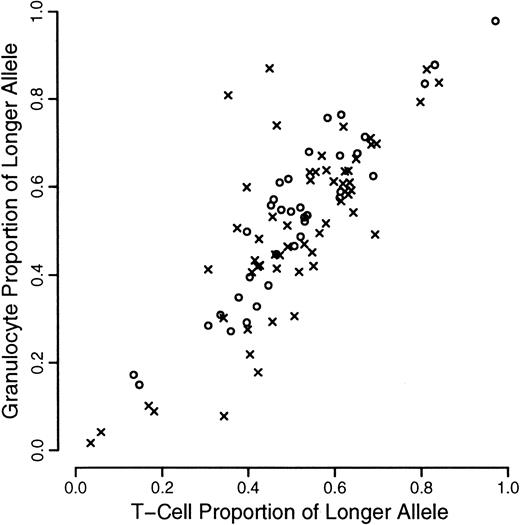
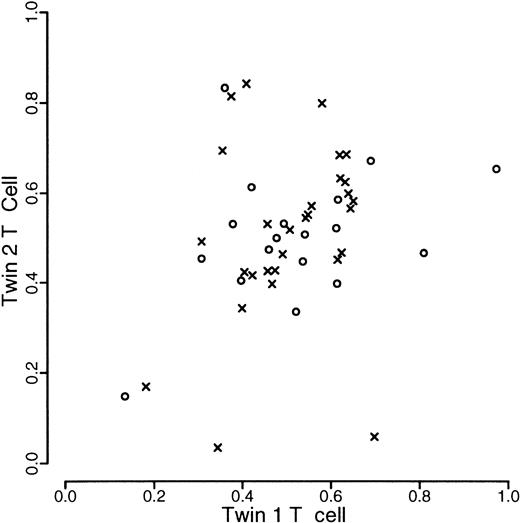
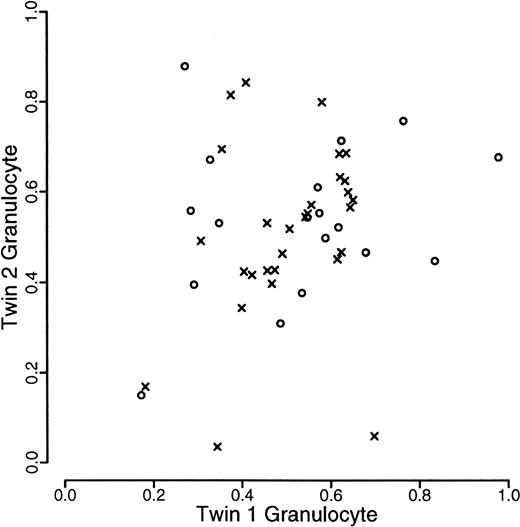
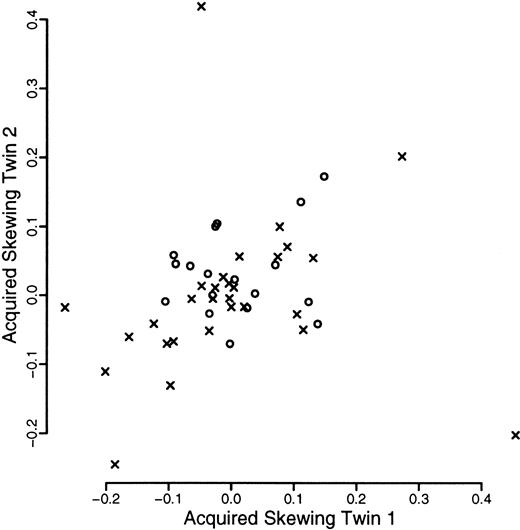
A total of 120 individuals comprising 33 monozygotic and 27 dizygotic pairs were analyzed. Five dizygotic pairs gave technically unsatisfactory results, mainly because of substandard cellular fractionation in one of the 4 fractions required for each pair, and were excluded from subsequent analyses. Four monozygotic and 3 dizygotic pairs were both monoallelic or had alleles that were so close in size that it was felt that they could not be reliably distinguished. In one of the dizygotic pairs, only one of the pairs was monoallelic. These rates are in accordance with previous experience at this locus. All such findings were checked by PCR of undigested samples. These exclusions left 29 monozygotic and 18 dizygotic pairs suitable for statistical analysis. The data are illustrated in Figures1, 2, and3. As referred to above, we were unable to develop a completely satisfactory measure of acquired skewing but illustrate a simple measure (allele ratio in granulocytes-allele ratio in T cells) in Figure 4.
Scatterplot of proportion of longer allele for granulocytes versus T cells.
Data from monozyogtic twins are marked with crosses and those from dizygotes with open circles.
Scatterplot of proportion of longer allele for granulocytes versus T cells.
Data from monozyogtic twins are marked with crosses and those from dizygotes with open circles.
Scatterplot of proportion of longer allele of T-cells within twin pairs.
Data from monozyogtic twins are marked with crosses and those from dizygotes with open circles.
Scatterplot of proportion of longer allele of T-cells within twin pairs.
Data from monozyogtic twins are marked with crosses and those from dizygotes with open circles.
Scatterplot of proportion of longer allele of granulocytes within twin pairs.
Data from monozyogtic twins are marked with crosses and those from dizygotes with open circles.
Scatterplot of proportion of longer allele of granulocytes within twin pairs.
Data from monozyogtic twins are marked with crosses and those from dizygotes with open circles.
Scatterplot of measure of acquired skewing within twin pairs.
The measure of acquired skewing is the proportion of the longer allele seen after restriction in the granulocytic fraction minus that in the T-cell fraction. Data from monozyogtic twins are marked with crosses and those from dizygotes with open circles.
Randomization statistics
The randomization and simple correlation tests were performed on the mean of the results from each individual; no account was taken of experimental error. The statistic d was calculated, using the first equation, to be 2.67 for monozygotic pairs and 1.4 for dizygotic pairs (P < .003 ± .0005 and < .3 ± .0045, respectively).
Simple correlation
The major effect is that the allele ratio of granulocytes is highly correlated with that from T cells within any individual (Pearson correlation coefficient 0.87). The Pearson correlation coefficients (95% confidence intervals) between the untransformed allele ratios within each twin pair are 0.24(−0.10-0.59) and 0.52(0.26-0.79) for the T-cell and granulocytic fractions, respectively, with those for dizygotic twins 0.38(−0.02-0.77) and 0.25(−0.19-0.68), respectively. Corresponding Spearman (nonparametric) coefficients are 0.28, 0.46, 0.24, and 0.20, respectively.
For subsequent analyses the mean of the logit (hl/hs) was considered; modeling experimental error as assessed by duplicate measurements is considered in a later section. The Pearson correlations (95% confidence intervals) between the T-cell and granulocytic values of monozygotic twins are 0.21(−0.14-0.56) and 0.55(0.3-0.81), respectively, with those for dizygotic twins 0.39(0.00-0.78) and 0.25(−0.19-0.68), respectively.
The only statistically significant result is that for granulocytes within the monozygotic twin pairs. These results give an indication of the association between the twin pairs but take no account of any experimental error.
Measuring experimental error
In units of relative allele frequency (ie, longer/shorter), the estimated SDs are given in Table 1, based on runs of length 10 000 from BUGS. These indicate that levels of experimental error are low compared to other sources of variation in the models. The errors of the 2 stages of measurement appear to have approximately the same magnitude and have considerable overlap. This hierarchical model for relative allele frequencies is used in subsequent analyses unless otherwise stated.
Analysis of measurement error
| . | Estimated SDs . | |||
|---|---|---|---|---|
| Percentiles . | ||||
| Mean . | 2.5% . | Median . | 97.5% . | |
| Extraction and PCR | 0.0083 | 0.0056 | 0.0081 | 0.012 |
| Gel run | 0.0068 | 0.0014 | 0.0067 | 0.013 |
| . | Estimated SDs . | |||
|---|---|---|---|---|
| Percentiles . | ||||
| Mean . | 2.5% . | Median . | 97.5% . | |
| Extraction and PCR | 0.0083 | 0.0056 | 0.0081 | 0.012 |
| Gel run | 0.0068 | 0.0014 | 0.0067 | 0.013 |
Estimated SDs are given in units of relative allele frequency.
Association between allele frequencies in different twins
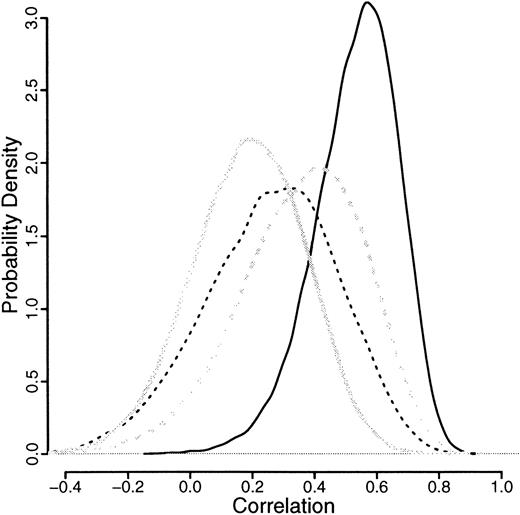
The means of all the correlations, illustrated in Figure5, are more than 0, indicating a positive correlation. Only the granulocytic allele frequencies for monozygotic twins have a negligible proportion of the distribution less than 0. For the monozygotic T cells, dizygotic T cells, and granulocytes, about 10% of the distribution is below 0, which suggests some congenital effect also.
Relative likelihood curves of the correlations for granulocytic and T-cell allele frequencies after logit transformation.
Results from granulocytes are in solid lines, those from T cells are in broken lines; both are split by monozygotic (dark lines) and dizygotic (light lines) twins.
Relative likelihood curves of the correlations for granulocytic and T-cell allele frequencies after logit transformation.
Results from granulocytes are in solid lines, those from T cells are in broken lines; both are split by monozygotic (dark lines) and dizygotic (light lines) twins.
The genetic component can be expressed as the ratio of additive genetic variance to total phenotypic variance (h2). In the case of twins, this can be expressed ash2 = 2(rMZ − rDZ), where rMZ and rDZ are the intraclass correlations for monozygotic and dizygotic twins, respectively.34 This approach estimates the contribution to variance of the genetic component as 2 × (0.53-0.19) = 0.68 for neutrophils and zero for T cells (Table2). Similar estimates were obtained using variance-components methodology34 (details not shown). In addition, the fact thatrMZ > 2.rDZ suggests the possibility of a dominant effect,35 although the numbers are too small to confirm this.
The mean and 95% probability interval for the correlation between twin pairs for T cells and granulocytes
| . | Monozygotic twin pairs . | Dizygotic twin pairs . |
|---|---|---|
| Granulocytes | 0.53 (0.24, 0.75) | 0.19 (−0.17, 0.52) |
| T cells | 0.26 (−0.18, 0.64) | 0.36 (−0.077, 0.70) |
| . | Monozygotic twin pairs . | Dizygotic twin pairs . |
|---|---|---|
| Granulocytes | 0.53 (0.24, 0.75) | 0.19 (−0.17, 0.52) |
| T cells | 0.26 (−0.18, 0.64) | 0.36 (−0.077, 0.70) |
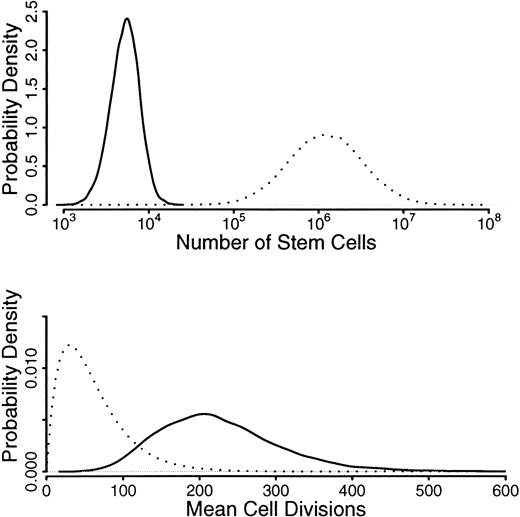
Mathematical modeling of stem cell division to explain acquired skewing
We use prior distributions for N andG, which are shown in Figure6 as dotted lines: a distribution for N, which is centered around 106 but with values from 105 to 107,36-38 and a distribution for g, which had a mean of 50 but allowed values from 0 to 400.39The inferred distributions are well away from the prior values, indicating that the random drift model is insufficient to explain the amount of drift seen in these allele frequencies. In other words, only an unrealistically low number of stem cells and/or an unrealistically high number of divisions could wholly account for the amount of acquired skewing observed. Indeed, Abkowitz and coworkers had to decrease the number of stem cells to about 30 before stochastically acquired skewing was evident.30
Before and after probabilities from modeling asymmetric stochastic stem cell division.
Presented in order to attempt to explain the phenomenon of acquired skewed X inactivation.
Before and after probabilities from modeling asymmetric stochastic stem cell division.
Presented in order to attempt to explain the phenomenon of acquired skewed X inactivation.
Discussion
The main finding of this study is a large genetic component in the determination of asymmetric methylation of X-chromosome alleles in the granulocytes of elderly twins. This is in accordance with a recent paper by Christensen and colleagues.29 Our data extend these observations. Not only do we present data comparing X inactivation in granulocytes versus T cells, rather than just peripheral blood, but we also have analyzed the effect in dizygotic as well as monozygotic twins, which permits an estimate of heritability. Furthermore, our estimates of correlation and therefore heritability take into account experimental error. Finally, we have provided a quantitative analysis of acquired stochastic skewing. Our estimate of the heritability of acquired skewing is 68% of the observed variance in granulocytic allele frequencies. Although the conclusion that genetic factors are important is statistically significant, it should be emphasized that the confidence intervals of the estimate of heritability are wide (0%-100%), due to the relatively low number of dizygotic twins analyzed. We believe the most plausible mechanism underlying this phenomenon is genetically determined selection of hematopoietic stem cells (HSCs) with one active X chromosome over those with the other, although other possible mechanisms are discussed later. Stem cells are believed to divide throughout life. After each division, the 2 daughter cells may remain as stem cells or either differentiate or die. The first of these possibilities is believed to occur with a probability of 0.5, so that each stem cell has a probability of 1.0 of continuing as a stem cell after division. Furthermore, good evidence indicates that this choice is stochastically determined, both with respect to fate and time.30 40 If the replacement ratio were higher in the stem cells with one X chromosome active than those with the other, then one X chromosome would predominate over the other with passing years. Because this effect would likely be exponential, the absolute difference in ratio from 1.0 need only be relatively small.
To estimate the magnitude of this effect, it is necessary to know the mean rate of stem cell division, which has not been measured directly in humans. However, extrapolating from the rate of telomere loss with age,41 as well as an independent approach analyzing the randomization of mutant cells with age,39 indicates that human HSCs divide about once per year. It seems unlikely that division occurs much less often. In this case, a difference of 0.02 in the replacement ratio (1.01 for one X chromosome, 0.99 for the other) would lead to a ratio of 3.32 in the ratio of the 2 alleles over 60 years or divisions. Likewise, a difference of 0.002 in the replacement ratio (1.001 for one X chromosome, 0.999 for the other) would lead to a ratio of 1.13. These figures span most of the reported range of acquired skewing. Furthermore, this mechanism, being exponential, is consistent with the degree of acquired skewing being inapparent throughout most of the life span, then apparently increasing markedly over the age of 60. However, longitudinal data from Safari cats imply that the process of genetic selection may be more complex than the simple exponential model considered here.28
The degree of skewing seen in our study was less than that reported by others. We believe the most likely explanation for this discrepancy is that our subjects were slightly younger than the subjects of other studies. Another possible explanation is that both the number of stem cells and their cycling rate increase in old age. Although the number of stem cells is believed to remain approximately constant with respect to age, some evidence indicates that the number may increase in elderly mice.42 43
Although the degree of acquired skewing in our study is relatively weak, it appears to be common. Perusal of Figures 1 through 4, and the supporting randomization statistic from the first equation, indicate that the deviation of granulocytic from T-cell allele ratios tends to be in the same direction even when the degree of deviation is small. Thus, it appears that most X-chromosome pairs have some degree of differential selective pressure that becomes apparent after many cell divisions. However, the degree of selection varies between different pairs of X chromosomes and so the time of life at which the difference becomes apparent also varies. We would predict that if sufficiently old individuals were studied most would exhibit acquired skewing, even by the rigorous criteria of other authors.20,23-25 29
The second main finding of this study is that there is probably a congenital component in the determination of asymmetric methylation of X-chromosome alleles in the T cells of elderly twins. This may arise from some form of genetic determination or a shared placental circulation. On one hand, evidence from a study of X-inactivation ratios of monozygotic twins during childhood revealed that the two thirds of monozygotic twins who were monochorionic had more similar allele ratios than those of dichorionic monozygotic twins.44 Although the form in which those data were reported precludes exact comparison with our data, when our data for T cells are presented in a similar way the 2 distributions are not easy to distinguish (analysis not shown). This observation suggests that the main reason for the correlation of T-cell ratios in our study is that many twins shared a circulation in utero. On the other hand, the degree of similarity in T cells in our study was similar in both dizygotic and monozygotic twins. In dizygotic twins, many of the alleles could be clearly distinguished from one another and we saw no evidence of a contribution from any “third” alleles. These observations suggest a degree of genetic determination of T-cell allele ratios.
T cells are relatively long lived and so, in studies on X inactivation in adults, they have been considered to reflect X-inactivation status at the time of birth. Furthermore, the status at the time of birth is assumed to be determined randomly, in fact by a binomial process where the number of cells at inactivation is about 7 to 15.17-20 If T-cell inactivation ratios are partly genetically determined, then one or both of these assumptions are wrong. A priori considerations concerning T-cell physiology would suggest the former assumption is inaccurate in at least 2 ways. First, although most T-cell production from HSCs occurs early in life, some production continues throughout life45,46 and so skewed HSCs will result in skewed T cells, although the degree of skewing will lag behind that in the granulocytic fraction. Second, T cells comprise a pool of constant size within which clones dynamically expand and contract depending on antigenic exposure.47 These processes should also contribute to stochastically determined variance. It is also possible that the latter processes are partly determined by polymorphic X-linked determinants, but this would be expected to be subject to too many uncertainties to make quantitative modeling worthwhile.
Furthermore, the assumption that the distribution of inactivation ratios is determined by a small number of cells at the time of inactivation may also be wrong. Several other explanations are also possible. First, it is possible that some alleles are preferentially amplified in the PCR reaction over others. Although this can be controlled for by comparing prerestriction and postrestriction ratios, our unpublished data (manuscript in preparation) suggest that methylation status may affect the predigestion ratio, making it difficult to quantitate such an effect. Second, the process of X inactivation itself might be subject to polymorphic X-linked determinants.48 In particular, it is possible that a residual degree of imprinting at the Xist locus before gastrulation may render the process nonrandom. Our data cannot cast light on these possibilities; longitudinal studies on twinned neonatal blood and other family members would have to be studied. Whatever the mechanism underlying the correlation of T-cell ratios, our data indicate that caution should be exercised in regarding T cells as controls for the original state of X-inactivation.
Although our data indicate that genetic factors are important determinants of acquired skewing, this effect does not account for all of the observed variance. Experimental error accounts for some of the remaining variance, but it seems plausible that asymmetric stochastic cell division accounts for much of the remaining variance. However, in addition to our experimental data, we have provided a quantitative analysis of the likely effects of this mechanism on acquired skewing and have shown that, on current estimates of stem cell number and turnover, the mechanism is unlikely to account fully for the data. Although it would be possible in principle to use the observed residual variance to estimate stem cell number and turnover, we feel the uncertainties in such a process would make the values of the parameters obtained of little use. It is also possible that environmental effects contribute but these would be difficult to analyze.
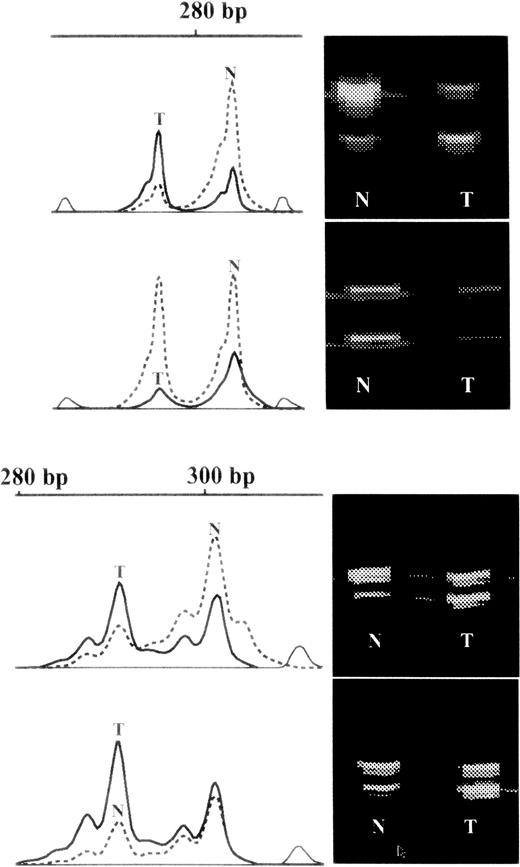
Finally, 2 monozygotic individuals exhibited markedly skewed granulocytic X inactivation compared to their respective T cells and compared to their cognate twin (Figures 4 and 7). The degree of discrepancy is beyond that which can be easily explained by any stochastic asymmetric division mechanism superimposed on genetic selection. We suggest that these cases represent overrepresentation of a single clone of cells. It is of interest that this frequency is about the same as the proportion who will go on to develop a hematopoietic stem cell malignancy (myeloproliferative disorders, chronic myeloid leukemia, most acute myeloid leukemia and myelodyplasia in the elderly) over the next 30 years.49 However, the peripheral blood count of one of these 2 individuals was not significantly different from that of either their twin or the other individuals in the study. Data on the other individual were not available.
Examples of raw data.
On the right hand side of each panel are virtual images of fluorescent bands from the gel. Those from the granulocytes are marked N and those from the T cells are marked T. On the left hand side of the panel are shown the intensities of the corresponding bands on a vertical scale plotted against molecular weight in base pairs (bp) on the horizontal scale. Those from granulocytes are marked in interrupted lines and those from T cells in solid lines. In the lower part of the diagram is shown an example of skewed X inactivation in granulocytes but the drift from that in the T cells is similar in each of the monozygotic twin pairs, which is probably due to genetic selection of one chromosome over the other. In the upper part of the diagram are shown data from one of 2 individuals with skewed X inactivation compared to both their T cells and cognate twin (also shown), which is difficult to explain with a selective mechanism.
In summary, the mechanisms controlling X-inactivation ratios in normal subjects are complex. Our data show that there is a large genetic component in the determination of this ratio in granulocytes and indicate a smaller genetic component in the ratio of T cells. It seems likely that stochastic asymmetric stem cell division contributes to acquired skewing, but is unlikely to be the major contributor. Two of the 94 informative subjects studied had X-inactivation ratios skewed markedly in the opposite direction to their twin, which may be explained by clones with a proliferative advantage.
We thank Rona Morrison for many of the DNA extractions, Gabriella Surdelescu for blood collection, and Kourosh Ahmadi for assistance with the twin analysis.
Supported by the Aberdeen Royal Infirmary Leukaemia Research Fund. The Twin Research Unit receives grants from the Arthritis and Rheumatism campaign, the Wellcome Trust and Gemini Genomics Ltd.
The publication costs of this article were defrayed in part by page charge payment. Therefore, and solely to indicate this fact, this article is hereby marked “advertisement” in accordance with 18 U.S.C. section 1734.
References
Author notes
Mark A. Vickers, Department of Haematology, Medicine and Therapeutics, University of Aberdeen, Foresterhill, Aberdeen, AB25 2ZD, UK; e-mail: m.a.vickers@abdn.ac.uk.

This feature is available to Subscribers Only
Sign In or Create an Account Close Modal