It has recently been shown that the Gardos channel activity of mouse erythrocytes can be modified by endothelins, suggesting a functional linkage between endothelin receptors and the Gardos channel. Using 86Rubidium (86Rb) influx, effects were estimated of proinflammatory molecules such as platelet activator factor (PAF), endothelin-1 (ET-1), interleukin-10 (IL-10), and regulated on activation normal T cells expressed and secreted (RANTES) on the Gardos channel activity in human normal and sickle red cells. It was found that PAF (EC50: 15 ± 7 nM), RANTES (EC50, 9 ± 6 ng/mL [1.2 ± 0.8 nM]), IL-10 (EC50, 11 ± 8 ng/mL [204 ± 148 nM]), and ET-1 (EC50, 123 ± 34 nM) induce a significant increase in Gardos channel activity—between 28% and 84%—over the control. In addition, these agents modify the Gardos channel affinity for internal Ca++ (K0.5) by 2- to 6-fold. Biochemical evidence is provided for the presence of ET receptor subtype B in sickle and normal red cells. Furthermore, it was found that ET-1, PAF, RANTES, and IL-10 induce a significant increase in red cell density (P < .05). These data suggest that activation of the Gardos channel is functionally coupled to receptor motifs such as C-X-C (PAF), C-C (RANTES), and ET receptor subtype B. Thus, cell volume regulation or erythrocyte hydration states might be altered by activation of the Gardos channel by cytokines in vivo. The role of these mediators in promoting sickle cell dehydration in vivo is under investigation.
Introduction
Sickle cell disease is characterized by chronic hemolytic anemia, frequent infection, and occlusion of the microcirculation that result in organ damage and painful episodes. Plasma levels of several proinflammatory and adhesive cytokines have been shown to be increased in sickle cell disease.1-5However, little is known about their contribution to its pathogenesis, though a relationship between adhesiveness of the sickle cells and the clinical state of the patients has been observed.6 It has been postulated that factors that activate vascular endothelium may enhance the attachment of young reticulocytes and sickle cells to the endothelium and may cause delays in the passage of red cells through the microcirculation.7,8 The prolonged microvascular transit time of sickle red cells may then provide the necessary time for hemoglobin polymerization, cell sickling, and vaso-occlusion to occur.9
Red cell sickling and adhesion are favored by cellular dehydration, which increases the rate of hemoglobin polymerization and cell sickling.10 Previous data have shown that the dehydration of sickle erythrocytes mediated by the Ca++-activated K+ channel (Gardos channel) can be activated in vitro by oxygenation–deoxygenation cycles.11 Blockade of the Gardos channel by clotrimazole induces a reduction in red cell dehydration in vivo and in vitro.12,13 We postulated that activators of the Gardos channel might favor the formation of dense sickle cells and cell entrapment in the microvasculature. The arachidonic acid derivative prostaglandin E2 has been shown to activate the erythrocyte Gardos channel in healthy subjects and to alter size and membrane deformability.14 We recently found that endothelin-1 (ET-1) can also induce activation of the Gardos channel through a protein kinase C (PKC)–dependent mechanism in mouse erythrocytes.15 Here we describe the effect of various cytokines on the Gardos channel activity and their relationship with cell volume regulation in normal and sickle erythrocytes. In addition, we provide evidence that the ET-1 receptor subtype B (ETB) gene is transcribed in the erythroid precursors. The data suggest that activation of the Gardos channel might be functionally coupled to receptors such as C-X-C (PAF), C-C (RANTES), and ET receptor subtype B-1.15-17
Materials and methods
Drugs and chemicals
Charybdotoxin (ChTX), ET-1, BQ788 (selective ETBreceptor antagonist), BQ123 (selective ETA receptor antagonist), interleukin-10 (IL-10), and RANTES (regulated upon activation normal T cells expressed and secreted) were purchased from RBI Signal Innovation (Natick, MA). All peptides were prepared as indicated by the manufacturer and were stored at −20°C for less than 2 months. A23187 ionophore was purchased from Calbiochem-Novabiochem (La Jolla, CA). The iodinated ligand ET-1 and 86Rb were purchased from Du Pont-New England Nuclear (Boston, MA). All other reagents were purchased from Sigma Chemical (St Louis, MO).
Erythrocyte preparation
Human blood was collected in tubes containing heparin, passed through cotton to decrease the number of white cells, and separated in a Sorvall RC 28S (Newtown, CT) centrifuge for 4 minutes at 4°C and 2500 rpm. Erythrocytes were washed 4 times with isotonic choline washing solution (CWS) containing 145 mM choline chloride, 1 mM MgCl2, and 10 mM Tris-MOPS, pH 7.4 (4°C), and were placed on ice for further use.
Measurement of 86Rb influx
Freshly washed erythrocytes were suspended at 2% hematocrit in an influx medium containing 145 mM NaCl, 2 mM KCl, 0.15 mM MgCl2, 0.1 mM ouabain, 10 mM Tris-MOPS, pH 7.4 (22°C), 10 μM bumetanide, and 10 μCi /mL (0.37 MBq/mL)86Rb in the presence or absence of the specified peptide agents. Preincubations with cytokines or chemokines were carried out for 20 minutes at 37°C in an isotonic sodium medium. The same concentrations of active peptides were added to the influx medium. Free ionic Ca++ in the influx medium was buffered between 0 and 7 μM with 1 mM EGTA or citrate buffer.18Ca++ concentration was calculated using the dissociation constants for EGTA or citrate and correcting for ionic strength at pH 7.4 and the presence of 0.15 mM MgCl2. At time 0 minute, A23187 ionophore (5 μM) was added, and aliquots at 2 and 5 minutes were removed and immediately spun down through 0.8 mL cold medium containing 5 mM EGTA buffer and an underlying cushion of n-butyl phthalate. Supernatants were aspirated, and the tube tip containing the cell pellet was cut off. Erythrocyte-associated radioactivity was counted in a gamma counter (model 41600 HE; Isomedic ICN Biomedicals, Costa Mesa, CA). K+ uptake was linear up to 5 minutes, and fluxes were calculated from linear regression slopes.15
ET-1 binding assays
Two different assays were used to characterize the ET-1 binding sites in intact erythrocytes, one to compare with the flux experiment and the other to look for high-affinity binding sites. In the first assay, erythrocytes were washed with CWS and were suspended at 1% hematocrit (approximately 4 × 10⁶ cells) for 15 minutes at room temperature in a binding solution containing 145 mM NaCl, 2 mM KCl, 0.15 mM MgCl2, 10 mM Tris-MOPS, pH 7.4, 0.02 mg/mL bovine serum albumin (BSA), and 100 to 500 nM [125I]-ET-1 in the absence or presence of 10 μM unlabeled ET-1, as described in the figure legends. At specific time points, aliquots of 0.1 mL were passed through Microfiber GF/B filters (Whatman International, Maidstone, England) and were washed with 5 vol binding medium at room temperature. In the second assay, binding experiments performed at 4°C the erythrocytes were washed with CWS and were suspended at 10% hematocrit for 1 hour at 4°C in a binding solution containing 145 mM NaCl, 2 mM KCl, 0.15 mM MgCl2, 10 mM Tris-MOPS, pH 8.0 (4°C), and 0.1 mg/mL BSA. Cells were centrifuged and added to a final concentration of 1 × 10⁶ cell/mL in binding medium without BSA, containing [125I]–ET-1 in the absence or presence of unlabeled ET-1. Cell suspensions were incubated up to 1 hour at 4°C unless otherwise stated. At specific time points, aliquots of 0.25 mL were passed through Microfiber GF/B filters (Whatman International) and were washed with 5 vol binding medium at 4°C. In both protocols the filters were presoaked for 1 hour at room temperature in BSA-binding solution (0.1%). Cell radioactivity-containing filters were counted in a gamma counter. All linear or nonlinear curve fittings were performed as described in the figure legends using Sigmaplot (version 5; SPSS Science, Chicago, IL), unless otherwise stated.
Cyclic oxygenation–deoxygenation and erythrocyte volume regulation experiments
Red cells were washed 3 time with CWS and were incubated in a plasmalike buffer containing 145 mM NaCl, 2 mM KCl, 25 mM NaHCO3, 10 mM glucose, 0.06 mM adenosine, 0.04 mM inosine, 0.15 mM MgCl2, and 2 mM CaCl2 with and without the specified compound for 5 hours (30% hematocrit) under a 10-minute oxygenation–deoxygenation cycle. Each cycle provided 3 minutes of 15% O2/5% CO2 balanced with N2 and 7 minutes of 5% CO2 balanced with N2 gas. The gases were humidified through bubbling in a column containing an isotonic saline solution at 37°C. Cell suspension was then transferred to an ice bath, and the medium was replaced by a Tris–MOPS-buffered isotonic saline. Density distribution curves were obtained using phthalate esters in microhematocrit tubes.12 Briefly, phthalate solutions were prepared to give a range of densities between 1.08 and 1.11 g/mL. Hematocrit tubes were filled with 30 μL cell suspension and 10 μL different phthalate solutions.13 Tubes were centrifuged at 12 200 rpm for 10 minutes at room temperature. The amount of denser cells was calculated from the amount of denser cells (lower layer) over the total amount of cells and was expressed as a percentage.
Preparation of RNA
Human blood was collected in tubes containing acid citrate dextrose solution. Total reticulocyte RNA was isolated by the ammonium chloride lysis technique.19 RNA was prepared from erythroid cultures. Two-stage erythroid culture derived from normal human peripheral blood was set up as described by Fibach et al.20 21 Cells were harvested and counted between culture days 10 and 19. In addition, RNA was prepared from primary culture of human lung microvascular endothelial cells (Clonetics, San Diego, CA) and smooth muscle cells by lysis in Trizol (Life Technologies, Rockville, MD), followed by DNase treatment and purification using the RNeasy Clean-Up protocol (Qiagen, Valencia, CA).
Reverse transcription–polymerase chain reaction amplification and DNA sequencing
RNA was reverse transcribed using random hexamers (Promega, Fitchburg Center, WI), and the cDNA was polymerase chain reaction (PCR)–amplified using primers HER-A1 (5′-GCAATGGCTCAATGCACAAC-3′) and HER-A2 (5′-TAAGACGCAGAGGTTGAGG-3′) specific for the ET-1 receptor subtype A cDNA and using primers HER-B1 (5′-GGTCTCTGTGGTTCTGGCTG-3′) and HER-B2 5′-TAAAGCAATCTGCATGCCAC-3′) specific for the ET-1 receptor subtype B cDNA. PCR conditions were 35 cycles for 10 seconds at 94°C, 30 seconds at 65°C, and 10 seconds at 74°C. Expected sizes of PCR products for ETA and ETB were 357 bp and 253 bp, respectively. The PCR product obtained from erythroid precursors was sequenced using the ABI 377 automated sequencer.
Results
Functional characterization of sickle erythrocyte Gardos channel
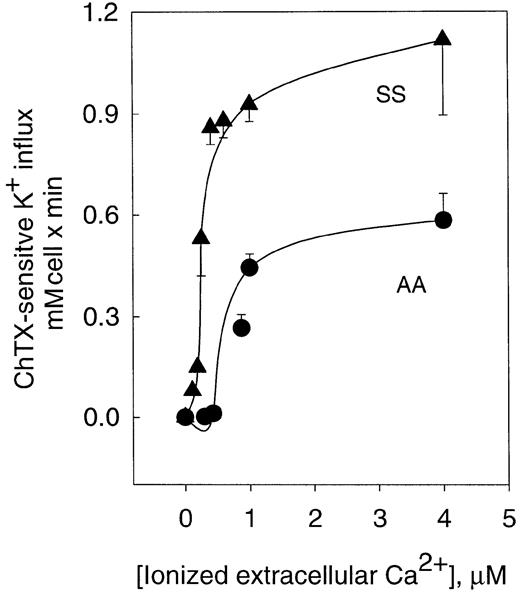
Activation of the K+ influx by cellular Ca++ was studied by clamping intracellular Ca++at desired values with the Ca++ ionophore A23187.22 Figure 1 shows the dependence of ChTX-sensitive K+ influx on extracellular free Ca++ in normal and sickle erythrocytes. In normal erythrocytes, K+ influx increased rapidly and saturated approximately 0.6 mmol/L cells × minute, when Ca++was increased to 4 μM. Nonlinear fitting of the experimental points for a sigmoid function gave a Vmax of 0.71 ± 0.14 mmol/1013 cells per minute (n = 10). ChTX-sensitive flux kinetic analysis showed a constant affinity for Ca++(K0.5) of 1.21 ± 0.66 μM (n = 3). Similar experiments, in sickle erythrocytes, revealed that the Vmaxof the system was significantly higher than in normal erythrocytes (from 0.71 to 1.49 ± 0.24 mmol/1013 cells per minute, n = 3, P < .05). In addition, sickle erythrocytes showed a significantly lower affinity constant for Ca++(from 1.21 to 0.46 ± 0.3 μM, n = 3, P < .045). Thus, in sickle erythrocytes, activation of the Gardos channel occurs at a much lower intracellular Ca++ concentration than in normal cells. This difference in the Ca++activation set point of the channel between normal and sickle erythrocytes might imply that smaller changes in cytosolic Ca++ could trigger the activation of the K+channel in sickle erythrocytes. These results are in accord with previous studies in which differences between sickle and normal red cells were found in relation to the Ca++ affinity constant for the human channel measuring K+efflux.18
Activation curve of K+ influx by ionized Ca++ in human normal and sickle erythrocytes.
ChTX-sensitive K+ influx was calculated from the total K+ influx subtracted from the influx in the presence of 50 nM ChTX. Experimental points are expressed as mean ± SE of at least 3 experiments in duplicate determinations.
Effects of cytokines on Gardos channel activity in erythrocytes
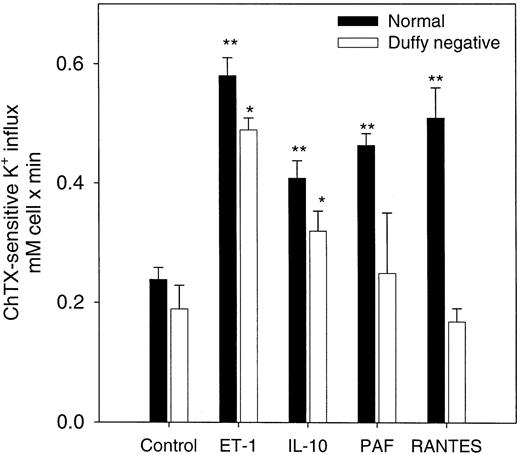
RANTES, PAF, IL-10, and ET-1 have been shown to increase cytosolic Ca++ in a variety of mammalian cells.23-25 A promiscuous chemokine receptor that binds C-X-C– and C-C–type chemokines with high affinity has been shown in erythrocytes.17 26-29 We tested the effects of RANTES (C-C) and other cytokines that mediate their action through other specific receptors such as ET-1, IL-10, and PAF on Gardos channel activity in normal erythrocytes in the presence of 5 μM A23187 and 1 μM ionized extracellular Ca++. As shown in Figure2, all 4 cytokines significantly increased channel activity in normal erythrocytes. To determine the specificity of these effects on the Gardos channel by the chemokine receptor, we performed similar experiments using erythrocytes that lacked the Duffy antigen receptor (Figure 2). In Duffy-negative erythrocytes, ET-1 and IL-10 were able to stimulate Gardos activity significantly (n = 3, P < .03). As expected, the presence of RANTES and PAF did not further induce activation of the Gardos channel in Duffy-negative cells.
Effects of cytokines on the Ca++-activated K+ influx (Gardos channel) in normal and Duffy-negative erythrocytes.
Channel activity was expressed as the difference between the total K+ influx in the presence of A23187 ionophore (1 μM ionized Ca++). The K+ influx was measured in the presence and the absence of 50 nM ChTX. Influx media contained the indicated amount for each of these agents: 20 ng/mL (370 nM) IL-10; 20 ng/mL (2.6 nM) RANTES; 100 nM PAF; 500 M ET-1. Results are expressed as the mean ± SE of 3 experiments in duplicate determinations. The statistical difference was determined using the control values against the values in the presence of the cytokines for each cell type. **P < .03; *P < .05.
Kinetic analysis of the Gardos channel activity in the presence of these cytokines indicated that IL-10, RANTES, and PAF factors modified the constant affinity for intracellular Ca++ and increased the apparent maximal velocity (Vmax) of the channel transport (Table 1). A dose-response curve of the effects of these peptides on channel activity indicated a 50% stimulatory concentration (EC50) of channel activity at the nanomolar level, suggesting the specificity of channel activation by these peptides (Table 1). Because intracellular Ca++ was clamped at a specific concentration, a change in free intracellular Ca++ could not account for Gardos channel activation.
Effects of cytokines on the kinetics parameters of the Gardos channel in human erythrocytes
| . | Vmax mmol/ 1013 cells per min . | Ca2+ K0.5 (μM) . | EC50 . |
|---|---|---|---|
| Control | 0.71 ± 0.14 | 1.21 ± 0.7 | — |
| IL-10 | 2.09 ± 0.13* | 7.0 ± 1.6* | 11 ± 8 ng/mL (204 ± 148 nM) |
| RANTES | 0.93 ± 0.06* | 2.2 ± 0.3* | 9 ± 6 ng/mL (1.2 ± 0.8 nM) |
| PAF | 0.77 ± 0.01* | 2.1 ± 0.4* | 15 ± 7 nM |
Values are means ± SE of 3 experiments in duplicate determinations. The affinity constant for intracellular Ca2+ (K0.5) and the maximal velocity (Vmax) were calculated from the ChTX-sensitive K+ influx in the presence of different cytokines, as described in “Materials and methods.” RANTES, 20 ng/mL (2.6 nM); PAF, 100 nM; IL-10, 20 ng/mL (370 nM).
Paired t test
P < .05, when compared with control conditions.
ET-1 alters the kinetic parameters of the Gardos channel in human erythrocytes
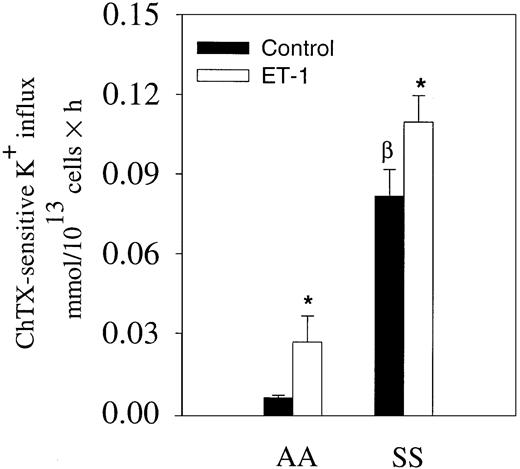
We have shown that ET-1 activates the Gardos channel of mouse erythrocytes.15 Because ET-1 has been found consistently elevated in the plasma of patients with steady state sickle cell disease, we measured ChTX-sensitive K+ influx in the presence and absence of 300 nM ET-1 in normal and sickle erythrocytes in the absence of Ca++ ionophore A23187 (Figure3). The medium contained 1.5 mM Ca++. In normal erythrocytes, ChTX-sensitive K+influx tripled in cells incubated with 300 nM ET-1. In sickle erythrocytes, we also observed a 38% increase after 300 nM ET-1 incubation (Figure 3). These data, obtained in the absence of any Ca++ ionophore, suggest that ET-1 might induce changes in red cell volume by increasing K+ flux in vivo.
Effects of ET-1 on K+ influx in normal and sickle erythrocytes in physiological conditions.
Erythrocytes were incubated with and without 300 nM ET-1 for 30 minutes at 37°C in physiological saline medium containing 1.5 mM CaCl2 and 10 μCi/mL (0.37 MBq/mL)86Rb+. K+ uptake was measured at 3 different time points. The slope of the linear curve represents the K+ influx for each condition (300 nM ET-1). Values are expressed as mean ± SE of 3 experiments in duplicate. *P < .04; βP < .03.
To further characterize ET-1 effects on human red blood cells, we studied the specific effect of ET-1 on the kinetic properties of the Gardos channel. The dependence of the channel activity on free Ca++ was determined in normal and sickle erythrocytes pretreated with (or without) 500 nM ET-1 (Table2). Vmax of the channel increased 2-fold in normal erythrocytes pretreated with ET-1 (P < .03). The increase in the Vmax of the Gardos channel by ET-1 suggested that ET-1 receptor activation increases either the open time of active units or the number of active channels by recruiting quiescent channels. Ca++ dependence of ET-1–induced ChTX-sensitive K+ influx shows that the K0.5 for Ca++ decreases from 1.2 ± 0.7 to 0.6 ± 0.1 μM (P < .03). This suggests that the activation of endothelin receptors in normal erythrocytes regulates the Ca++ affinity site or an undefined Ca++-dependent regulatory protein closely related to the Gardos channel. In sickle erythrocytes, Vmax was almost doubled in the presence of ET-1 (from 1.5 ± 0.2 to 2.15 ± 0.01 mmol/1013 cells per minute; P < .045), and K0.5 was significantly reduced from 0.5 ± 0.03 to 0.21 ± 0.01 μM (P < .03). A dose-response curve of ET-1 effects on the channel activity indicated an EC50 of 123 ± 34 nM in normal human erythrocytes.
ET-1 alters kinetic parameters of Gardos channel in AA and SS erythrocytes
| Subjects . | Control . | ET-1 . | ||
|---|---|---|---|---|
| Vmax mmol/1013 cell per min . | K0.5 μM . | Vmax mmol/1013cell per min . | K0.5 μM . | |
| AA | 0.71 ± 0.14 | 1.21 ± 0.66 | 1.06 ± 0.05† | 0.63 ± 0.14† |
| SS | 1.49 ± 0.24* | 0.460 ± 0.03* | 2.15 ± 0.01† | 0.21 ± 0.01*,† |
| Subjects . | Control . | ET-1 . | ||
|---|---|---|---|---|
| Vmax mmol/1013 cell per min . | K0.5 μM . | Vmax mmol/1013cell per min . | K0.5 μM . | |
| AA | 0.71 ± 0.14 | 1.21 ± 0.66 | 1.06 ± 0.05† | 0.63 ± 0.14† |
| SS | 1.49 ± 0.24* | 0.460 ± 0.03* | 2.15 ± 0.01† | 0.21 ± 0.01*,† |
Kinetics parameters were estimated from the best fitting of experimental points using nonlinear sigmoid regression analysis. Values are mean ± SE of 3 experiments in duplicate determinations. ET-1, 500 nM.
P < .045 (AA vs SS).
P < .033 (paired t test: control vs ET-1).
ET-1 receptor in normal and sickle erythrocytes
We previously demonstrated the presence of ET receptors in mouse erythrocytes.15 To test whether ET-1 specifically binds to an endothelin receptor in human erythrocytes, we measured [125I]–ET-1 binding to intact normal erythrocytes. Specific [125I]–ET-1 binding reached a plateau in 30 minutes at room temperature (data not shown). Specific binding to erythrocytes was a saturable process consistent with a specific receptor interaction. Specific binding was similar between sickle and normal erythrocytes (Figure 4). To evaluate the specific characteristic of the ET-1 receptor in normal and sickle erythrocytes, we measured the specific binding of radiolabeled ET-1 as a function of [125I]–ET-1 concentration in normal and sickle erythrocytes at room temperature. Scatchard analysis revealed the presence of an affinity binding site with an apparent dissociation constant (Kd) of 128 ± 73 nM and a maximal binding capacity (Bmax) of 238 ± 53 sites/cell for normal red blood cells. In sickle cells, similar values were obtained (Kd = 244 ± 105 nM, Bmax = 336 ± 78 sites/cell).
ET-1 binding in normal and sickle erythrocytes.
Specific binding of [125I]–ET-1 as a function of radiolabeled ET-1 concentration. Scatchard plot of the specific binding of iodinated ET-1 gave a Kd of 244 ± 105 nM and 336 ± 78 sites/per cell for sickle red cells. TheKd for normal red cells was 128 ± 73 nM, with a maximal binding capacity of 238 ± 53 sites/cell. No statistically significance differences were found between sickle and normal erythrocytes. The line represents the nonlinear regression of experimental points. Values are mean ± SE of 3 similar experiments.
Experiments performed at 4°C indicated that the specific [125I]–ET-1 binding reached a plateau in 60 to 80 minutes at 4°C (data not shown). Under these experimental conditions, specific binding was also similar between sickle and normal erythrocytes. However, Scatchard analysis revealed the presence of a class of higher affinity-binding sites with an apparentKd of 47 ± 8 pM and a Bmax of 277 ± 23 sites/cell for normal erythrocytes (not shown). In sickle cells, similar values were obtained (Kd = 48 ± 10 pM, Bmax = 307 ± 56 sites per cell; not shown). Although we were only able to detect one class of binding site under experimental conditions that resembled the ET-1–stimulated Gardos channel activity in human erythrocytes, the possibility of 2 ET-1–binding sites, as we described previously in mouse erythrocytes, 15 should not be eliminated.
ETB receptor antagonist inhibits ET-1–induced Gardos activity in human erythrocytes
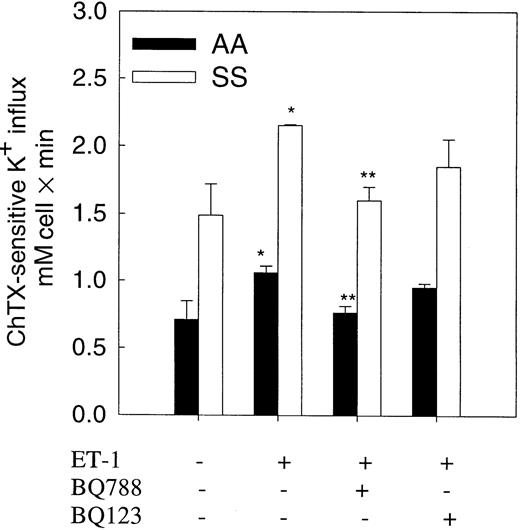
To test whether ET-1 action on the Gardos channel was mediated by an ETB receptor as seen in mouse erythrocytes, we measured the effect of the ET receptor antagonists, BQ123 and BQ788, on Gardos channel activity in normal and sickle erythrocytes (Figure5). Preincubation of erythrocytes with ET-1 (500 nM) was performed in the presence or absence of BQ788 or BQ123 (1 μM) for 20 minutes at 37°C. BQ788, a specific and selective ETB antagonist, significantly (85%-90%) decreased ET-1–induced activation of the Gardos channel in both cell types. BQ123, a specific antagonist of ETA receptors, did not significantly decrease ET-1–induced Gardos activity.
Effect of selective ET-1 receptor antagonists on ET-1–induced Gardos activity in normal and sickle erythrocytes.
Human red cells were preincubated with and without 500 nM ET-1 and antagonists for 20 minutes at 37°C in isotonic sodium medium. K+ influx was measured in a medium containing 1 μM Ca++ ionized and 5 μM A23187 in the presence of ET-1 or selective antagonists with and without 500 nM ChTX. BQ123, a selective ETA receptor antagonist; BQ788, a selective ETBreceptor antagonist. Values are expressed as mean ± SE of 3 experiments. *P < .04 (control vs ET-1); **P < .04 (ET-1 vs BQ788).
ETB mRNA is detected in erythroid precursors
PCR amplification of reverse-transcribed RNA isolated from erythroid precursors of healthy subjects yielded a product corresponding to ETB. In control experiments, we amplified the ETA from smooth muscle cell cDNA and the ETB from endothelial cell cDNA. No PCR product was amplified from erythroid precursor cDNA using primers specific for ETA, whereas a band of the expected size, 357 bp, was obtained from smooth muscle cell cDNA. A PCR product of 253 bp, corresponding to ETB, was PCR amplified from the erythroid precursor cDNA and from endothelial cells. DNA sequencing of the PCR product obtained with primers HER-B1 and HER-B2 confirmed that it corresponded to mRNA encoding human ETB receptor.
Protein kinase C effects on Gardos channel in human erythrocytes
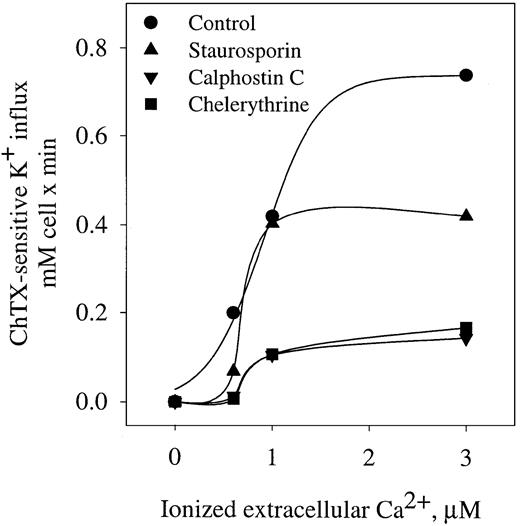
The role of PKC as a regulator of the Gardos channel has been suggested in human sickle and mouse erythrocytes.15,30 To evaluate the effect of PKC on Gardos channel activation, we measured Gardos channel activity in cells pretreated with different inhibitors of PKC in human erythrocytes (Figure 6). Staurosporin and chelerythrine are potent inhibitors of PKC by competitive inhibition of adenosine triphosphate binding.31 Calphostin C is a potent, selective PKC inhibitor that affects the phorbol-ester binding site. All 3 inhibitors significantly decreased the Vmax of the channel—staurosporin from 0.75 ± 0.2 to 0.41 ± 0.1 mM cell per minute (P < .05), calphostin C to 0.13 ± 0.01 mM cell per minute (P < .05), and chelerythrine to 0.11 ± 0.02 mM cell per minute (P < .05). Furthermore, calphostin C and chelerythrine were able to significantly increase the affinity constant for Ca++ (K0.5) from 0.9 ± 0.1 μM to 1.3 ± 0.1 μM (n = 3, P < .05). These data indicate that Gardos channel activity is modulated by PKC in human erythrocytes.
Effect of PKC inhibitors on ChTX-sensitive K+ influx in normal erythrocytes.
Cells were preincubated with the different inhibitors of PKC, and K+ influx was determinate as a function of ionized extracellular Ca++ in the presence of A23187 as described in “Materials and methods.” Staurosporin, 5 μM; calphostin C, 1 μM; chelerythrine, 10 μM. Values are means of triplicate determinations.
ET-1–induced dense cell formation in sickle erythrocytes
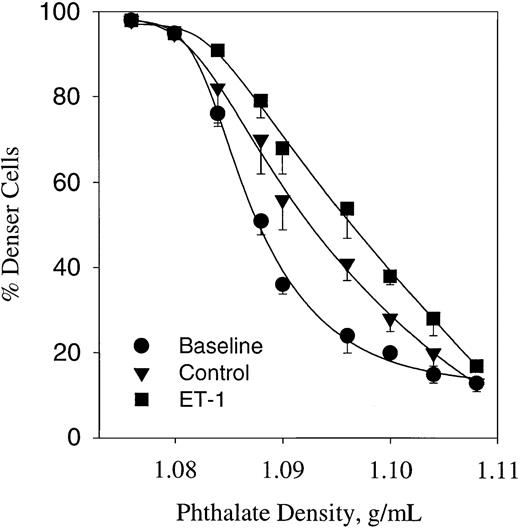
It has been shown that cycles of deoxygenation and oxygenation induce dense cell formation in sickle erythrocytes.11 The cyclic oxygenation–deoxygenation protocol used here also induces a significant change in the density profile, as shown in Figure7. Analysis of the baseline density profile indicates a median density (D50) of 1.086 g/mL. This value was significantly increased up to 1.092 ± 0.0003 (n = 4, P < .05) after 5 hours of deoxygenation–oxygenation cycles in a plasmalike buffer containing 1.5 mM CaCl2. Under similar conditions, the effect of 300 nM ET-1 was tested (Figure 7). ET-1 shifted the phthalate density profile curve to the right, increasing further the D50 up to 1.098 (n = 3, P < .05). These data suggest that ET-1 enhances dense cell formation mediated by the Gardos channel.
Erythrocyte profile of sickle cells expressed as percentage of cells below phthalate ester (denser cells).
Cells were incubated in the presence or absence of ET-1 for 5 hours at 37°C in plasmalike buffer connected with a humidifier–gas regulator that cycled 15% O2/5% CO2 (3 minutes) or 5% CO2 (7 minutes). All gases were balanced with N2. Baseline represents the cell density profiles at time 0. ET-1, 300 nM. Values are mean ± SE of 3 experiments.
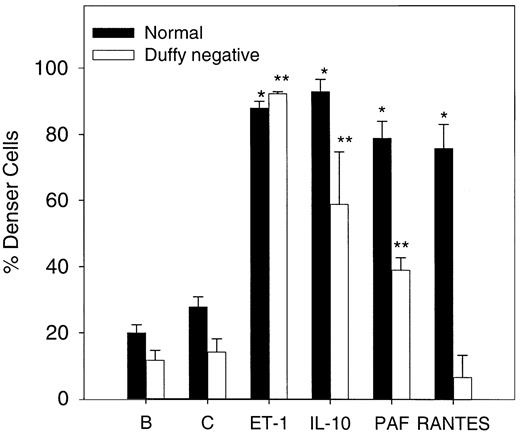
To evaluate the effect of the chemokine receptor on cell dense formation, deoxy-oxygenation experiments were performed in normal and Duffy-negative erythrocytes. The cytokine effects on density of the red cell after 5 hours of deoxygenation and oxygenation cycles were determined using 1.1 g/mL phthalate oil. As Figure8 shows, normal erythrocyte density increases significantly (n = 3, P < .05) in the presence of 20 ng/mL (370 nM) IL-10, 200 nM PAF, and 20 ng/mL (2.6 nM) RANTES and of 500 nM ET-1 compared with the control value under similar conditions. In Duffy-negative erythrocytes, similar results were found with ET-1 and IL-10 but not with RANTES, in accordance with the absence of this receptor. PAF increased significantly (n = 3,P < .05) the amount of dense cells, which suggests that PAF actions are not mediated by chemokine receptor.
Erythrocyte density after oxygenation–deoxygenation cycles in the presence of various cytokines.
Cells were incubated in the presence or absence of 500 nM ET-1, 20 ng/mL (370 nM) IL-10, 20 ng/mL (2.6 nM) RANTES, and 200 nM PAF for 5 hours at 37°C in plasmalike buffer (as described in “Materials and methods”). B, baseline; C, control. Baseline represents the cell density at time 0. Densities were measured using 1.1 g/mL phthalate oil solution. Values are mean ± SE of 3 experiments. *P < .004 (normal cells vs control); **P < .03 (Duffy-negative red cells vs control).
Discussion
Elevated levels of cytokines such as ET-1,4,5IL-8,2 and PAF1,32 have been found in the plasma of patients with sickle cell disease. It is believed that they play an important role in the adhesion of sickle erythrocytes to the endothelium and in the pathogenesis of vaso-occlusive episodes.1,3 Based on our previous finding that ET-1 induced activation of the Gardos channel in mouse red cells,15 we speculated that cytokines might promote vaso-occlusion and sickling by inducing sickle erythrocyte dehydration through the activation of the Gardos channel. We have shown in this report that several cytokines can activate the Gardos channel in human erythrocytes (Tables 1, 2).
The physiological role of the chemokine receptor in red cells was unknown, but clearance of chemokines from the circulation has been proposed.28 This receptor is identical to the Duffy antigen, which also functions as a receptor for Plasmodium vivax.33 We have presented evidence that this receptor might also be involved in red cell volume regulation because we found that RANTES and PAF significantly modulated the Vmax and the Kd for intracellular Ca++ of the Gardos channel. These findings are in agreement with previous reports that activation of the chemokine receptor induced an increase in the Ca++-activated K+ current in human primary macrophage cultures.34 In addition, the absence of Gardos channel stimulation by RANTES in Duffy-negative red cells suggested a specific interaction of this receptor with the Gardos channel.
Previous studies have indicated that the activation of ET-1 receptors mobilizes intracellular Ca++ stores in nonerythroid cells,35-38 but whether cytosolic Ca++ in red cells is affected by ET-1 is unknown. Other intracellular signaling mechanisms that mediate ET-1 actions include phospholipase C, diacylglycerol, and PKC.39 Human erythrocytes express only 2 isoforms of PKC, ζ and α.30 There is evidence for Gardos channel modulation by α-PKC in low oxygen conditions in human sickle cells.30 Therefore, it is possible that the effects of ET-1 on the Gardos channel might be mediated by PKC-α. This is in agreement with the effects of PKC inhibitors on Gardos channel activity (Figure 7), which modify the activity of the Gardos channel by altering the affinity for intracellular Ca++. We previously described that in mouse erythrocytes activation of the endothelin receptor enhances the activity of PKC,15 and we suggested that ET-1 induced activation of the Gardos channel by a PKC-dependent mechanism(s) as shown in other cell types.40,41 However, the Ca++-activated K+ channels (IK1) have also been shown to be modulated by a rise of cyclic adenosine monophosphate, PKA, and calmodulin, suggesting that channel activation can be mediated by different pathways.41
Sickle erythrocytes have been shown to interact with vascular endothelial cells, stimulating the release of ET-1 and regulating the expression of the ET-1 gene in culture endothelial cells.42 However, we do not know whether increased plasma levels of ET-1 can modulate the Gardos channel in vivo. Although the concentration of ET-1 necessary to stimulate the Gardos channel in vitro exceeds the levels documented in patient plasma during painful crises, it is likely that local levels of ET-1 are higher than those measured systemically. The activation of the Gardos channel by ET-1 in the absence of A23187 (Figure 3) could suggest the coupling of the Gardos channel to the ET-1 receptor in vivo. This is in agreement with ET-1 significantly changing the dehydration state of erythrocytes when the cells are exposed to oxygenation–deoxygenation cycles, as occurs in physiological conditions (Figure 7). The role of ET-1 in sickle cell dehydration is under further investigation in the transgenic sickle mouse model using ET-1 receptor antagonists.
Despite multiple attempts, we did not succeed in amplifying endothelin receptors from reticulocyte cDNA. This is surprising because we previously amplified, without difficulty, reticulocyte cDNA corresponding to major proteins of the membrane skeleton, including α and β spectrin, ankyrin, band 3, proteins 4.1 and 4.2, and glycophorin A.43-45 However, ET-1 receptor subtype B mRNA may be present in a concentration too low to allow amplification given that the number of ETB molecules in the red cell membrane is substantially lower (237-335 sites/cell) than the hundreds of thousands of molecules per erythrocyte of the membrane skeletal proteins. Alternatively, ET-1 receptors may be synthesized relatively early in erythroid development, and the corresponding mRNA may be degraded at the reticulocyte stage of differentiation.
Because some of these cytokines interact with their specific receptors, it is possible that the Gardos channel and these receptors are functionally coupled in human erythrocytes by intracellular enzymatic activation pathways. Therefore, these findings might offer potential new therapeutic approaches to vaso-occlusive events in sickle cell disease. In addition, modulation of the channel by distinct receptor signals might provide opportunities for in vivo modification by specific inhibitors.
We thank Dr Nica Cappellini (Ospedale Maggore Policlinico, Milan, Italy) for generously providing liquid erythroid culture samples, and we thank Derek Larkin and Marie Zachlederova for their outstanding technical support.
Supported by National Institutes of Health grants P604L15157, DK50422, and RO3DK54866.
Submitted January 22, 2001; accepted September 4, 2001.
The publication costs of this article were defrayed in part by page charge payment. Therefore, and solely to indicate this fact, this article is hereby marked “advertisement” in accordance with 18 U.S.C. section 1734.
References
Author notes
Alicia Rivera, Department of Laboratory Medicine, Bader 7, Children's Hospital Boston, 300 Longwood Ave, Boston, MA 02115; e-mail: rivera_a@a1.tch.harvard.edu.

![Fig. 4. ET-1 binding in normal and sickle erythrocytes. / Specific binding of [125I]–ET-1 as a function of radiolabeled ET-1 concentration. Scatchard plot of the specific binding of iodinated ET-1 gave a Kd of 244 ± 105 nM and 336 ± 78 sites/per cell for sickle red cells. TheKd for normal red cells was 128 ± 73 nM, with a maximal binding capacity of 238 ± 53 sites/cell. No statistically significance differences were found between sickle and normal erythrocytes. The line represents the nonlinear regression of experimental points. Values are mean ± SE of 3 similar experiments.](https://ash.silverchair-cdn.com/ash/content_public/journal/blood/99/1/10.1182_blood.v99.1.357/6/m_h80121967004.jpeg?Expires=1769294643&Signature=ogfEV9g2g9BvmHphJYJ0VC~NUP~hvXzRTTgtfzbvRZ5htncgc13q~Li93mk1Y7w1ZFQiBp4zUAxLLs31eNlII9sGgHdg96JonFIIvSUGv8KqFdBV2Pk8cu-yKPExoMhaPhUUUjeWNc1z7-HGQQL2sdC4pY5Ew-vtbEvIy7SwuNbPk6lr9o2VfxmpmkiVtzqUl1SFtPXnuXY-oSCVH3zxHI2hqSR6M3OtJTzWyLekvgIiU0w4bneEDner~-ql8PQDfxes4J4YqeItrHASLaoj9VA2PU-l6dKfy4cEtofqohIKNGYXVuLB65qxyQ02hAXpiwWjNoM6Nrudmo5wvFcgPQ__&Key-Pair-Id=APKAIE5G5CRDK6RD3PGA)
This feature is available to Subscribers Only
Sign In or Create an Account Close Modal