Key Points
Del(18p), together with del(17p)/TP53 mutations, is present at a high frequency before ibrutinib treatment.
BTK mutations drive ibrutinib relapse, but del(17p)/TP53 mutations may be dispensable.
Abstract
Ibrutinib has generated remarkable responses in patients with chronic lymphocytic leukemia (CLL), including those with an unfavorable cytogenetic profile. However, patients develop resistance, with poor outcomes and no established treatment options. Mutations in BTK and PLCG2 have emerged as main mechanisms of drug resistance, but not all patients carry these mutations. Further understanding of mechanisms of resistance is urgently needed and will support rational development of new therapeutic strategies. To that end, we characterized the genomic profiles of serial samples from 9 patients with ibrutinib-relapsed disease, including 6 who had Richter transformation. Mutations, indels, copy-number aberrations, and loss of heterozygosity were assessed using next-generation sequencing and single-nucleotide polymorphism array. We found that 18p deletion (del(18p)), together with del(17p)/TP53 mutations, was present in 5 of 9 patients before ibrutinib therapy. In addition to BTKC481, we identified BTKT316A, a structurally novel mutation located in the SH2 domain of BTK. Minor BTK clones with low allele frequencies were captured in addition to major BTK clones. Although TP53 loss predisposes patients for relapse, clone size of TP53 loss may diminish during disease progression while mutant BTK clone expands. In patients who had Richter transformation, we found that the transformed cells were clonal descendants of circulating leukemia cells but continued to undergo evolution and drifts. Surprisingly, transformed lymphoma cells in tissue may acquire a different BTK mutation from that in the CLL leukemia cells. Collectively, these results provide insights into clonal evolution underlying ibrutinib relapse and prompt further investigation on genomic abnormalities that have clinical application potential.
Introduction
Aberrantly increased B-cell receptor signaling activity is considered one of the most important driving pathologic mechanisms leading to chronic lymphocytic leukemia (CLL) development, progression, and relapse. B-cell receptor–targeted therapies including ibrutinib (a BTK inhibitor) have generated remarkable responses in treatment of mature B-cell malignancies, including CLL.1-5 Ibrutinib, in particular, was approved by the US Food and Drug Administration for treatment of CLL, mantle cell lymphoma, Waldenstrom macroglobulinemia, and, most recently, marginal zone lymphoma.
Despite remarkable antitumor activity of ibrutinib in CLL, 10% to 18% of patients develop disease progression, with a median follow-up ranging from 20 to 34 months.6-8 Of these patients, a third to half develop Richter transformation (RT). Without therapy, median overall survival for these patients is short, at 2.6 to 3.5 months, and mortality rate is high, exceeding 75%.6,7 Treatment options have yet to be established, but alternative targeted agents, such as idelalisib or venetoclax, have been used empirically as salvage treatment and are effective in some patients with CLL progression but not in patients who develop RT.8,9 As the use of ibrutinib becomes more widespread in CLL and other types of non-Hodgkin lymphoma, more patients are at risk of developing resistance.10 Strategies to prevent and treat ibrutinib relapse by understanding mechanisms of resistance are critically needed and will support rational development of new drugs, drug combinations, and other therapeutic approaches.
Ex vivo and in vivo studies including ours suggest that ibrutinib arrests cell-cycle progression and impairs cell adhesion but does not induce direct CLL cell death at clinically achievable concentrations.11-15 Cell death may eventually occur as a result of death by neglect over a period of time,8 but lack of immediate, direct, and effective killing provides a window of opportunity for tumor cells to mutate or for preexisting mutant clones to expand, eventually causing drug resistance. Recent studies including ours provide some insights into ibrutinib resistance. Both BTK and PLCG2 mutations have been shown to confer ibrutinib resistance.16,17 Additionally, loss of TRAIL-R resulting from 8p deletion (del(8p)) has also been associated with drug resistance in several patients with ibrutinib-relapsed disease.18 However, current understanding is limited, in the setting of disease progression during ibrutinib treatment, regarding which patients will experience relapse, whether additional molecular or cytogenetic lesions are responsible for disease progression, and how RT is related to CLL tumor cells in the blood. In this study, we attempt to address these questions by analyzing longitudinal samples from 9 patients using an integrated approach combining mutational and copy-number analyses.
Materials and methods
Patients
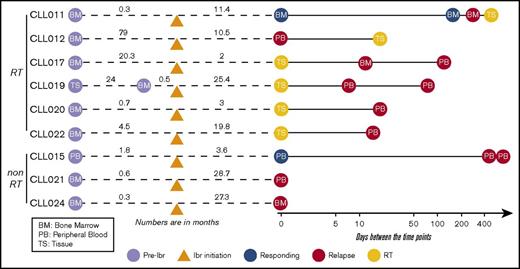
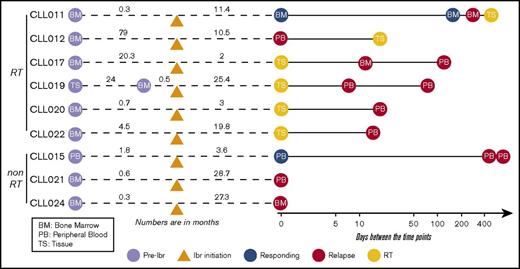
Nine patients with CLL who were treated with ibrutinib and whose disease relapsed were studied. Informed consents were obtained according to the Declaration of Helsinki, and the study was approved by the Institutional Review Board of University of Chicago. Patients were treated with ibrutinib because their disease was refractory to other treatment regimens. Those who had experienced progression while receiving ibrutinib therapy between February 2013 and December 2016 were included. Four of these 9 patients were treated in a clinical trial setting because of the presence of del(17p). Among the 9 patients, 3 had CLL progression and 6 developed RT at progression. The median age was 66.3 years (range, 52-88 years), and the median number of therapies before ibrutinib initiation was 2 (range, 1-4 therapies). Patients’ clinicopathological characteristics are shown in supplemental Table 1. Fluorescence in situ hybridization abnormalities before ibrutinib initiation demonstrated that 8 of 9 patients had del(17p). All 9 patients discontinued ibrutinib therapy because of CLL progression or RT. The median duration of response to ibrutinib in patients with RT was 14.9 months (range, 1.9-25.4 months), and in patients with simple CLL progression, it was 27.3 months (range, 19.8-28.7 months; supplemental Figure 1). A total of 31 longitudinal samples including peripheral blood (PB), bone marrow (BM), and tissue were collected from these patients at time points before ibrutinib initiation (preibrutinib) and postrelapse and at the time of RT (supplemental Table 2). When possible, samples were also collected during the responding phase. A brief summary of sample collection in relation to ibrutinib initiation is presented in Figure 1.
Partially scaled schematic diagram. The line diagrams summarize sample collection for each of the 9 patients (6 with RT and 3 without RT), with reference to ibrutinib (ibr) initiation (orange triangle). The samples to the left of ibr initiation represent the preibrutinib (pre-ibr) time points. The solid line to the right is log scaled. Types of sample are noted. Supplemental Table 2 provides more details about the samples.
Partially scaled schematic diagram. The line diagrams summarize sample collection for each of the 9 patients (6 with RT and 3 without RT), with reference to ibrutinib (ibr) initiation (orange triangle). The samples to the left of ibr initiation represent the preibrutinib (pre-ibr) time points. The solid line to the right is log scaled. Types of sample are noted. Supplemental Table 2 provides more details about the samples.
UCM-OncoPlus next-generation sequencing analysis
Single-nucleotide variations (SNVs) and indels up to 100 bp were detected using UCM-OncoPlus,19 a hybrid-capture 1212 cancer-associated next-generation sequencing gene panel (with >150 lymphoma-related genes). DNA was prepared from formalin-fixed, paraffin-embedded (FFPE) tissue using the QIAamp DNA FFPE Tissue Kit or from PB/BM using the QIAamp DNA Blood Mini Kit (Qiagen, Valencia, CA) according to the manufacturer’s instructions. After DNA quantification, library preparation and capture were performed for the UCM-OncoPlus panel.19 All libraries were sequenced on Illumina HiSeq instruments with rapid-run version 2 reagents, using 2 × 101 bp sequencing with a single 7-bp index read (Illumina, San Diego, CA). Paired-end FASTQ sequences for all 64 samples have been deposited in the National Center for Biotechnology Short Read Archive under BioProject PRJNA381632.
Copy-number analysis and data processing
Whole-genome single-nucleotide polymorphism arrays were performed to assess genome-wide copy-number aberrations (CNAs) and copy-neutral regions of loss of heterozygosity. Purified DNA was analyzed using the OncoScan (FFPE) and CytoScan HD (PB and BM) Affymetrix microarray platform following the manufacturer’s instructions (Affymetrix Inc., Santa Clara, CA). The copy-number and genotype data for all cases were analyzed using the GeneChip workstation with Affymetrix Molecular Diagnostics software. CYCHP and OSCHP files were analyzed using the Chromosome Analysis Suite (version 3.0) software. Genome build hg19 (February 2009) was used for probe locations and data interpretation. Data filter settings were ≥400 kb per 50 markers for copy-number gains and ≥200 kb per 50 markers for losses. Segmented calls were combined manually. Germline changes were generally filtered out by size or excluded by presence in public databases of benign germline variants (Database of Genomic Variants). The CNA data presented in this article have been deposited in the National Center for Biotechnology Gene Expression Omnibus20 and are accessible through Gene Expression Omnibus series accession number GSE97436.
Computational analyses of variant data
UCM-OncoPlus data were processed using a custom in-house pipeline (supplemental Figure 2), starting with adapter trimming using Trimmomatic 0.30,21 followed by alignment to the hg19 version of the human genome with BWA-MEM v0.7.1222 and retention of unique high-quality alignments. The remaining alignments were indel realigned using Abra,23 and polymerase chain reaction duplicates were removed using picard tools. Variant calling was performed using a combination of Samtools 0.1.1924 and UCM-developed software, Variant Inspector. Only variants with an allele frequency >10% and depth >50× with Phred quality scores >Q30 were called for all major clone analyses. These variants were annotated using Alamut Batch 1.3 software (http://www.interactive-biosoftware.com/) and further filtered based on their 1000-G frequency, coding effect (synonymous variants were removed), location (only exonic variants were considered for this analysis), and removal of sequence artifacts. Detection of minor clones was performed by investigating the UCM-OncoPlus data for BTK manually in Integrative Genomics Viewer25,26 and then confirmed using an amplicon-based 17-gene CLL panel, developed at the University of Chicago.27 This panel was used to sequence BTK at greater depth (∼10 000×) to confirm the presence of minor clones (1%-5%).
A custom algorithm was developed to calculate cancer-cell fractions (CCFs) using an integrative approach combining allelic frequencies, tumor purity, and CNA data. K-means clustering was performed to identify gene mutations belonging to the same clonal populations.
Statistical analyses
Results
Recurrent abnormalities before ibrutinib initiation: high frequency of del(18p)
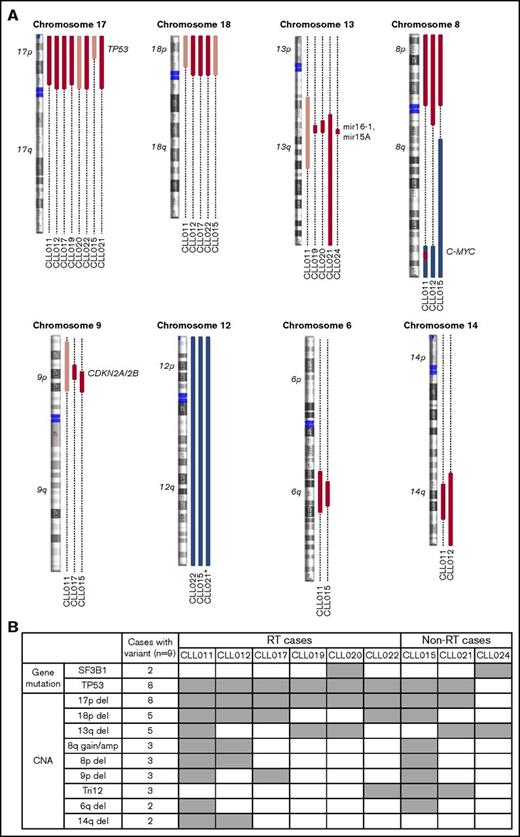
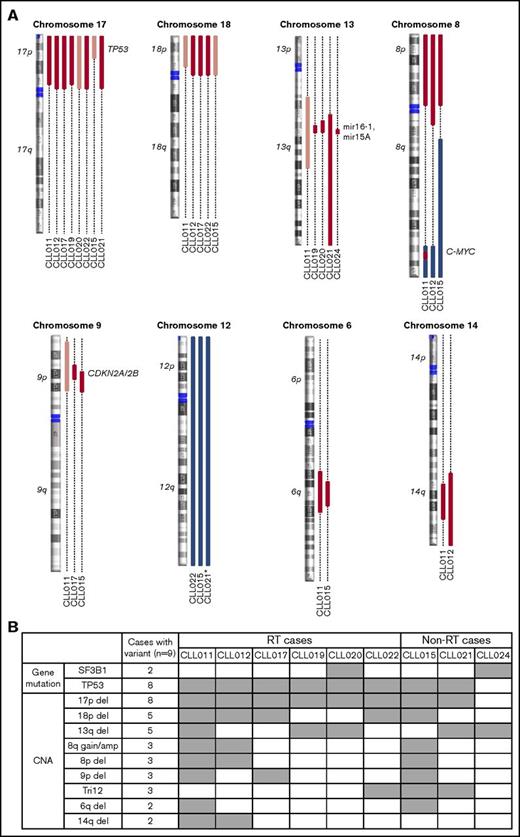
Previous studies have suggested that several genetic factors increase the risk of disease progression for patients treated with ibrutinib. These include BCL6 rearrangements, MYC abnormalities, del(17p), and a complex karyotype.6,29 To determine whether additional abnormalities exist that are associated with ibrutinib relapse, we searched for genetic lesions present in 9 patients before ibrutinib treatment. We determined SNVs and indel variations plus CNAs using UCM-OncoPlus and CytoScan/Oncoscan assays, and data were analyzed using stringent computational filters (as described in “Materials and methods”). An average of 23 SNVs/indels and 7 CNAs were found per specimen, with a range of 15 to 27 and 4 to 11, respectively. With regard to recurrent abnormalities, we identified a total of 2 mutations and 9 CNAs that were present in ≥2 patients in our cohort. The details of common gain or loss are depicted in Figure 2A, and all recurrent lesions are summarized in Figure 2B.
Recurrent abnormalities detected in patients before ibrutinib initiation. (A) Recurring CNAs. Short and long arms of chromosomes are labeled, and centromeres are highlighted. Red bars represent single-copy loss, light red bars represent mosaic loss (SmoothSignal log2 ≥ 1.5), dark red bars represent homozygous loss, and blue bars represent gains. (B) Heatmap summarizing recurrent abnormalities in all 9 patients. Gray box indicates positive finding. *CLL021 shows complex structural abnormalities of chromosome 12 with concomitant whole-chromosome gain. Amp, amplification.
Recurrent abnormalities detected in patients before ibrutinib initiation. (A) Recurring CNAs. Short and long arms of chromosomes are labeled, and centromeres are highlighted. Red bars represent single-copy loss, light red bars represent mosaic loss (SmoothSignal log2 ≥ 1.5), dark red bars represent homozygous loss, and blue bars represent gains. (B) Heatmap summarizing recurrent abnormalities in all 9 patients. Gray box indicates positive finding. *CLL021 shows complex structural abnormalities of chromosome 12 with concomitant whole-chromosome gain. Amp, amplification.
We then compared the frequencies of our positive identifications with those of 9 larger studies, including 5 cohorts of treatment-naïve or treatment-unknown patients, 3 populations of patients with treated/relapsed disease, and 28 CLL phase samples from patients with RT.30-34
Although del(13q) (resulting in haploinsufficiency of DLEU1, miR15a, and miR16), trisomy 12, and SF3B1 mutations were present at an overall similar frequency across most of the cohorts, del(17p) occurred at an unusually high frequency (Table 1; significant P values compare our frequencies with those of other cohorts). In our cohort, 8 of 9 patients (89%) had del(17p) vs 3% to 8% in untreated populations, 10% to 24% in populations with treated/relapsed disease, and 32% in the CLL phase of patients who had developed RT. TP53 mutations occurred with the same frequency, in 8 (89%) of 9 patients in our cohort compared with 4% to 11% in untreated populations and 13% to 29% in populations with treated/relapsed disease. Biallelic TP53 disruption was seen at the same frequencies and in all 8 patients (Figure 2B). These findings suggest that TP53 abnormality is associated with ibrutinib relapse that is largely consistent with previous reports6,29 (as described in “Discussion”).
In addition to loss of 17p/TP53, we identified several other chromosomal alterations within our cohort that appeared at higher frequencies in 3 of 9 patients in comparison with other studies (Table 1). These included gain/amplification of MYC on 8q (MYC abnormalities were reported to predict an increased risk for disease progression in the setting of ibrutinib treatment6 ), loss of the short arm of chromosome 8 (including TRAIL-R locus; del(8p) was found previously in 3 of 5 patients with ibrutinib-relapsed CLL18 ), and loss of the short arm of chromosome 9, resulting in haploinsufficiency of known tumor suppressor genes CDKN2A/2B. Both single-copy and homozygous deletions of CDKN2A/2B were noted in 3 of 9 patients (Figure 2A shows detail of CNA). To date, del(9p21) has only been associated with RT but never with CLL, regardless of treatment history35,36 (Table 1). In the 2 patients with single-copy loss of 9p21 (CLL011 and CLL017), no mutations were identified in the remaining presumed normal copy of CDKN2A/2B. Furthermore, no copy-neutral loss of heterozygosity was identified at this locus in the cohort. Lastly, del(6q21) (PRDM1 locus) and del(14q) (GOLG5A, TRIPP11, and TSHR loci) occurred in 2 of 9 patients. Notably, gain of 8q and loss of 9p, 8p, 6q, and 14q chromosomal segments all occurred in patient cases with concurrent del(17p) (Figure 2B).
Of particular interest, we found that del(18p) (Figure 2A, largely whole arm) was present at a particularly high frequency in 56% (5 of 9 patients) of our cohort. Del(18p) is a rare finding in patients with CLL. Large studies of patients have identified the presence of this abnormality in 2% to 4% of untreated and 3% to 7% of treated patient populations (Table 1). Even in the CLL phase of patients whose disease later transformed, del(18p) was seen at 11% (3 of 28 patients; Table 1). Interestingly, the 18p loss found in 5 patients in our cohort invariably coexisted with 17p loss. A search for a potential candidate gene within 18p yielded no mutations of interest on the remaining homolog.
The cooccurrence of these chromosomal abnormalities with del(17p)/TP53 mutations may happen by chance and may be parts of a complex karyotype that is often associated with TP53 aberrations. However, it is also possible that a subset of these aberrations, 18p, for example, cooperates with TP53, conferring refractoriness to prior therapies and risk of relapse during ibrutinib treatment later in a patient’s disease course (see “Discussion”).
Recurrent abnormalities at relapse versus pretreatment
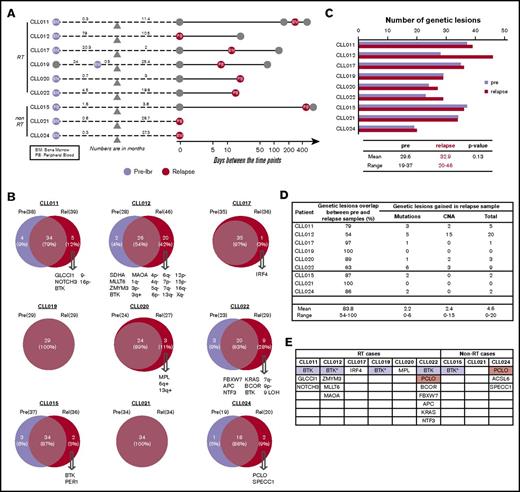
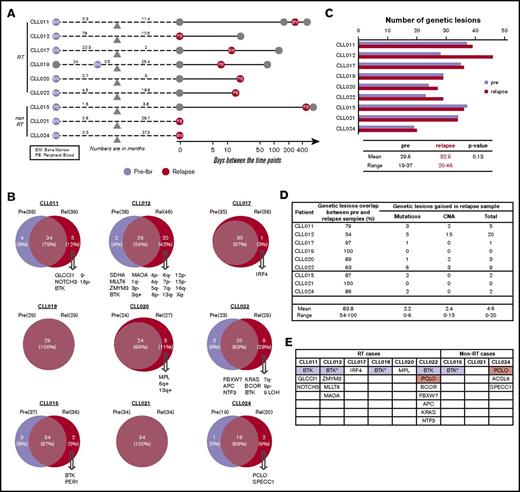
Although BTK and PLCG2 mutations are the predominant mechanisms responsible for ibrutinib resistance,16,17,37 patient cases lacking these mutations have been reported.18 To identify alternative resistance mechanisms that might drive disease progression, we compared genetic abnormalities of the CLL relapse PB/BM samples with paired preibrutinib PB/BM samples in each of the 9 patients (shown in Figure 3A-B). For this analysis, RT tissues were not included (details in Clonal Evolution in CLL-RT Transition). An average of 30 mutations was present before ibrutinib initiation, with a range of 19 to 37 mutations. Meanwhile, an average of 33 mutations was present at relapse, with a range of 20 to 46 mutations (Figure 3C). Thus, there seemed to be no significant increase in mutation burden from pretreatment to relapse (P = .13; Figure 3C). Numbers of mutations and CNAs in preibrutinib vs relapse time points are listed for each patient in supplemental Table 3.
Recurrent abnormalities at relapse vs pretreatment. (A) Schematic representation of the paired samples used for this analysis: lavender for preibrutinib (pre-ibr) and red for relapse sample. (B) Venn diagrams comparing the genetic lesions in the paired pre-ibr and relapse (Rel) samples of each patient. (C) Bar graph summarizing the total number of genetic lesions identified in the pre-ibr and relapse samples. (D) Table summarizing the number of genetic lesions gained in the relapse samples. The line separates patients with RT from those without RT. (E) List of relapse-specific genes for each patient. Colored boxes indicate recurrent genes. *BTK found at low allele frequency (Table 2 also lists emerging minor clones). LOH, loss of heterozygosity.
Recurrent abnormalities at relapse vs pretreatment. (A) Schematic representation of the paired samples used for this analysis: lavender for preibrutinib (pre-ibr) and red for relapse sample. (B) Venn diagrams comparing the genetic lesions in the paired pre-ibr and relapse (Rel) samples of each patient. (C) Bar graph summarizing the total number of genetic lesions identified in the pre-ibr and relapse samples. (D) Table summarizing the number of genetic lesions gained in the relapse samples. The line separates patients with RT from those without RT. (E) List of relapse-specific genes for each patient. Colored boxes indicate recurrent genes. *BTK found at low allele frequency (Table 2 also lists emerging minor clones). LOH, loss of heterozygosity.
As shown individually in Figure 3B and summarized in Figure 3D, in every patient case, there was an overlap of mutations/CNAs between preibrutinib and relapse ranging from 54% to 100%, with a mean of 84%. At relapse, tumor cells gained an average of 4.8 new genetic abnormalities, with a range of 0 to 20 abnormalities (Figure 3D), suggesting clonal drifts. Among 9 patients, 5 had easily detectable overt BTK mutations that were relapse specific (Figure 3E). These included BTKC481S in CLL011 and CLL015 and BTKC481Y in CLL019 and CLL022. Notably, a structurally novel mutation, BTKT316A, was detected in CLL012. This mutation is located in the SH2 domain of BTK as opposed to the kinase domain. The SH2 mutation, although not directly interfering with ibrutinib binding, functionally confers ibrutinib resistance comparable to the well-characterized BTKC481S mutation.27
Interestingly, 4 of 5 patients had relapse-specific BTK mutations that were present in the PB (CLL011, CLL012, CLL022, and CLL015), with 1 exception. At relapse, CLL019 did not develop a significant BTK mutation in the blood (details in “Emergence of minor BTK clones”), but a liver biopsy involved by large-cell transformation gained a BTKC481Y mutation. This finding suggests that the leukemia progression in blood may be separate from the RT at the tissue site (see “Clonal evolution in CLL-RT transition”). Overall, these findings reinforce the notion that BTK mutation is the most predominant mutation mechanism for ibrutinib relapse in CLL.
Aside from BTK, we found additional relapse-specific mutations that were mostly unique to individual patients (Figure 3E). The only other mutated gene, recurrently detected in 2 patients, was PCLO: M4405I in CLL022 and A3066E in CLL024. PCLO mutations have been previously reported in both CLL and diffuse large B-cell lymphoma,18,38 but the particular variants reported here have never been documented. A prediction of the variant impact on function of the protein by the SIFT algorithm suggests that M4405I is neutral/tolerated but A3066E is deleterious/damaging. Although PCLO encodes a cytoskeletal matrix protein, the functional roles of PCLO mutations in cancer are not yet known. Given its low frequency in our cohort (2 of 9 patients) and coexistence of the variant PCLOM4405I with BTKC481Y in CLL022, it remains unclear whether this gene plays any independent role in driving ibrutinib relapse.
Four of 9 patients had relapse-specific CNAs (CLL011, CLL012, CLL020, and CLL022; Figure 3B), but none of these were recurrent in ≥ 2 patients. In CLL011, there was a whole chromosome 9 loss at ibrutinib relapse, whereas a 9p21 (CDKN2A/2B) loss was found before ibrutinib treatment.
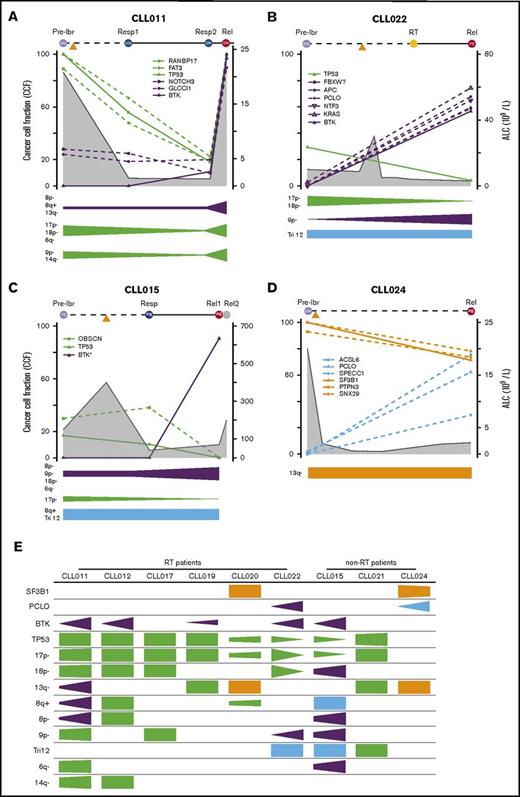
Unexpectedly, in 2 patients (CLL015 and CLL022; Figures 2B and 3B), the pretreatment del(17p) and TP53 mutation were lost at relapse, whereas both patients acquired the BTKC481 mutation. These findings imply that ibrutinib is sufficiently potent to eliminate the initial del(17p)/TP53 clones, at least in a few cases; that it is not just cells with TP53 lesions that become resistant to ibrutinib (ie, although TP53 increases the risk of ibrutinib relapse, it may not be required to drive the growth and expansion of the BTK-bearing/ibrutinib-resistant clones; some other lesions may be present to allow the emergence of BTK mutations); and that BTK, with expansion through the disease course, plays a definitive and active role in driving drug resistance and disease relapse.
Emergence of minor BTK clones
In addition to the major BTK clones, minute BTKC481S/R clones with distinct nucleotide changes were detected in CLL012, CLL015, and CLL019 in the PB at a low frequency of 1% to 5% (Table 2). To confirm these findings, these samples were also sequenced using an amplicon-based, custom-designed 17-gene CLL panel that interrogates the BTK gene at a greater depth, producing 7000 to 14 000 high-quality reads. The presence of these minor clones was verified, with mutant allele frequencies ranging from 1.6% to 6.7%, with >100 counts of mutant reads in each specimen (supplemental Table 4). These analyses captured a snapshot of multiple drug-resistant tumor clones of different sizes evolving in single patients, suggesting 2 possibilities: either multiple tumor cells, at the individual-clone level, acquired new mutations to adapt to the drug pressure or there was outgrowth of multiple preexisting minute clones selected by their capability to resist the drug blockade.31,39
Clonal evolution in CLL-RT transition
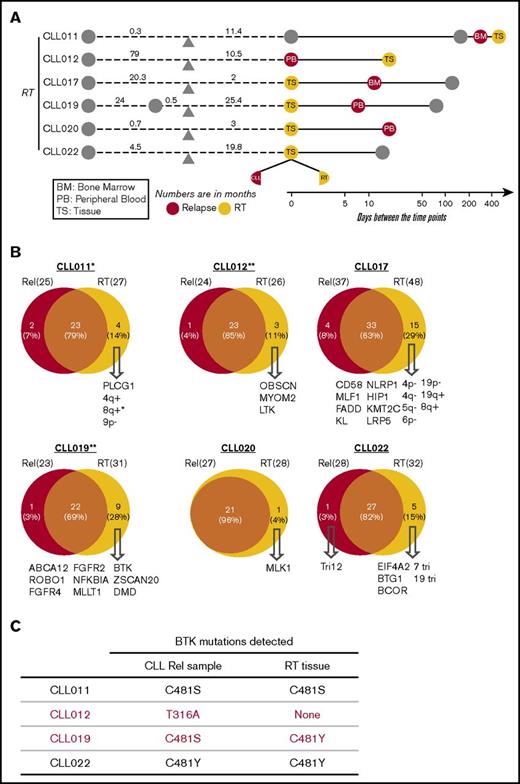
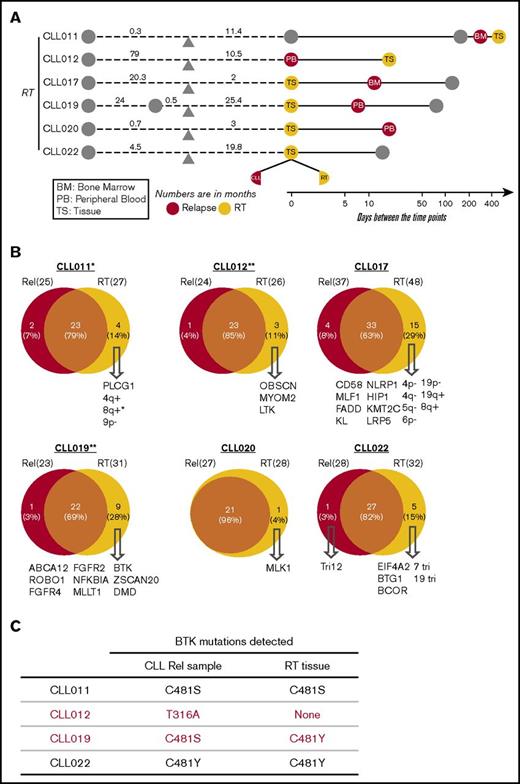
Among 9 patients, 6 developed RT after ibrutinib initiation, and all 6 patients with RT had CLL in blood and/or BM at the time of RT diagnosis (Figure 4A). To determine how RT is related to circulating CLL in the setting of ibrutinib relapse, we compared the RT tissues with their CLL counterparts that were collected within 2.5 months of RT diagnosis. The CLL counterparts consisted of 3 PB specimens (CLL012, CLL019, and CLL020), 2 BM specimens (CLL011 and CLL017), and 1 lymph node involved by small CLL cells (CLL022). We first assessed whether the pairs belonged to the same B-cell clone by IGH gene rearrangement analysis. In the 4 patient cases (CLL012, CLL017, CLL020, and CLL022) where there were sufficient DNA materials, the same clonal peaks were identified in both RT and CLL, indicating the cells at both anatomical sites were of the same B-cell origin. Thus, RT cells, in most cases here, were derived from CLL cells.
Clonal evolution in CLL-RT transition. (A) Schematic representation of the paired samples used for this analysis: orange for RT and red for liquid sample. (B) Venn diagrams comparing the genetic lesions in the paired RT and relapse samples of each patient. Numbers indicates counts of mutations. (C) Comparison of BTK mutations present in CLL vs RT tissue. *CLL011 showed gains of MYC in liquid relapse sample (Rel), but the copy number was further increased in the RT tissue. **No CNA data were available from the RT samples of patients CLL012 and CLL019. Tri, trisomy.
Clonal evolution in CLL-RT transition. (A) Schematic representation of the paired samples used for this analysis: orange for RT and red for liquid sample. (B) Venn diagrams comparing the genetic lesions in the paired RT and relapse samples of each patient. Numbers indicates counts of mutations. (C) Comparison of BTK mutations present in CLL vs RT tissue. *CLL011 showed gains of MYC in liquid relapse sample (Rel), but the copy number was further increased in the RT tissue. **No CNA data were available from the RT samples of patients CLL012 and CLL019. Tri, trisomy.
We then compared the genomic profiles of the paired samples (Figure 4B). CNA data in RT tissues were obtained for only 4 patients because of the limited amount of materials (CLL011, CLL017, CLL020, and CLL022; Figure 4B). Overall, there was 63% to 96% overlap in genetic abnormalities between RT and leukemia. An additional 1 to 15 RT-specific mutations were identified in all 6 patient cases. 8q gain seemed to be the only 1 RT-specific abnormality that was recurrent in 2 patients (Figure 4B). In CLL011, although 8q gain was present in preibrutinib sample, the copy number further increased in the RT tissue, from 3 to 10 copies. In CLL017, 8q gain was not detected in the preibrutinib sample and was newly acquired in the RT. MYC abnormality has been reported as one of the most common genetic lesions in RT.40
Among patients with RT who carried BTK mutations in the corresponding CLL cells (CLL011, CLL012, CLL019, and CLL022), the paired RT tissues also carried the same BTK mutations in CLL011 and CLL022 (Figure 4C). In CLL012, the RT tissue did not contain the BTKT316A mutation found in the blood. Interestingly, in CLL019, large transformed cells of the liver bore a major clone of BTKC481Y, whereas a minor clone of different nature, BTKC481S, was identified in the PB that contained only CLL cells. Given the closeness in time of collection (8 days apart), this result suggests that RT lymphoma cells may acquire driver mutations independent of CLL leukemia cells.
Notably, some genetic lesions present in the CLL phase were lost at the site of large-cell transformation, such as trisomy 12 in CLL022 and 4 mutations in CLL017. This phenomenon was seen in 5 of the 6 analyzed patient cases (except CLL020; Figure 4B). In CLL022 particularly, the comparison between relapsed CLL and RT was conducted using a single lymph node comprised of a clearly demarcated CLL component and transformed large-cell component. The 2 components were macrodissected and analyzed separately; 82% of the mutation profiles overlapped, and trisomy 12 in the CLL component was lost in RT, but RT cells gained 5 additional lesions (Figure 4B). Taken together, these observations suggest that not all CLL clones/subclones will transform; some of them may be outcompeted by clones of higher fitness during the transition from CLL to RT. In combination with the B-cell clonality data, we conclude, in our small series, that RT is clonally descended from CLL leukemia but continues to undergo clonal evolution and drifts at the tissue site, including acquisition of new BTK mutations.
Evolutionary dynamics of the major clones during ibrutinib relapse
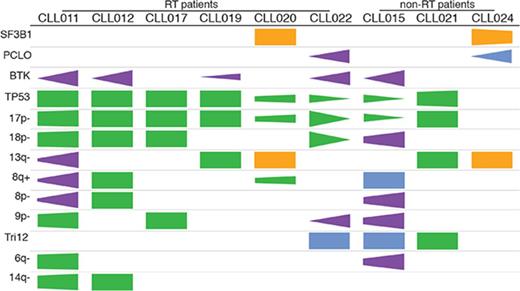
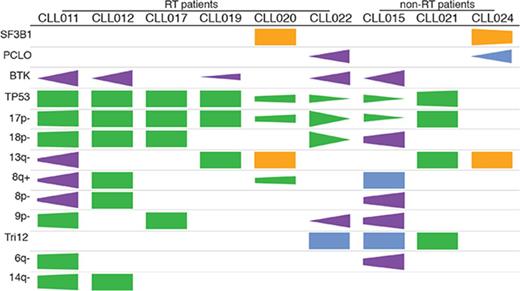
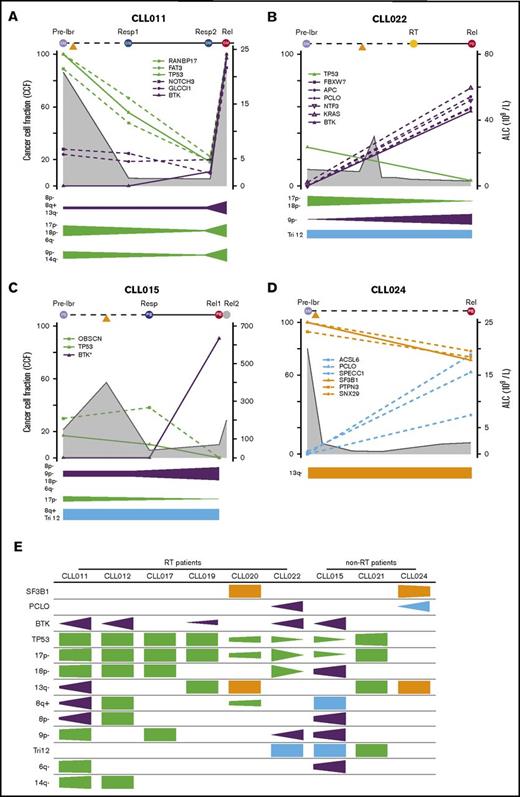
To understand the dynamic changes of mutant clones in relation to patient disease activity and ibrutinib treatment, we analyzed changes in CCFs of TP53, BTK, SF3B1, and PCLO as well as the genetic lesions that travel with them over the course of relapse. For this analysis, we only included specimens from the liquid compartments (ie, blood and BM), because tumor cellularity on tissue sections cannot be precisely assessed. The mutation and CNA information is plotted in relation to sample collection time points and absolute lymphocyte count (ALC) for individual patients in Figure 5A-D (additional details shown in supplemental Figure 2) and is summarized in Figure 5E. Tumor cellularity and, to a lesser extent, copy-number changes are corrected when the CCF was derived. CNAs are organized by clonal trends and depicted in a semiquantitative manner (Figure 5A-D). We noted several interesting findings in these correlative analyses. First, mutations of BTK occurred simultaneously with double abnormalities of del(17p)/TP53 in all 5 patient cases (Figure 5E). From the perspective of BTK, this association was 100%. Again, these findings suggest that TP53 inactivation may provide a permissive environment for the generation or outgrowth of the BTK mutant clones. Second, from pretreatment to disease relapse, del(17p)/TP53 clones may expand, remain at a similar level, or even contract, whereas BTK clones always expand (Figure 5A-D; supplemental Figure 3). In CLL015 and CLL022, the BTK and TP53 clones trended in opposite directions, suggesting that they may not reside in the same clone of malignant cells. Although the TP53 clone was dying in response to ibrutinib, the mutant BTK clone survived and thrived (Figure 5B-C). Third, the number and nature of mutant genes traveling with BTK or TP53 clones were heterogeneous, varying from patient to patient. This result suggests that these mutations are passengers rather than drivers of either aggressive disease upfront or disease progression after ibrutinib initiation (Figure 5A-D; supplemental Figure 3). Finally, PCLO clone expansion may occur in the absence of BTK mutations, as in the case of CLL024 (Figure 5D). Thus, it remains possible the mutation may drive CLL progression alone or in collaboration with other unidentified genes or noncoding sequences.
Evolutionary dynamics of the major clones during ibrutinib (ibr) relapse. Clonal trends in selected patients with CLL (supplemental Figure 2 provides details for additional patients). (A-D) Detailed trends for 2 patients with RT (A-B) and 2 without RT (C-D). Samples being analyzed are shown at the top of the plots. Time on the x-axis is partially scaled, consistent with Figure 1. Clonal frequencies are shown on the left y-axis, and absolute lymphocyte count (ALC) values are shown on the right y-axis (gray shaded curves). Mutations that clustered in the same trends are shown in the same colors (green, TP53 clusters; purple, BTK clusters; orange, SF3B1 clusters; and Blue, other clusters). The clonal trends of the copy-number changes are shown below each plot using the same color scheme. (E) Semiquantitative heatmap summarizing clonal trends for all 9 patients; x-axis for each box shows lapse of time. *Minor clones present but not depicted. Rel, relapse; Resp, response.
Evolutionary dynamics of the major clones during ibrutinib (ibr) relapse. Clonal trends in selected patients with CLL (supplemental Figure 2 provides details for additional patients). (A-D) Detailed trends for 2 patients with RT (A-B) and 2 without RT (C-D). Samples being analyzed are shown at the top of the plots. Time on the x-axis is partially scaled, consistent with Figure 1. Clonal frequencies are shown on the left y-axis, and absolute lymphocyte count (ALC) values are shown on the right y-axis (gray shaded curves). Mutations that clustered in the same trends are shown in the same colors (green, TP53 clusters; purple, BTK clusters; orange, SF3B1 clusters; and Blue, other clusters). The clonal trends of the copy-number changes are shown below each plot using the same color scheme. (E) Semiquantitative heatmap summarizing clonal trends for all 9 patients; x-axis for each box shows lapse of time. *Minor clones present but not depicted. Rel, relapse; Resp, response.
Discussion
From the current investigation, using serial samples collected from 9 patients whose disease progressed during ibrutinib therapy, we have made several findings that may be mechanistically and clinically relevant regarding risk of ibrutinib relapse, drivers of ibrutinib relapse, and RT.
Our data show that del(17p)/TP53 mutations were enriched in our patient cohort. Eight (89%) of 9 patients had del(17p)/TP53 before ibrutinib treatment. Of these 9 patients, 4 were treated with ibrutinib in a clinical trial setting because of the presence of del(17p). Thus, there might be a selection bias for our claimed association of del(17p) with ibrutinib relapse. However, similar to our finding, Byrd et al1 also found that del(17p) is associated with poorer progression-free survival and an increased risk of ibrutinib relapse.6 TP53 was not sequenced in those prior studies; thus, whether TP53 loss was biallelic cannot be assessed. In our study, del(17p) and TP53 mutations occurred in the same 8 patients, indicating many of their tumor cells lacked any functional TP53.
Disease relapse was also associated with upfront MYC gain/amplifications, loss of CDKN2A/2B, and loss of TRAIL-R, as reported previously.6,18 Of particular interest, we found that deletion of the short arm of chromosome 18 occurred at a higher frequency in our small ibrutinib-relapsed cohort than previously reported CLL populations, treated or untreated. Meanwhile, the frequencies of trisomy 12 and del(13q) were comparable to those in published populations (Table 1). Given the low frequency of del(18p) in CLL, it is not included in the routine fluorescence in situ hybridization panel for CLL diagnostic workup. Thus, its apparent high frequency in our cohort could not have resulted from a selection bias. Our cohort included only 9 patients. It is likely that the cooccurrence of del(18p) with TP53 disruptions happened by chance and was just part of a complex karyotype often associated with TP53 aberrations. However, a recent large study of 69 patients with del(17p) and CLL identified 3p, 4p, 8p, and 9p as recurrent events significantly associated with del(17p) but not del(18p).41 Thus, the possibility remains that del(18p) does not happen by chance in the setting of ibrutinib treatment, and it may cooperate with TP53 in conferring refractoriness to prior therapies and in increasing risk of relapse during ibrutinib treatment. In a way, what we observed here could be similar to the association between del(17p)/TP53 mutations, complex cytogenetics, and enriched 5q/7q loss in the setting of acute myeloid leukemia and myelodysplastic syndrome.42 Larger studies are certainly warranted before loss of 18p is used as a marker to predict risk of ibrutinib relapse.
From pretreatment to relapse, we found no significant increase in mutational load in our cohort. This result is not surprising; given that ibrutinib therapy specifically targets the molecule of BTK, it is not expected that the drug would be genotoxic like chemotherapeutic agents such as fludarabine, which induces new mutations genome wide.31
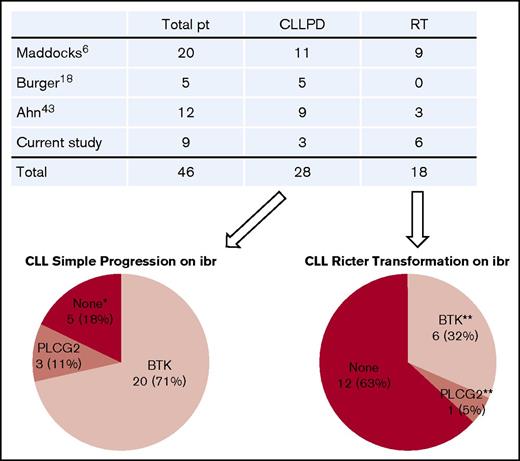
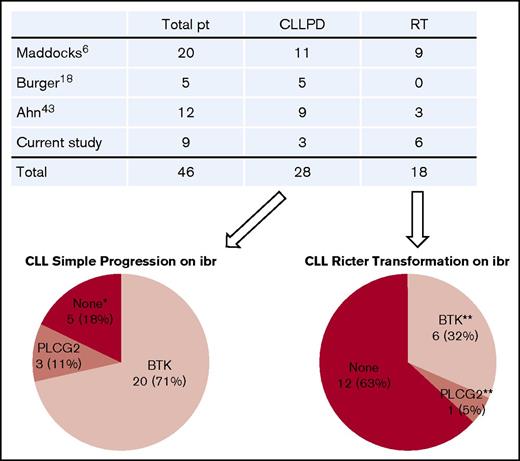
We found that BTK mutations were strictly associated with relapse and that the resistant BTK clone expanded through the course of disease progression. With the detection limit of the current technology, BTK mutations have not yet been detected in patients who have not received ibrutinib.30-34 An up-to-date literature review revealed that a total of 46 patients with ibrutinib-relapsed disease have been studied, including those in our cohort.6,16,18,43 Of these, 28 patients had simple CLL progression, and 18 patients developed RT (Figure 6). Of 28 patients with CLL progression, 20 (71%) had BTK mutations, 3 (11%) had PLCG2 mutations, and the remaining 5 had no mutations in either gene. Thus, BTK mutations remain the predominant mechanism underlying ibrutinib resistance.
Summary of gene mutations in patients (pt) with ibrutinib (ibr)-relapsed disease. Four studies published to date were summarized. Number of patients in each category is indicated. *Neither BTK nor PLCG2 mutation. **One patient with RT had both BTK and PLCG2 mutations. PD, progressive disease.
Summary of gene mutations in patients (pt) with ibrutinib (ibr)-relapsed disease. Four studies published to date were summarized. Number of patients in each category is indicated. *Neither BTK nor PLCG2 mutation. **One patient with RT had both BTK and PLCG2 mutations. PD, progressive disease.
It has yet to be determined, however, whether del(8p) that involves TRAIL-R18 or mutations in the PLCO gene play any role in driving ibrutinib resistance, because they are present in only a minority of patient cases. It remains possible that other genes yet to be identified are involved in ibrutinib relapse; our cohort was small, and the sequencing approach we took only targeted 1212 known cancer genes.
Although TP53 may facilitate the generation and/or expansion of the BTK clone, TP53 loss may not be required later for disease relapse during ibrutinib treatment. Size of both del(17p) and TP53 mutation may diminish at the time of relapse, as illustrated in patients CLL015 and CLL022. Thus, TP53 loss is not necessarily a driver of disease progression, but mutant BTK is.
Minor BTK clones with <5% mutant allele frequencies were captured by our analyses and confirmed by deep sequencing. These minor clones were identified in addition to the major clones (Table 2). At such low frequencies, the minor clones, by themselves, are unlikely to account for patient clinical relapse. However, their existence suggests that they have emerged through evolution and will perhaps continue to grow and expand under the pressure of ibrutinib therapy.
In the setting of ibrutinib relapse, the current investigation represents the first study that compares RT tissues with CLL leukemia. Eight patients with RT were included in the study by Maddocks et al.6 However, blood samples were used to study 7 of these 8 patients, and lymph node biopsy was obtained from only 1 patient. Ahn et al8 included 3 patients with RT in their study, but sequencing was performed on PB or BM, not on tissue biopsies. Thus, BTK and/or PLCG2 mutations have not been well documented in RT tissues.
Using tissue biopsies, our data demonstrate that transformed tumor cells at the tissue sites are clonal descendants of the tumor cells in the blood, but they continue to evolve. They may gain BTK mutations independently from the blood tumor cells, as best illustrated by CLL019, who had a major clone of BTKC481Y at the tissue site but a minor clone of different nature, BTKC481S, in blood.
By comparing RT transformation with leukemia relapse, we also noted that some lesions present in the circulating tumors were absent in the transformed tumor cells. This finding suggests that not all clones transform, and some clones may be outcompeted by clones of higher fitness.
In a review of the literature, it was reported that transformed cells acquire genetic lesions that are heterogeneous in number and spectrum,36 similar to what we found in the current study. In this sense, evolution from CLL to RT in the setting of ibrutinib relapse is not very different from RT in the general setting, unrelated to ibrutinib treatment.35,36
In conclusion, although our results provide some interesting insight into clonal evolution underlying ibrutinib relapse, it represents an early and small series. The findings remain descriptive, and investigation of larger numbers of patients will have to be conducted to validate these observations.
The full-text version of this article contains a data supplement.
Authorship
Contribution: N.G., M.S., G.V., H.W., M. Thirman, W.S., S.M.S., and C.N. consented patients, collected patient samples, and provided patients' clinical history; C.F., S.S., B.L., K.P., M. Theissen, M.M., Y.K., A.G., P.L., and J.P.S. developed assays, performed experiments, and solved technical problems; S.K., J.L., C.F., W.K., W.W., N.N., and Y.L.W. organized, analyzed, and graphed the data; S.K. performed computational analyses; S.K., J.L., C.F., and Y.L.W. wrote the manuscript with contributions from N.G. and H.W.; and Y.L.W. designed, directed, and coordinated the study.
Conflict-of-interest disclosure: The authors declare no competing financial interests.
Correspondence: Y. Lynn Wang, Department of Pathology, University of Chicago, 5841 S. Maryland Ave, Room N316, MC 1089, Chicago, IL 60637; e-mail: ylwang@bsd.uchicago.edu.
References
Author notes
S.K., J.L., and C.F. contributed equally to this study.
The data reported in this article have been deposited in the Gene Expression Omnibus database (accession number GSE97436).

