Key Points
G6PC3 deficiency results in neutrophil chemotactic and killing defects due to impaired actin assembly, CD11b expression, and O2− production.
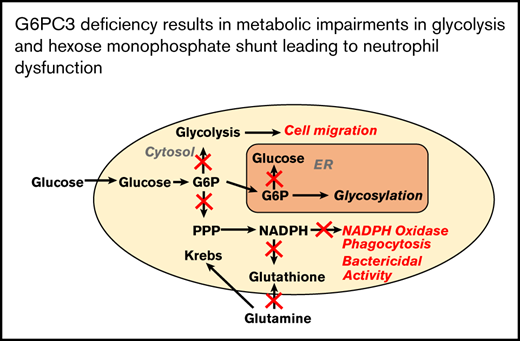
Metabolomic flux experiments demonstrate derangements in glycolysis, hexose monophosphate shunt, glutaminolysis, and redox pathways.
Abstract
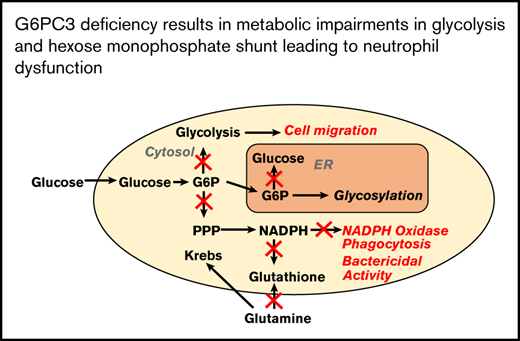
Severe congenital neutropenia type 4 (SCN-4) is an autosomal recessive condition in which mutations in the G6PC3 gene encoding for the catalytic 3 subunit of glucose-6-phosphatase-β result in neutropenia, neutrophil dysfunction, and other syndromic features. We report a child with SCN-4 caused by compound heterozygous mutations in G6PC3, a previously identified missense mutation in exon 6 (c.758G>A[p.R235H]), and a novel missense mutation in exon 2 (c.325G>A[p.G109S]). The patient had recurrent bacterial infections, inflammatory bowel disease, neutropenia, and intermittent thrombocytopenia. Administration of granulocyte colony–stimulating factor (G-CSF) resolved the neutropenia and allowed for detailed evaluation of human neutrophil function. Random and directed migration by the patient’s neutrophils was severely diminished. Associated with this were defects in CD11b expression and F-actin assembly. Bactericidal activity at bacteria/neutrophil ratios >1:1 was also diminished and was associated with attenuated ingestion. Superoxide anion generation was <25% of control values, but phox proteins appeared quantitatively normal. Extensive metabolomics analysis at steady state and upon incubation with stable isotope–labeled tracers (U-13C-glucose, 13C,15N-glutamine, and U-13C-fructose) demonstrated dramatic impairments in early glycolysis (hexose phosphate levels), hexosemonophosphate shunt (required for the generation of the NADPH), and the total adenylate pool, which could explain the dramatic cell dysfunction displayed by the patient’s neutrophils. Preliminary experiments with fructose supplementation to bypass the enzyme block demonstrated that the metabolic profile could be reversed, but was not sustained long enough for functional improvement. In human deficiency of G6PC3, metabolic defects resulting from the enzyme deficiency account for diverse neutrophil functional defects and present a major risk of infection.
Introduction
Severe congenital neutropenia type 4 (SCN-4) is an autosomal recessive inherited neutropenia first described in humans in 2007.1 The clinical phenotype for SCN-4 is diverse and may include urogenital and cardiac anomalies or prominent superficial vasculature.2 SCN-4 is the result of biallelic mutations in the G6PC3 gene encoding the enzyme glucose 6-phosphatase-β residing in the endoplasmic reticulum (ER). This enzyme plays an important role in intracellular glucose homeostasis by hydrolyzing glucose 6-phosphate (G6P) to d-glucose and inorganic phosphate. More than 57 patients and 35 unique mutations have been identified.3
Glucose 6-phosphatase-β was first implicated in neutropenia and neutrophil dysfunction in a murine knockout model.4 The G6pc3−/− mouse neutrophils show defects in bactericidal activity, chemotaxis, oxidative burst, and increased apoptosis and ER stress. A subsequent murine study demonstrated metabolic impairments including reduced intracellular glucose uptake, cytosolic G6P, and glycolytic byproducts, including lactate and ATP.5 In vivo administration of granulocyte colony–stimulating factor (G-CSF) appears to ameliorate abnormalities in energy homeostasis and reduces the degree of neutrophil apoptosis.6
The mechanism of increased apoptosis and neutrophil dysfunction is incompletely understood. Murine models demonstrate decreased survival, impaired granulocyte differentiation, and lack of glucose recycling between the ER and cytoplasm.5,7 CXCR4 expression, which plays a vital role in granulocyte mobilization, is increased in both g6pc3−/− mice and humans.6,8
The understanding of neutrophil functional defects in humans is limited. Human studies confirm increased apoptosis and ER stress and decreased respiratory burst.1,5 Limited metabolic data are available, but the decrease in cytosolic G6P, lactate, and ATP appears consistent with animal data.5
In this study, we recorded extensive data describing defects in neutrophil function in a patient with a novel mutation in G6PC3. We augmented the understanding of functional defects by examining their associated biochemical processes and correlated these data with extensive metabolomics profiling. For the first time, we documented perturbations of steady-state metabolism in neutrophils from our patient and provided flux measurements of glycolysis, HMS, and Krebs cycle, upon incubation with stable isotope–labeled tracers ([13C6]glucose and [13C5,15N2]glutamine). These findings reveal a bottleneck at hexose phosphate impairing flux toward the HMS and glycolytic pathways. We achieved partial correction of the metabolic defect with [U-13C]fructose incubation bypassing the metabolic blockade at the G6P level.
Methods
Confirmation of genotype
Genomic DNA was isolated from peripheral blood leukocytes from the patient and both parents. The entire coding region and exon/intron boundaries of the G6PC3 gene were analyzed by polymerase chain reaction and bidirectional sequencing by standard techniques.
Neutrophil isolation
Heparinized peripheral blood was obtained under consent approved by the Colorado Multiple Institutional Review Board at the University of Colorado Anschutz Medical Campus. Neutrophils were isolated by dextran sedimentation and hypotonic lysis of the residual red blood cells and were resuspended in Krebs-Ringer phosphate buffer with 2% dextrose (KRPD).9,10 To obtain a sufficient number of cells for studies, we collected neutrophils while the patient was receiving G-CSF. Cell preparations were 87% to 92% neutrophils with a viability >95% by trypan blue exclusion. Peripheral blood counts completed during G-CSF treatment of the patient included white blood cell count of 4.03 × 10³ ± 0.38 × 10³/µL (mean ± standard error of the mean [SEM], n = 9); absolute neutrophil count, 1.98 × 10³ ± 0.35 × 10³/µL; absolute band count, 0.01 × 10³ ± 0.01 × 10³/µL; and absolute lymphocyte count, 1.57 × 10³ ± 0.14 × 10³/µL.
Neutrophil bactericidal activity
Neutrophil bactericidal activity was measured by standard techniques.9-11 In brief, 1.25 × 10⁶ neutrophils were combined with Staphylococcus aureus in 500 μL of 10% pooled human serum in KRPD buffer at bacteria/neutrophil ratios of 1:1, 5:1, or 10:1 and incubated at 37°C. Aliquots were removed at 0, 30, 60, 90, and 120 minutes. Cells were lysed in serial dilutions of sterile water (pH 11), and aliquots were mixed with trypticase soy agar. After overnight culture at 37°C, the colonies were counted. Surviving bacteria are expressed as the percentage of the initial values (% viability).
Ingestion studies
Ingestion of S aureus was completed as described previously.9,10 Small aliquots (40 μL) from the bactericidal assay tubes (1:1 ratio of bacteria to neutrophils) were removed at 0, 5, 10, and 15 minutes and mixed with 400 μL of cold buffer. After they were cytocentrifuged onto microscope slides, the preparations were air dried and stained with Wright Giemsa. The percentage of neutrophils containing ingested bacteria was determined by direct microscopic observation.
Chemotaxis
Neutrophil motility was measured with 2 methods. The first determined chemotaxis using an under-agarose technique.12,13 Five milliliters 10% agarose was plated on plastic Petri dishes. Neutrophils were allowed to migrate under the agarose from a source well that was cut a fixed distance from a second well containing chemotactic stimuli (10% zymosan-activated serum [ZAS], formyl-methionyl-leucyl-phenylalanine [fMLF] at 10−7 M, or buffer control) for 2 hours at 37°C in a 5% CO2 incubator. The dishes were fixed overnight at 4°C with methanol, incubated with 37% paraformaldehyde, and washed before staining with Wright Giemsa. The distance (in micrometers) migrated by the leading edge of neutrophils was measured with a dissecting microscope.
A fluorescence-based chemotaxis assay, as described previously, was also used.14 Neutrophils in Hanks’ balanced salt solution were incubated with 1 µM calcein-AM for 15 minutes at 37°C, washed, and resuspended in KRPD with 0.1% human serum albumin. Labeled cells (106) were added to the top chambers of HTS FluroBloc plates (Corning Life Sciences, Tewksbury, MA) and allowed to move through a fluorescence-blocking polyethylene terephthalate (PET) membrane toward chemoattractants in the lower chambers. Fluorescence entering the lower chambers was monitored in a LUMIstar Optima luminometer (BMG Labtech) at 37°C every 2 minutes for 1 hour. The maximum rates of fluorescence transfer were determined and normalized to account for labeling efficiency determined with a standard aliquot of cells. Patient and control cell migration was expressed as the percentage of 106 labeled cells moving through the membrane.
NADPH oxidase activity
Superoxide anion production was measured as superoxide dismutase (SOD)–inhibitable, chemiluminescence of Diogenes reagent (National Diagnostics) in KRPD buffer (resting) or stimulated neutrophils (10−6 M fMLF or 200 ng/mL phorbol 12-myristate 13-acetate [PMA]), as previously described.15,16 Cells (0.75 × 10⁶) in 120 µL of KRPD were preincubated at 37°C for 10 minutes in white, 96-well microtiter plates (Nunc) in the presence or absence of SOD (15 µg/mL). Prewarmed superoxide chemiluminescent enhancer (30 µL; Diogenes; National Diagnostics) and fMLF (6 µL) were injected, in 1 second, by a fluid-handling system, or PMA (0.75 µL) was added manually. With shaking at 37°C, the amount of light was measured every second for 5 minutes for fMLF and every 20 seconds for 30 minutes for PMA. SOD was included as a control for SOD-inhibitable superoxide anion production. Areas were determined by cumulative light measurements completed during the assay (area under the curve), with the control SOD values subtracted and SOD-inhibitable superoxide anion expressed as total luminescence in relative light units. SOD inhibited 98% of the luminescence associated with fMLF and >90% of that associated with PMA.
Western blot analysis
NADPH oxidase components were measured by western blot with standard techniques.17,18 Neutrophil preparations (108 cells/mL) were suspended in lysis buffer containing a protease inhibitor cocktail (cOmplete ULTRA; Roche) and frozen at −70°C. Protein concentration was determined by BCA protein assay. Patient and control cell lysates (20 µg) were separated by sodium dodecyl sulfate/polyacrylamide gel electrophoresis, transferred to nitrocellulose, and probed first with antibodies for gp91phox, p22phox, p47phox, and p67phox and then with peroxidase-linked secondary antibodies. Proteins were detected with an enhanced chemiluminescence system (GE Healthcare).
CD11b expression and F-actin content
Expression of CD11b was determined after incubation of neutrophils (5 × 10⁵) with buffer, PMA (200 ng/mL), or fMLF (10−6 M) for 5 minutes at 37°C. Samples were quenched with KRPD on ice and centrifuged at 3000g for 10 minutes at 4°C. Pellets were resuspended with 20 µL phycoerythrin-labeled mouse anti-human CD11b or isotype control–labeled mouse anti-human IgG2α (BD Biosciences, San Jose, CA) in 80 µL KRPD and incubated on ice in the dark for 30 minutes. Samples were washed again in excess KRPD, centrifuged at 300g for 10 minutes at 4°C, and fixed with 2% paraformaldehyde. Cell surface CD11b was detected with direct immunofluorescence by flow cytometry, with 10 000 events counted, and expressed as log fluorescence, as previously described.11,18 Analysis of the neutrophil population determined that 94% to 98% of patient and control samples were positive for CD11b.
For F-actin content, neutrophils, as above, were stimulated with buffer, PMA, or fMLF in Hanks’/HEPES buffer (pH 7.15) with 0.05% HSA for 10 minutes at 37°C with shaking. Cells were permeabilized and fixed with 0.01% lysophosphatidylcholine/3.7% formaldehyde for 5 minutes at 37°C and labeled with 0.165 µM NBD (N-(7-nitrobenz-2-oxa-1,3-diazol-4-yl)phallacidin, NBD-phallacidin) in HSA for 10 minutes at 37°C with shaking. Samples were centrifuged at 400g for 6 minutes at 4°C, and the pellets were resuspended in ice-cold HSA. Fluorescence was measured by flow cytometry and presented as log fluorescence, as previously described.11,18
Hexokinase assay
Neutrophils (106 cells/mL) were incubated with buffer or 1 µM fMLF for 5 minutes at 37°C. Cells were lysed, processed, and assayed for hexokinase activity according to the manufacturer’s instructions (Cell Biolabs Inc, San Diego, CA). Colorimetric changes accompanying substrate phosphorylation were measured at 450 nm, and hexokinase activity was expressed as milliunits per 106 neutrophils.
Global metabolomics and stable isotope metabolic tracing
Several different metabolomics experiments were performed. For steady-state, untargeted analysis of metabolites was performed in healthy control and patient neutrophils. Neutrophils (1.5 × 10⁶) in 1 mL of KRPD were incubated for 15 minutes at 37°C with gentle agitation, and 250 µL was removed for testing. After centrifugation at 1500g for 10 minutes at 4°C, the supernatants were removed. Cell pellets and supernatants were stored at −80°C until the metabolite analysis was completed, as will be summarized later.
For flux analysis, neutrophils from control and patient samples were preincubated for 10 minutes at 37°C in 0.2% [13C6]glucose (Sigma-Aldrich, St. Louis, MO) or 2.5 mM [13C5,15N2]glutamine (Sigma-Aldrich) in KRPD and, for fructose supplementation experiments, in 5 mM [U-13C]fructose (Sigma-Aldrich). In all experiments with labeled tracers, a time 0 aliquot (250 µL) was then removed and placed on ice, and the remaining cell suspension was stimulated with 1 µM fMLF for 5 minutes at 37°C. Stimulated samples were removed, placed on ice, and cell pellets, and supernatants from those and time 0 specimens were prepared as described for the steady-state analysis.
Samples were processed as previously described via ultra-high-pressure liquid chromatography coupled online to mass spectrometry on a Vanquish-Q Exactive system (Thermo Fisher, Bremen, Germany).19,20
Additional functional assays with fructose supplementation
Neutrophils were incubated in the presence and absence of 5 mM fructose for 5 minutes at 37°C. Assays for chemotaxis by a fluorescence-labeling technique, to determine response to fMLP (10−7 M) and superoxide anion production after stimulation with PMA (200 ng/mL), were completed as described earlier.
Results
Case presentation
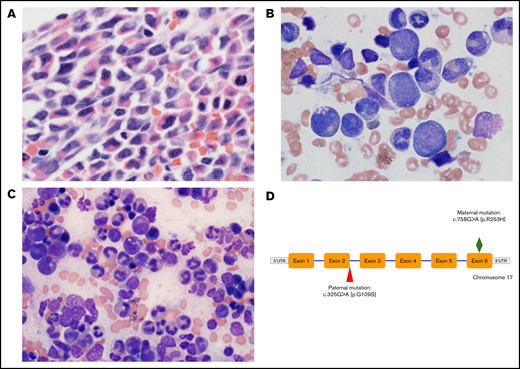
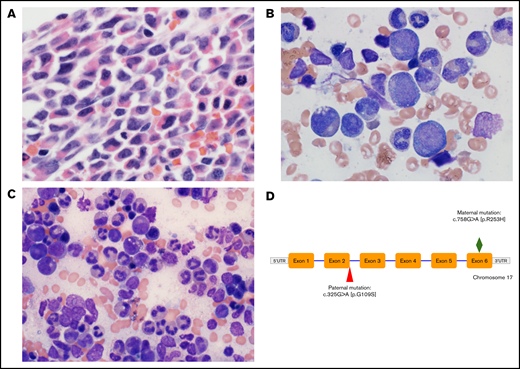
A male infant was born at term to nonconsanguineous parents from India. Severe neutropenia (absolute neutrophil count, <100) was first noted at 6 weeks of age when he presented with fever and failure to thrive. Diagnostic bone marrow aspirate and biopsy specimens demonstrated hypercellularity, left-shifted myeloid maturation, extensive vacuolization, and degenerative pyknotic nuclei (Figure 1). His postnatal course was complicated by detection of ventricular septal defect and pulmonary hypertension. A second bone marrow examination was performed while the patient was treated with long-term G-CSF therapy, and the results showed normal myeloid maturation.
Diagnostic micrographs of the patient’s bone marrow biopsy specimen and aspirates and genetic mutation. (A) Wright-Giemsa–stained low-power view of diagnostic patient bone marrow biopsy specimen before initiation of G-CSF administration showing hypercellularity with left-shifted myeloid maturation. Original magnification ×400. (B) Wright-Giemsa stained high-power view of bone marrow aspirate demonstrating vacuolization of myeloid precursors and pyknotic nuclei (2% myeloblasts, 12% promyelocytes, 26% myelocytes, 26% metamyelocytes, 8% bands, 9% segmented neutrophils). Original magnification ×1000. (C) High-power view of bone marrow aspirate after chronic G-CSF administration showing improved myeloid maturation (2% promyelocytes, 10% myelocytes, 11% metamyelocytes, 20% bands, 36% segmented neutrophils). Original magnification ×600. (D) Biallelic patient gene mutation showing compound heterozygous mutations in the G6PC3 gene. The paternal mutation at the terminus of exon 2 is a novel pathogenic variant that has not been described previously.
Diagnostic micrographs of the patient’s bone marrow biopsy specimen and aspirates and genetic mutation. (A) Wright-Giemsa–stained low-power view of diagnostic patient bone marrow biopsy specimen before initiation of G-CSF administration showing hypercellularity with left-shifted myeloid maturation. Original magnification ×400. (B) Wright-Giemsa stained high-power view of bone marrow aspirate demonstrating vacuolization of myeloid precursors and pyknotic nuclei (2% myeloblasts, 12% promyelocytes, 26% myelocytes, 26% metamyelocytes, 8% bands, 9% segmented neutrophils). Original magnification ×1000. (C) High-power view of bone marrow aspirate after chronic G-CSF administration showing improved myeloid maturation (2% promyelocytes, 10% myelocytes, 11% metamyelocytes, 20% bands, 36% segmented neutrophils). Original magnification ×600. (D) Biallelic patient gene mutation showing compound heterozygous mutations in the G6PC3 gene. The paternal mutation at the terminus of exon 2 is a novel pathogenic variant that has not been described previously.
Genetic testing identified compound heterozygous mutations in G6PC3. The maternal mutation c.758G>A [p.R235H] is a previously described missense mutation in exon 6. The paternal variant represents a novel missense change substituting a single nucleotide from G to A at complementary DNA position 325 (c.325G>A) in the G6PC3 gene. The substitution results in replacement of the wild-type amino acid glycine with serine at codon 109 (p.Gly109Ser, G109S). This amino acid substitution is considered conservative because of the small physiochemical difference between glycine and serine. It is predicted to be damaging by multiple in silico prediction software programs (PROVEAN, SIFT, and PolyPhen-2).21 Because codon 109 is at the end of exon 2 of the G6PC3 gene, this mutation could also result in a splicing abnormality.
The patient experienced multiple infectious complications, including recurrent cellulitis, skin abscesses, and perianal infections with inflammatory bowel disease. The neutrophil count normalized with administration of 8 to 10 μg/kg per day of G-CSF. He continued to have skin abscesses after correction of his neutropenia; his inflammatory bowel disease resolved.
Cell motility, CD11b surface expression, and F-actin assembly
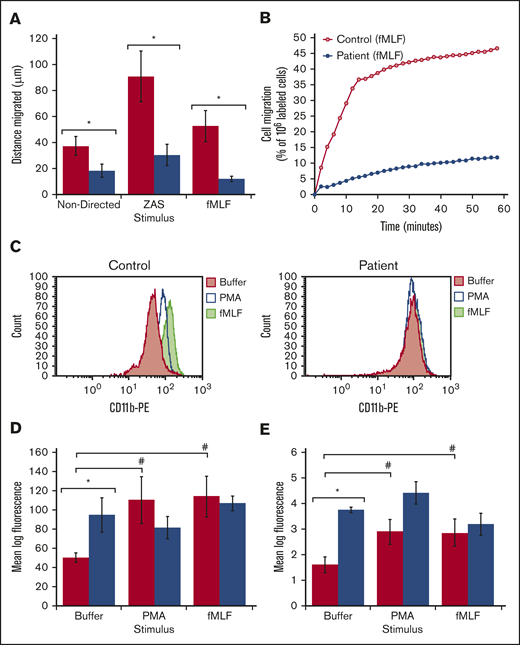
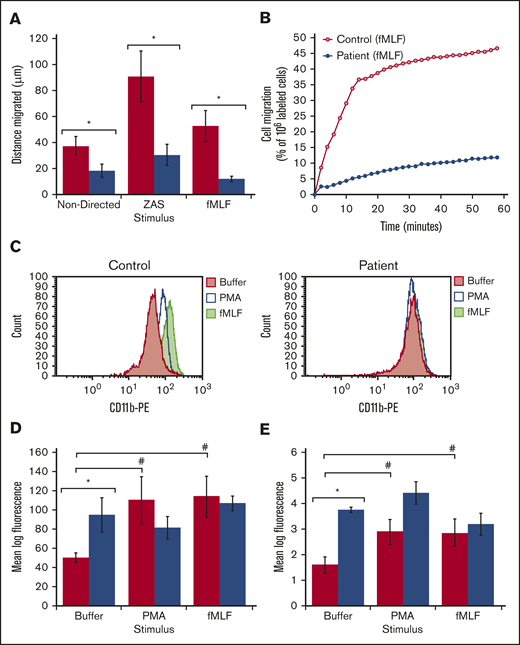
Patient neutrophils showed impaired motility compared with neutrophils from healthy adult controls (Figure 2A-B; under-agarose and fluorescence-labeled assays, respectively). Both nondirected and directed migration were decreased by >50%. In addition to the tests described herein, the patient had chemotaxis measured on 2 separate occasions at the migration’s leading edge, in a modified Boyden chamber technique in buffer (Buf) or ZAS.11 The results showed neutrophils in the cell migration’s leading edge to be as follows: patient Buf, 30 µm; ZAS, 38 µm; control Buf 43 µm; and ZAS, 104 µm. The second analysis demonstrated patient cells in Buf, 23 µm, and ZAS 40 µm; and control cells in Buf, 29 µm, and ZAS, 117 µm. Thus, markedly diminished motility was demonstrated by multiple techniques.
Cell motility, CD11b expression, and F-actin content and assembly. (A) Chemotaxis measured using the under-agarose technique showing distance migrated for each stimulus (mean ± SEM) for the control and patient’s neutrophils, respectively, in 3 to 4 experiments, using independent neutrophil isolation. *P < .05, by 2-tailed Student t test,. (B) Chemotaxis measured using the transmembrane migration technique in response to fMLF. Fluorescence-labeled patient cells and control cell were detected as they crossed the fluorescence-blocking PET membrane into the lower wells in the system. Fluorescence moving into the lower wells is expressed as a percentage of the fluorescence detected in 106 labeled cells and is plotted over time. Directed migration was decreased in the patient’s cells; nondirected migration with buffer was also decreased in the patient’s cells (data not shown). (C) Flow cytometry histogram showing a representative example of CD11b expression for control and patient neutrophils after incubation with buffer, PMA, and fMLF. (D) Cell surface levels of CD11b determined by flow cytometry and presented as mean log fluorescence after incubation with buffer, PMA, and fMLF for the control (red) and patient’s (blue) neutrophils. Bars and brackets represent the mean ± SEM of results in 3 to 5 experiments on independent neutrophil isolations. (E) F-actin assembly was measured as in “Methods” and plotted as mean log fluorescence for buffer, PMA, and fMLF for the control (red) and the patient (blue). The bars and brackets are ±SEM of results in 3 experiments using independent neutrophil isolations. (D-E) *P < .05, patient vs control in a given treatment condition, and #P < .05, given stimulus vs buffer, by 2-tailed Student t test.
Cell motility, CD11b expression, and F-actin content and assembly. (A) Chemotaxis measured using the under-agarose technique showing distance migrated for each stimulus (mean ± SEM) for the control and patient’s neutrophils, respectively, in 3 to 4 experiments, using independent neutrophil isolation. *P < .05, by 2-tailed Student t test,. (B) Chemotaxis measured using the transmembrane migration technique in response to fMLF. Fluorescence-labeled patient cells and control cell were detected as they crossed the fluorescence-blocking PET membrane into the lower wells in the system. Fluorescence moving into the lower wells is expressed as a percentage of the fluorescence detected in 106 labeled cells and is plotted over time. Directed migration was decreased in the patient’s cells; nondirected migration with buffer was also decreased in the patient’s cells (data not shown). (C) Flow cytometry histogram showing a representative example of CD11b expression for control and patient neutrophils after incubation with buffer, PMA, and fMLF. (D) Cell surface levels of CD11b determined by flow cytometry and presented as mean log fluorescence after incubation with buffer, PMA, and fMLF for the control (red) and patient’s (blue) neutrophils. Bars and brackets represent the mean ± SEM of results in 3 to 5 experiments on independent neutrophil isolations. (E) F-actin assembly was measured as in “Methods” and plotted as mean log fluorescence for buffer, PMA, and fMLF for the control (red) and the patient (blue). The bars and brackets are ±SEM of results in 3 experiments using independent neutrophil isolations. (D-E) *P < .05, patient vs control in a given treatment condition, and #P < .05, given stimulus vs buffer, by 2-tailed Student t test.
To explore whether the observed defect in chemotaxis could be explained by defects in actin assembly and adhesion molecule expression, we examined cell surface levels of CD11b and the extent of filamentous actin in patient and control neutrophils in resting conditions (buffer) and after stimulation with PMA or fMLF. Histograms showing representative assays for CD11b expression of control and patient cells as stacked plots of number of cells vs log fluorescence after incubation with buffer PMA and fMLF are included in Figure 2C, and summary results for mean log fluorescence for 3 to 5 experiments are presented in Figure 2D. Nonstimulated G6PC3-deficient neutrophils had significantly higher levels of cell surface CD11b than did the control cells (Figure 2C-D). Stimulation with PMA or fMLF did not increase CD11b expression in patient neutrophils but increased expression by twofold in control cells. Stacked plots for F-actin in control and patient cells in resting and stimulated cells were qualitatively similar to the CD11b results (histograms not shown). Filamentous actin was present in higher concentrations in G6PC3-deficient neutrophils (Figure 2E). F-actin increased approximately twofold in response to stimulation in control neutrophils, whereas the level of F-actin in G6PC3-deficient neutrophils remained higher than that in stimulated control neutrophils and did not change relative to the nonstimulated condition.
Bactericidal activity, bacterial ingestion, and superoxide anion production
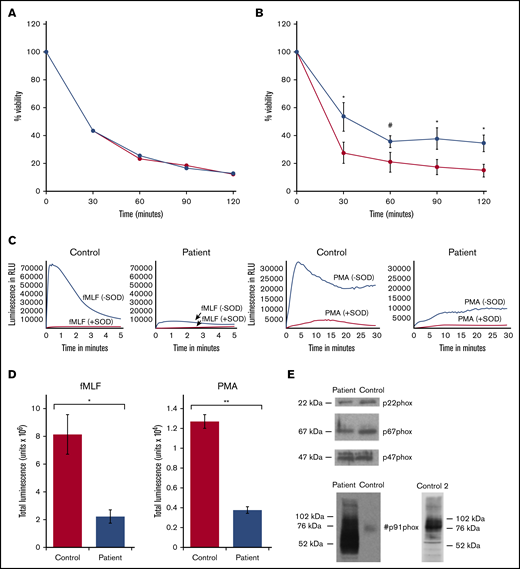
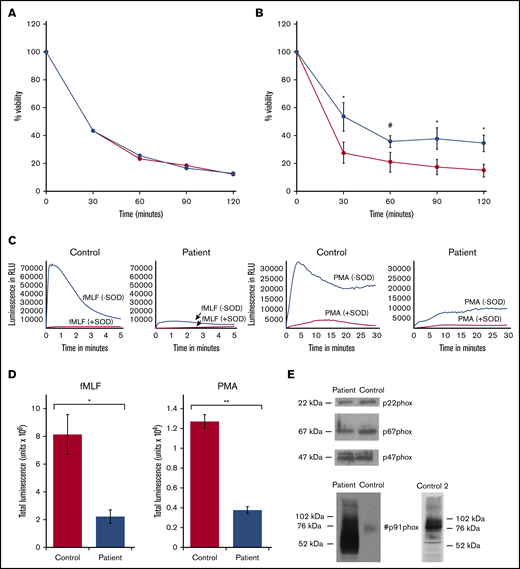
Results of bactericidal assays performed with various ratios of S aureus to neutrophils are shown in Figure 3. Bacteria killing was similar in G6PC3-deficient and control neutrophils at a ratio of 1:1 (Figure 3A; average of 2 separate experiments), but a mild but significant defect became apparent at higher ratios (5:1 or 10:1; n = 3; Figure 3B). These results could be explained by abnormal ingestion and/or intracellular killing mechanisms. Ingestion studies were performed on 2 occasions. The average results of 2 experiments are shown in Table 1. Although ingestion by patient neutrophils appeared comparable to that of control cells for the first 10 minutes, phagocytosis by 15 minutes lagged behind control values.
Bactericidal activity of control and patient neutrophils, generation of superoxide anion, and western blot of oxidase proteins. (A) Neutrophil-mediated killing of S aureus in the presence of normal human serum at a bacteria/neutrophil ratio of 1:1. Control (red) and patient (blue) results, plotted as viability at the sampling time points, are the average results of 2 experiments and cell isolations. (B) Bactericidal activity for control (red) and patient (blue) neutrophils at bacteria/neutrophil ratios >1:1 plotted as viability at the sampling time points. Error bars represent mean ± SEM of results in 3 experiments completed on separate cell isolations. *P < .05, by 2-tailed paired Student t test; #P < .05, by 1-tailed paired Student t test. (C) Representative superoxide anion generation assays for control and patient neutrophils in response to fMLF (left 2 panels) and PMA (right 2 panels), as described in “Methods”; assay results with addition of SOD are included. Luminescence as relative light units (RLU) is plotted over time. Patient neutrophils exhibit a marked decrease compared with control. (D) Superoxide anion generation in response to fMLF and PMA was measured as SOD-inhibitable luminescence, as described in “Methods.” Total luminescence for the assay is plotted for PMA and fMLF for control and patient. Bars and brackets represent mean ± SEM of results in 3 experiments performed on 3 separate occasions on independently isolated neutrophils. *P < .05 and **P < .005, by 2-tailed Student t test. (E) Western blots for p22phox, p67phox, p47phox, and gp91phox in patient and control neutrophils. The blots are representative of results obtained using neutrophils from 2 independent isolations. A second western blot (control 2) is shown for comparison purposes. Molecular weight markers are on the left of the blot, with phox protein designations on the right or in the middle.
Bactericidal activity of control and patient neutrophils, generation of superoxide anion, and western blot of oxidase proteins. (A) Neutrophil-mediated killing of S aureus in the presence of normal human serum at a bacteria/neutrophil ratio of 1:1. Control (red) and patient (blue) results, plotted as viability at the sampling time points, are the average results of 2 experiments and cell isolations. (B) Bactericidal activity for control (red) and patient (blue) neutrophils at bacteria/neutrophil ratios >1:1 plotted as viability at the sampling time points. Error bars represent mean ± SEM of results in 3 experiments completed on separate cell isolations. *P < .05, by 2-tailed paired Student t test; #P < .05, by 1-tailed paired Student t test. (C) Representative superoxide anion generation assays for control and patient neutrophils in response to fMLF (left 2 panels) and PMA (right 2 panels), as described in “Methods”; assay results with addition of SOD are included. Luminescence as relative light units (RLU) is plotted over time. Patient neutrophils exhibit a marked decrease compared with control. (D) Superoxide anion generation in response to fMLF and PMA was measured as SOD-inhibitable luminescence, as described in “Methods.” Total luminescence for the assay is plotted for PMA and fMLF for control and patient. Bars and brackets represent mean ± SEM of results in 3 experiments performed on 3 separate occasions on independently isolated neutrophils. *P < .05 and **P < .005, by 2-tailed Student t test. (E) Western blots for p22phox, p67phox, p47phox, and gp91phox in patient and control neutrophils. The blots are representative of results obtained using neutrophils from 2 independent isolations. A second western blot (control 2) is shown for comparison purposes. Molecular weight markers are on the left of the blot, with phox protein designations on the right or in the middle.
Intracellular killing is dependent on superoxide anion produced by NADPH oxidase. Superoxide anion, measured by SOD-inhibitable chemiluminescence, was dramatically reduced in patient cells. Figure 3C shows representative assays for luminescence without and with the addition of SOD to the patient and control neutrophils after stimulation with fMLF or PMA. The patient cells demonstrated a marked deficiency of luminescence generation, with most being inhibited by SOD. The summary of results of SOD-inhibitable superoxide anion production from 3 different cell isolations is presented in Figure 3D; the amount of superoxide anion produced by G6PC3-deficient neutrophils was ∼25% to 30% of control in response to stimulation with either fMLF or PMA. Western blots of NADPH oxidase components did not show deficient gp91phox, p22phox, p47phox, or p67phox (Figure 3E); the blots are representative examples of results from 2 separate cell isolations. In the blot of gp91phox, the control cells had a lighter band at ∼76 kDa and the patient cells had a dark series of bands at 76 to 90 kDa, as well as between 50 and 75 kDa. A second control blot was included, showing major bands for gp91phox at 76 to 90 kDa. The broadened bands representing gp91phox from the patient neutrophils suggested an abnormal glycosylation pattern.
Steady-state metabolomics
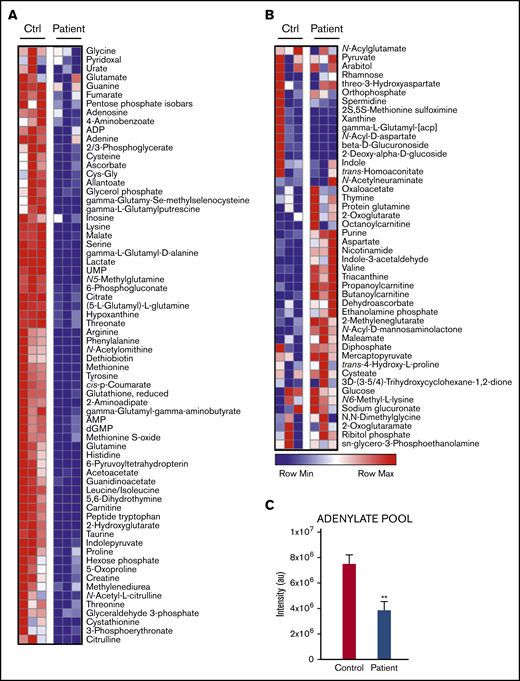
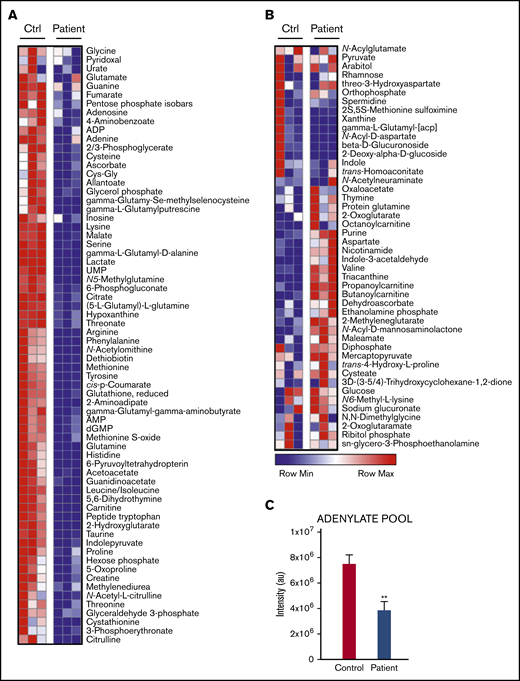
An array of central carbon and nitrogen metabolites were measured in isolated neutrophils from the patient and a healthy control. G6PC3-deficient neutrophils demonstrated decreased levels of metabolites including amino acids, glycolytic intermediates (hexose phosphate, glyceraldehyde 3-phosphate, and lactate), reduced glutathione (GSH) and intermediates of arginine metabolism (Figure 4A-B). Significant decreases were noted in the steady-state levels of observed metabolites involved in redox homeostasis (eg, GSH, cysteine, methionine, and ribose phosphate [RP], an HMS byproduct), the Krebs cycle (citrate, fumarate, and malate), and the adenylate pool (Figure 4C; sum of ADP, AMP, adenine, and adenosine). Higher steady-state levels of glucose were detected in G6PC3-deficient neutrophils, suggesting a metabolic blockade in early glycolysis, rather than a limitation in glucose availability.
Metabolite levels in resting patient vs control neutrophils. (A) Metabolites decreased in the patient’s neutrophils relative to control cells. (B) Metabolites elevated in the patient’s neutrophils. Results of 3 separate measurements. Differences significant at P < .001. (C) Changes in adenylate pool (sum of ADP, AMP, adenosine, and adenine) between control and patient neutrophils. Data are plotted as means ± standard deviation. **P < .005.
Metabolite levels in resting patient vs control neutrophils. (A) Metabolites decreased in the patient’s neutrophils relative to control cells. (B) Metabolites elevated in the patient’s neutrophils. Results of 3 separate measurements. Differences significant at P < .001. (C) Changes in adenylate pool (sum of ADP, AMP, adenosine, and adenine) between control and patient neutrophils. Data are plotted as means ± standard deviation. **P < .005.
Flux experiments using [13C6]glucose or [13C5,15N2]glutamine
To complement steady-state observations of impaired glycolysis and Krebs cycle, we incubated cells at 37°C for 10 minutes in buffer containing either [13C6]glucose or [13C5,15N2]glutamine and then stimulated them with the NADPH oxidase agonist fMLF (Figures 5 and 6, respectively).
Schematic overview of [13C6]glucose stable isotope tracings. (A) Tracing using [13C6]glucose including glycolytic and HMS pathways. (B) Tracing using [13C6]glucose in control and patient neutrophils before (time 0) and 5 minutes after incubation with 1 µM fMLF. Isotopologue intensities plotted correspond to labeling indicated in panel A (eg, 13C6 for glucose).
Schematic overview of [13C6]glucose stable isotope tracings. (A) Tracing using [13C6]glucose including glycolytic and HMS pathways. (B) Tracing using [13C6]glucose in control and patient neutrophils before (time 0) and 5 minutes after incubation with 1 µM fMLF. Isotopologue intensities plotted correspond to labeling indicated in panel A (eg, 13C6 for glucose).
Schematic overview of [13C5,15N2]glutamine stable isotope tracings. (A) Tracing using [13C5,15N2]glutamine includes glutaminolytic and Krebs cycle pathways before (time 0) and 5 minutes after incubation with 1 µM fMLF. (B) Tracing using [13C5,15N2]glutamine in control and patient neutrophils before and after treatment with fMLF. The isotopologue intensities plotted correspond to labeling indicated in panel A (eg, 13C5,15N2 for Gln).
Schematic overview of [13C5,15N2]glutamine stable isotope tracings. (A) Tracing using [13C5,15N2]glutamine includes glutaminolytic and Krebs cycle pathways before (time 0) and 5 minutes after incubation with 1 µM fMLF. (B) Tracing using [13C5,15N2]glutamine in control and patient neutrophils before and after treatment with fMLF. The isotopologue intensities plotted correspond to labeling indicated in panel A (eg, 13C5,15N2 for Gln).
In the heavy glucose experiment, before and after addition of fMLF, patient neutrophils had taken up higher levels of [13C6]glucose (Figure 5), but had converted far less of this labeled glucose into G6P than the control cells, implying a defect in hexokinase or glucokinase. Likewise, enrichment of the glycolytic intermediate glyceraldehyde 3-phosphate and terminal metabolite lactate were dramatically reduced in patient cells, suggesting that glycolysis was stalled by the defective conversion of glucose to G6P. 13C-labeled RP, formed from G6P by the HMS, was lower in patient cells than in control cells, implying that the reduction of cytosolic G6P in the patient inhibits the HMS, because glucose phosphorylation is rate limiting. After addition of fMLF, cytosolic G6P levels declined, and RP levels increased in the control cells, reflecting consumption of NADPH related to NADPH oxidase activity and acceleration of the HMS to replace it. In patient cells, however, the initial low levels of RP and G6P were unchanged with stimulation, suggesting that the deficit in cytosolic G6P prevents a necessary acceleration of the HMS to supply the oxidase with NADPH. As HMS-derived carbons can reenter glycolysis at the glyceraldehyde 3-phosphate step, stimulation with fMLF increased the levels of this metabolite as well. Total and labeled levels of glucosamine phosphate and N-acetylglucosamine phosphate, intermediates of the hexosamine pathway required for protein N-glycosylation, were decreased in patient neutrophils (supplemental Figure 1). Levels are plotted as a ratio to hexose phosphate abundance, because amounts of this upstream metabolite change across groups. Because G6P is a rate-limiting substrate for this pathway, it is interesting to note that fMLF stimulation promoted decreases in glucosamine phosphate (normalized to G6P) in control and patient neutrophils. Such a change is consistent with an aberrant hexosamine pathway in patient neutrophils, reflected in the differential glycosylation phenotype observed on gp91phox (Figure 3E); however, levels of the downstream metabolite N-acetylglucosamine phosphate appear to be unchanged between patient and control cells. Further investigations are needed for a deeper investigation of such molecular links between metabolism and glycosylation.22 Incubation with stable isotope–labeled glutamine highlighted several differences between patient and control neutrophils (Figure 6). Evidence emerged of increased utilization of glutaminolysis to meet anabolic demands in patient cells, as gleaned by the transamination products (15N labeled) serine, glutamate, alanine, and aspartate, all higher in the patient cells. There was a reduction in intracellular [13C5,15N2]glutamine in patient cells and an increase in labeled glutamate relative that in to control cells after the 10-minute preincubation. However, this was not accompanied by increased synthesis of reduced glutathione (sum of isotopologues 13C5,15N1, and 13C5; Figure 6B). On the other hand, glutamine-derived Krebs cycle intermediates were lower in patient cells, including α-ketoglutarate (13C5), succinate, and malate (13C4). Patient cells had higher levels of oxidatively generated 13C4 citrate (but not the reductive carboxylation product 13C5) suggesting that the cells may try to overcome the loss of glycolysis-derived carbon sources for the citric acid cycle by glutaminolysis. Although levels of these enriched metabolites were higher in patient cells, total levels were lower (Figure 4), suggesting that this compensatory phenomenon was not sufficient to meet the metabolic demands of the cells.
Metabolomics after [U-13C]fructose incubation
G6PC3-deficient neutrophils have decreased levels of cytosolic G6P, a rate-limiting substrate in the glycolytic pathway and HMS. Fructose is metabolized by an alternative enzyme pathway and enters glycolysis as fructose 6-phosphate downstream of G6P, bypassing a blockade in glucose/G6P recycling from the ER, used by neutrophils and other phagocytic cells to preserve the intracellular glycogen stores necessary for sudden bursts in glucose demand during function.23 G6PC3-deficient neutrophils incubated with 5 mM [U-13C]fructose had significantly higher levels of enriched lactate (13C3) and RP (13C5) than with buffer alone. Fructose-incubated patient neutrophils had levels similar to those of these metabolites in control neutrophils, indicating correction of the metabolic defect in both the glycolytic pathway and HMS (Figure 7A). In addition, there was a partial correction in levels of 12C-reduced GSH; but, in this experiment, 13C-enriched GSH was not observed. However, fructose availability can replenish RP levels through the nonoxidative branch of the HMS, which is sufficient to generate pentose phosphate moieties for the de novo synthesis or salvage of nucleosides, but it is not paired with the synthesis of the NADPH necessary to sustain NADPH oxidase and bactericidal activity. Despite these metabolic benefits, fructose incubation did not improve neutrophil superoxide anion production and chemotaxis for patient neutrophils (Figure 7B-C).
Metabolic and function results in the presence of fructose incubation. (A) Levels of lactate, RP, and GSH in control and patient neutrophils following a 10-minute incubation with [U-13C]fructose; samples are before (time 0) and 5 minutes after incubation with 1 µM fMLF. (B) Superoxide anion production by neutrophils preincubated with or without 5 mM fructose and stimulated with PMA. SOD-inhibitable total luminescence is presented as described in “Methods.” (C) Chemotaxis in response to fMLF after preincubation with and without 5 mM fructose. Percentage of fluorescently labeled cells migrating across the polyethylene terephthalate (PET) membrane into the lower wells with fMLF stimulus over time is presented.
Metabolic and function results in the presence of fructose incubation. (A) Levels of lactate, RP, and GSH in control and patient neutrophils following a 10-minute incubation with [U-13C]fructose; samples are before (time 0) and 5 minutes after incubation with 1 µM fMLF. (B) Superoxide anion production by neutrophils preincubated with or without 5 mM fructose and stimulated with PMA. SOD-inhibitable total luminescence is presented as described in “Methods.” (C) Chemotaxis in response to fMLF after preincubation with and without 5 mM fructose. Percentage of fluorescently labeled cells migrating across the polyethylene terephthalate (PET) membrane into the lower wells with fMLF stimulus over time is presented.
An elegant study of a mouse model of G6PC3 deficiency revealed that the observed neutropenia is associated with supraphysiological levels of 1,5AG6P, the phosphorylated product of 1,5-anhydroglucitol, a sugar found in many foods.24 Accumulation of 1,5AG6P impaired glycolysis by inhibiting the activity of hexokinase. Pharmacologic intervention to decrease levels of anhydroglucitol normalized neutrophil counts. Metabolomics data from patient neutrophils aligned clearly with those in the previous report, revealing a sharp accumulation of 1,5AG6P in those cells, but not in the control cells (Figure 7A; anhydroglucitol not detected) and suggesting impairment of hexokinase activity, as judged by the relative levels of 13C6 hexose phosphate vs 13C6 glucose (Figure 5B). Hexokinase activity in nonstimulated control neutrophils was 9.87 ± 0.83 milliunits per 106 cells (mean ± SEM, n = 2 measurements from 1-cell isolation) and was no different after fMLF stimulation, 8.48 ± 1.40 milliunits. Nonstimulated patient neutrophils showed 7.41 ± 0.21 milliunits, but after fMLF stimulation decreased to 5.16 ± 0.62 milliunits (P < .05, by 1-tailed, unpaired Student t test). These results align with the metabolomic findings for 1,5AG6P (Figure 7).
Discussion
The patient who participated in this study demonstrated increased frequency of bacterial infections despite correction of neutropenia with G-CSF. The multiple functional defects in cell motility, F-actin assembly, CD11b expression, ingestion, bactericidal activity, and superoxide anion generation associated with the G6PC3 deficiency contributed to this predisposition for infection. As noted, the patient was receiving G-CSF therapy for his neutropenia. G-CSF has multiple pleiotropic effects on neutrophils. Although the control subjects in this study were not treated with G-CSF, a comprehensive evaluation of neutrophil function and biochemical characteristics for healthy adults during administration of G-CSF had been completed and published by our laboratory, using the techniques employed in the present study.11 Neutrophils produced under the influence of G-CSF exhibited a mild decrease in random and directed motility in response to ZAS, associated with a very mild decrease in F-actin assembly in response to fMLF, and no change in agonist-increased expression of CD11b. The patient’s neutrophils demonstrated a more severe motility defect and his F-actin assembly and CD11b expression were qualitatively and quantitatively different from healthy adults treated with G-CSF. Bactericidal activity by neutrophils from healthy subjects on G-CSF and our patient were both deficient at higher bacteria/cell ratios, but in those from the patient, more consistently so. The bactericidal activity defect in our patient was associated with a dramatic deficiency in the superoxide anion generation without deficiency of phox components exhibited by the patient’s neutrophils. This is compared with the variable and agonist-specific alterations (both increased and decreased) in the respiratory burst activity of neutrophils from subjects treated with G-CSF related to membrane characteristics, cell signaling, and some granule constituents. The patient’s bactericidal defect was further accompanied by inefficient phagocytosis. This finding suggests that the functional and biochemical characteristics of the patient’s neutrophils were not associated with his G-CSF treatment alone and were more likely attributable to his underlying genetic mutations and enzyme and metabolic defects.
The glucose-6-phosphatase-β isoenzyme was first described in 2002 by Martin et al.25 Unlike the other isoenzymes expressed in liver and kidney, glucose 6-phosphatase-β is ubiquitous in all tissues and most concentrated in muscle. This isoenzyme has hydrolytic activity similar to that of G6PC1 on the substrate G6P and higher substrate specificity for 2-deoxy-G6P.26 Located on the luminal surface of the neutrophil ER, G6PC3 maintains consistent cytosolic levels of G6P by recycling glucose between the ER and cytoplasm.5 The ER serves as a reservoir of G6P that can be hydrolyzed to d-glucose by G6Pase and transported to the cytosol where it is converted back to G6P for use in other pathways. Such trafficking is necessary for phagocytic cells to facilitate storage of glucose as intracellular glycogen, which can be mobilized locally upon cell activation without the need for liver-mediated glycogenolysis.23 Previous models and targeted measurements indicate that defects in G6PC3 would impair trafficking of hexose monophosphate moieties in and out of the ER, resulting in a metabolic bottleneck and an effete neutrophil with compromised functional activity. In addition, G6PC3 deficiency is known to result in accumulation of 1,5AG6P, a diet-derived metabolite capable of inhibiting hexokinase activity.24 We complement and expand on steady-state evidence from the literature by providing a comprehensive metabolic overview of neutrophils from a patient with a novel G6PC3 mutation. Metabolomics data from our patient with G6PC3 deficiency show decreased levels of cytosolic G6P consistent with other mouse and human data.5,24,27 In the absence of functional G6Pase, stored G6P cannot be liberated from the ER for use in the cytosol. G6P is an important metabolite at the intersection of several important pathways, including glycolysis and the HMS.
G6PC3-deficient neutrophils exhibited evidence of impaired glycolysis and energy production. Levels of glyceraldehyde-3-phosphate and lactate were significantly reduced, along with the adenylate pool, affecting cellular processes involved with chemotaxis. In ATP-depleted cells, the ratio of monomeric ATP-G-actin to ADP-G-actin decreases. Actin-binding proteins such as thymosin have a higher affinity for ATP-G-actin, preserving the monomeric pool and preventing excessive F-actin polymerization.28 The glycolytic impairment that limited ATP availability in our patient resulted in a greater proportion of neutrophil filamentous actin. The depleted monomeric G-actin pool prevented an increase in actin polymerization in patient cells in response to chemoattractant stimuli.
Neutrophil adhesion is also an important component of cell motility. These processes are dependent in part on surface expression of the integrin molecule CD11b/CD18. We propose that the glycolytic defect contributes to impaired neutrophil motility resulting from abnormal CD11b expression. Adenosine in neutrophils is produced by the breakdown of ATP. Adenosine forms localized gradients and promotes chemotaxis through A1 and A3 adenosine receptors. A1 receptors promote adhesion via CD11b/CD18-dependent mechanisms.29 Adenosine levels are decreased in patient neutrophils at baseline, preventing the enhancement of CD11b/CD18 expression.
G6P is a rate-limiting substrate for the HMS in the cytosol; decreased availability of cytosolic G6P is expected to restrict NADPH production by the HMS, limiting the substrate for NADPH oxidase. Sequestration of G6P in the ER impairs the HMS and leads to decreased neutrophil respiratory burst, as was observed in our patient, who had very low levels of superoxide anion production. Flux analysis of our patient by using stable isotope–labeled carbon showed significant impairment in the HMS with almost no production of the terminal product RP, suggesting a concomitant decrease in production of the substrate for NADPH oxidase. Unfortunately, NADPH levels were not quantified, as direct measurement of reduced nicotinamide cofactors by mass spectrometry requires specialized analytical approaches.30
Murine data show a decrease in expression of the phox components gp91phox, gp22phox, and gp47phox.5 In contrast, our patient had normal expression of all oxidase components but abnormal glycosylation of gp91phox. Tracing data with heavy glucose in patient neutrophils suggested an alteration of the hexosamine biosynthetic pathway that generates substrates for protein glycosylation in the ER and Golgi complexes.31
Although these findings are discrepant from those of the mouse model, our western blot pattern for gp91phox is similar to those published by Hayee et al who documented hypoglycosylation of human G6PC3-deficient neutrophils with severe truncation of the N- and O-glycomes.22 It seems more plausible that deficient NADPH oxidase activity results from limited substrate and abnormal glycosylation rather than from decreased expression of the phox proteins.
In the presence of impaired glycolysis, G6PC3-deficient neutrophils resort to alternative metabolic pathways for energy production. Glutamine is associated with increased production of superoxide anion and expression of the gp91phox, gp22phox, and gp47phox proteins in rat neutrophils.32 The glutaminase inhibitor, 6-diazo-5-oxo-l-norleucine decreases superoxide anion production in PMA-stimulated neutrophils. We saw evidence of increased glutaminolysis, which, through the synthesis of GSH, is an alternative compensatory redox pathway related to the impairment in the HMS generating NADPH for recycling of oxidized glutathione back to GSH.
An increased risk of leukemogenesis is reported in both G6PC3 deficiency and other types of severe congenital neutropenia.2,33 A potential mechanism for leukemogenesis in G6PC3 deficiency is the use of an alternative metabolic pathway involving 1-carbon metabolism. Serine biosynthesis was increased in our G6PC3-deficient patient. Serine is involved in the 1-carbon metabolism that is important for maintaining redox homeostasis by generating glycine and cysteine, amino acid components of the tripeptide glutathione. These alternative pathways have also been employed by cancer cells that have increased metabolic requirements.34,35
We hypothesized that in vitro incubation with fructose could bypass the glycolytic defect in glucose 6-phosphatase-β. Metabolism of this pentose in the fructolytic pathway forms the downstream glycolytic intermediate glyceraldehyde 3-phosphate or dihydroxyacetone phosphate. In rat neutrophils, in vitro fructose exposure has been shown to overactivate NADPH oxidase activity.36 Similarly, in vivo studies of rats fed high-fructose diets have demonstrated increases in CD11b, reactive oxygen species production, and phagocytosis compared with rats fed normal diets.37
Indeed, we found that in vitro fructose incubation led to near complete correction of the observed defects in glycolysis and HMS with restoration of lactate and RP levels. However, we did not observe a correction in the superoxide anion production or chemotaxis associated with these pathways. It may be that the supplementation used transiently altered the metabolic defect over the short term but did not reverse the functional defects, requiring greater levels over longer periods. Alternatively, fructose may fuel synthesis through the nonoxidative branch of the HMS, which does not generate the NADPH required to rescue the defective activity.
A new effect of the mutations in G6PC3 found in our patient’s neutrophils is the inhibition of hexokinase. This effect is suggested by the increase in 1,5-AG6P in patient cells after fMLF, by the inhibitory impact of this substrate,38 by the relative levels of glucose and hexose phosphate after fMLF activation in patient cells compared with that in normal cells and by the decrease in hexokinase in patient cells after fMLP stimulation. The findings support the dual role of G6PC3 in classic metabolism and metabolite repair and confirm the association of mutations with mechanisms of neutropenia and neutrophil dysfunction.
In summary, we present a novel mutation in G6PC3 and, using stable isotope metabolic tracers, characterize the resulting biochemical and functional defects in human neutrophils. We provide extensive metabolomic profiling of this defect, showing impairments in glycolysis and HMS and utilization of alternative metabolic pathways. We propose a bypass mechanism using the fructolytic pathway, which appeared to correct the metabolic phenotype, but did not repair the neutrophil functional defect and an additional effect of hexokinase inhibition. We acknowledge the limitation that the experiments described herein have been performed on neutrophils acquired from a single patient, but to our knowledge, this combination of mutations was heretofore unknown. Additional investigations are necessary to fully characterize how these mutations synergize to uniquely affect glucose homeostasis and neutropenia.
Original data are available on e-mail request to the corresponding author, Daniel R. Ambruso (daniel.ambruso@cuanschutz.edu).
Acknowledgments
The authors thank Richard B. Johnston Jr for helpful comments on the manuscript.
This study was supported in part by the Stacy True Memorial Trust Fund.
Authorship
Contribution: C.M. helped design the study, performed data analysis, and wrote the manuscript; M.E. helped design the study and performed the data analysis; N.J.B., A.B., and J.M. conducted the laboratory studies; A.D.T. conducted the laboratory studies and constructed the graphs; J.A.R. and A.D. performed metabolomic studies, constructed figures and wrote and edited the metabolomics portion of the manuscript; D.R.A. designed the study, was the principal investigator for the clinical protocol, organized laboratory studies, and wrote the manuscript.
Conflict-of-interest disclosure: The authors declare no competing financial interests.
Correspondence: Daniel R. Ambruso, University of Colorado School of Medicine, 13123 E 16th Ave, B115, Aurora, CO 80045; e-mail: daniel.ambruso@cuanschutz.edu.
Reference
Author notes
The full-text version of this article contains a data supplement.

![Schematic overview of [13C6]glucose stable isotope tracings. (A) Tracing using [13C6]glucose including glycolytic and HMS pathways. (B) Tracing using [13C6]glucose in control and patient neutrophils before (time 0) and 5 minutes after incubation with 1 µM fMLF. Isotopologue intensities plotted correspond to labeling indicated in panel A (eg, 13C6 for glucose).](https://ash.silverchair-cdn.com/ash/content_public/journal/bloodadvances/4/23/10.1182_bloodadvances.2020002225/3/m_advancesadv2020002225f5.png?Expires=1769618867&Signature=qDB8fg7jCDi0ohIVZi87QZ4HxL8Gwu25AsdbwMeUE56RkXTq6vtQ~L-pDrA6AvU54I~7LTl83q0xJX7u0j-5k9SO7FyhEPnUoVa17SBWv5TPQTKKr6d5fBjdCP1s~PufUapqAngrTQ8IWtV3Me8uTHAovmVOijVoz2P6-~6VbYjsvGIjmBjA3n3~7QhrH4vwJPkK7guQoQHeJLDlX6tVYQP8YCW0amjlvDVNMnDGdfERCEXaoseJU1OfRmNOxbrdQK5~~w-zPcFAtyFu1x7tiwYSOmQb9r7U-FvlywqRYiHvCIS968PnTOFNMwQ-ZOhnd~v8ZC1A--3h8ojZJL5pog__&Key-Pair-Id=APKAIE5G5CRDK6RD3PGA)
![Schematic overview of [13C5,15N2]glutamine stable isotope tracings. (A) Tracing using [13C5,15N2]glutamine includes glutaminolytic and Krebs cycle pathways before (time 0) and 5 minutes after incubation with 1 µM fMLF. (B) Tracing using [13C5,15N2]glutamine in control and patient neutrophils before and after treatment with fMLF. The isotopologue intensities plotted correspond to labeling indicated in panel A (eg, 13C5,15N2 for Gln).](https://ash.silverchair-cdn.com/ash/content_public/journal/bloodadvances/4/23/10.1182_bloodadvances.2020002225/3/m_advancesadv2020002225f6.png?Expires=1769618867&Signature=QNmdKg5H1jMr~hqGJcoKrHz9GJRD7lrubjDF3zuoWMSaIZJFOGDwUFQPLSSI1-9PMqXqEqdiOOZRKfjHiJcyCqHfo20T1ocpe6xzBJpKt-kMHspZiy0GETEE5HR2LR-4f0KPwLE2u~TYeRpgc~YsghlUhw6mO-zQnsURa5kGglGPIlbqu53WuKv4VVbmgp6wai90qvZqZ6xPfm-Wtrq9zghN8T8uHXTFuDQOOm3W5l87XB2jHom8MhI4xTXbdI58e~BnjU4B1p1vp3YfqtFvhVJHzotmRkwX6tn6NnI1cff9gtzbczs9VbXD4qlRlFxd~SnF~NftFROinLLCz0MRyg__&Key-Pair-Id=APKAIE5G5CRDK6RD3PGA)
![Metabolic and function results in the presence of fructose incubation. (A) Levels of lactate, RP, and GSH in control and patient neutrophils following a 10-minute incubation with [U-13C]fructose; samples are before (time 0) and 5 minutes after incubation with 1 µM fMLF. (B) Superoxide anion production by neutrophils preincubated with or without 5 mM fructose and stimulated with PMA. SOD-inhibitable total luminescence is presented as described in “Methods.” (C) Chemotaxis in response to fMLF after preincubation with and without 5 mM fructose. Percentage of fluorescently labeled cells migrating across the polyethylene terephthalate (PET) membrane into the lower wells with fMLF stimulus over time is presented.](https://ash.silverchair-cdn.com/ash/content_public/journal/bloodadvances/4/23/10.1182_bloodadvances.2020002225/3/m_advancesadv2020002225f7.png?Expires=1769618867&Signature=hvbKOzc1zo40~5dYjB1qW5eXzAOormTU8fvdAmdusXw5p3WgDGhNheQDFRcv8OVbv3IY2LeRZpZmAWkrZxTunjG6bxJMxXekFsCEYfD68ELK4LSm-p3eOSF2Y9If6ksstydLwFWKlbrCr8PlbEfss0~ea6my0fyod4gPkrC7jYeSLYiHZ20dqztJyu2F3xdmF5GkkP22Z~Yl4pHZpYDbjPZhIXakjekasM6tLgd1u5HRf5igGyVTiHlAkIdxHTuXC0govOeC0C1EPdasiu66~J-VqaFe7Jt-u65uqDb-b0ODOVfk8u3sQoGuUf7nt7ifzgmfYy8CC1xsFu69YlVMSA__&Key-Pair-Id=APKAIE5G5CRDK6RD3PGA)

![Schematic overview of [13C6]glucose stable isotope tracings. (A) Tracing using [13C6]glucose including glycolytic and HMS pathways. (B) Tracing using [13C6]glucose in control and patient neutrophils before (time 0) and 5 minutes after incubation with 1 µM fMLF. Isotopologue intensities plotted correspond to labeling indicated in panel A (eg, 13C6 for glucose).](https://ash.silverchair-cdn.com/ash/content_public/journal/bloodadvances/4/23/10.1182_bloodadvances.2020002225/3/m_advancesadv2020002225f5.png?Expires=1771214426&Signature=U~77hDCATrR4Abb2Yf5lvjPhfvQEz~IbTw8~Kf4P5NNjs3KhJjpoqULY9E0q4~J9nGoUH3erEjBXYbw-3HgILmjd9CGZWzgI8BBtJKLM4cA-fWno12HjAEL~JsEvG9jtCkzSkRy8TEmw9QvNdXJLI3uYCqnHCWq6XK~2H0Uh5aIQ2WEKKyYsihH9telx1X5ZpXr~QkJ7037VZLGKaZDqWJM5eIgcSw4mtfugXDlQNHY~QJmhzHCgQAVtl0r9YYeZoC8-XoqNdD0OrzY8kDLwk~HYsIQoSuqxI6xWBx0NQqmEhgCfZJN16rVkatP9BvItn5XbWAU4K-KUVw41Dm6LXw__&Key-Pair-Id=APKAIE5G5CRDK6RD3PGA)
![Schematic overview of [13C5,15N2]glutamine stable isotope tracings. (A) Tracing using [13C5,15N2]glutamine includes glutaminolytic and Krebs cycle pathways before (time 0) and 5 minutes after incubation with 1 µM fMLF. (B) Tracing using [13C5,15N2]glutamine in control and patient neutrophils before and after treatment with fMLF. The isotopologue intensities plotted correspond to labeling indicated in panel A (eg, 13C5,15N2 for Gln).](https://ash.silverchair-cdn.com/ash/content_public/journal/bloodadvances/4/23/10.1182_bloodadvances.2020002225/3/m_advancesadv2020002225f6.png?Expires=1771214426&Signature=DV7r7efpDpT40uCzXykVNWt9cvmfXsV0q3Rxq9vOcoYAO0kqTLLBmC7gMd0p~CzN4cWua1NOEnI6r-dRwEL5eobfgqu2Oh-AXcE-k66ZIxVuQmeJSvKUezu7ZLqtpUdSHPBMoAmUSHV0KHwtPxAZlmnUTwe3COnG7pXHnG~Y01On~xn~qeq8c436hK6cPyJXQCbPXuRL0maCabH0vVyQZ-cGG99dGla9lSo2t1ALTS8CcyMaZ-1cAfcRo0M6oqfZl9rZ5LIMiSZnMZiLsskAnmlx~vjsXn~Sragv~W3Al6j9eGeKSnsybEOARMEs7vyFRCsWJXI~FCPJWOr7QcCGsw__&Key-Pair-Id=APKAIE5G5CRDK6RD3PGA)
![Metabolic and function results in the presence of fructose incubation. (A) Levels of lactate, RP, and GSH in control and patient neutrophils following a 10-minute incubation with [U-13C]fructose; samples are before (time 0) and 5 minutes after incubation with 1 µM fMLF. (B) Superoxide anion production by neutrophils preincubated with or without 5 mM fructose and stimulated with PMA. SOD-inhibitable total luminescence is presented as described in “Methods.” (C) Chemotaxis in response to fMLF after preincubation with and without 5 mM fructose. Percentage of fluorescently labeled cells migrating across the polyethylene terephthalate (PET) membrane into the lower wells with fMLF stimulus over time is presented.](https://ash.silverchair-cdn.com/ash/content_public/journal/bloodadvances/4/23/10.1182_bloodadvances.2020002225/3/m_advancesadv2020002225f7.png?Expires=1771214426&Signature=y3CPdKdN9n574y~Y3zVwGOzP2XHARy6qiyjormii-cEPC~Uc3dBTmM2Bw6ApRJpWo8hEVzyuA3xzOI~uJWFQx29UTe9iaoglCAKIohtRVp5zbXozQlqRZ3fL-3nSGiWurFOXJOSHa3guOI3hTOMVifKeQdN77X3eYQaXSZHfABMQd0bzVP1penMZi1gSywDOrrfIuUVYIDSZUp8-8ht6wX~WraOBWyt4qurdnntHUYZCqiLz3rO7YNz47MrpbcSbWbo1y3xdH~wxz9yTAcSMr4Eh8iZ2c4TODWKhHNeFhibeVWETnnIP0hGger2ZGa45FMSJ5IAjvlG0M2nr2HqJeQ__&Key-Pair-Id=APKAIE5G5CRDK6RD3PGA)