Key Points
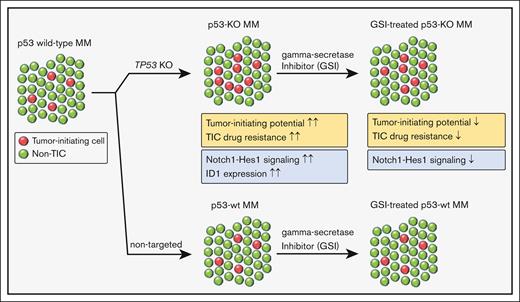
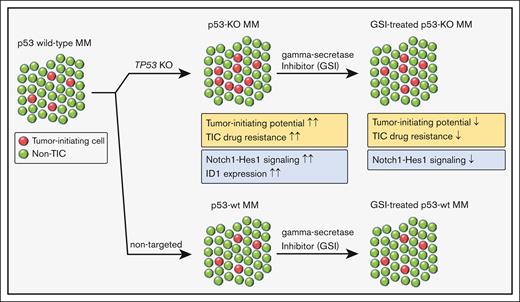
p53 loss increases the frequency and drug resistance of MM TIC.
Increased Notch signaling and ID1 expression enhance the clonogenic growth of p53-knockout cells.
Abstract
Tumor relapse and drug resistance are major factors that limit the curability of multiple myeloma (MM). New regimens have improved overall MM survival rates, but patients with high-risk features continue to have inferior outcomes. Chromosome 17p13 deletion (del17p) that includes the loss of the TP53 gene is a high-risk cytogenetic abnormality and is associated with poor clinical outcomes owing to relatively short remissions and the development of pan-drug resistant disease. Increased relapse rates suggest that del17p enhances clonogenic growth, and we found that the loss of p53 increased both the frequency and drug resistance of tumor-initiating MM cells (TICs). Subsequent RNA sequencing (RNA-seq) studies demonstrated significant activation of the Notch signaling pathway and upregulation of inhibitor of DNA binding (ID1/ID2) genes in p53–knock out (p53-KO) cells. We found that the loss of ID1 or HES-1 expression or treatment with a gamma-secretase inhibitor (GSI) significantly decreased the clonogenic growth of p53-KO but not p53 wild-type cells. GSI treatment in a small set of MM specimens also reduced the clonogenic growth in del17p samples but not in non-del17p samples. This effect was specific as overexpression of the Notch intracellular domain (NICD) rescued the effects of GSI treatment. Our study demonstrates that the Notch signaling and ID1 expression are required for TIC expansion in p53-KO MM cells. These findings also suggest that GSI may be specifically active in patients with p53 mutant MM.
Introduction
Multiple myeloma (MM) is characterized by the clonal expansion of plasma cells that can lead to anemia, renal failure, and bone disease. The development of novel agents with improved efficacy and safety over the last 2 decades has resulted in chronic and long-term tumor inhibition and significantly increased survival rates.1,2 However, MM remains incurable for most patients because of eventual relapse and the development of drug-resistant disease.
Overall survival rates in MM are heterogeneous and associated with recurrent chromosomal abnormalities. High-risk cytogenetic changes include chromosome 17p13 deletion (del17p) that is associated with decreased progression-free and overall survival rates compared with patients with low-risk cytogenetic abnormalities.3,4 The minimally deleted region of del17p spans the TP53 gene,5 and TP53-deletion portends a poor prognosis in MM.4,6-8 The incidence of TP53 deletion is 5% to 10% in newly diagnosed patients with MM but increases to 30% to 60% in the relapsed/refractory MM setting,3,9 suggesting that it is associated with increased clonogenic growth and self-renewal that leads to shorter remissions in advanced disease.
The loss of TP53 increases stem-cell functional properties in breast and colon cancer and the expansion of tumor-initiating cells (TICs) in acute myeloid leukemia.10-12 We generated isogenic pairs of TP53 wild-type (wt) and knockout cells and found that p53 loss enhances clonogenic MM growth and the drug resistance of TICs. We also found that the Notch signaling pathway and expression of inhibitor of DNA binding (ID) genes were upregulated in p53-KO MM cells, and knockdown of ID1 or HES1 or treatment with a gamma-secretase inhibitor (GSI) specifically impacted MM TICs. Therefore, Notch inhibition may provide a novel approach to high-risk p53 mutant MM.
Materials and methods
Cell lines and cell culture
The human MM cell lines MM.1S, MM.1R, and NCI-H929 were purchased from the American Type Culture Collection. KMS11 cells were from the Japanese Collection of Research Bioresources (National Institutes of Health Sciences, Kawasaki, Japan). MOLP8 cells were from the German Collection of Microorganisms and Cell Cultures. All cell lines were independently authenticated using short tandem repeat profiling and tested for mycoplasma using polymerase chain reaction (PCR). Complementary DNAs (cDNAs) from wild-type TP53 MM.1S, MM.1R, MOLP8, and NCI-H929 cells were sequenced to verify whether the coding sequence of TP53 were indeed wild-type.
Cell lines were cultured in complete media consisting of high glucose RPMI media (Invitrogen) supplemented with 10% fetal bovine serum (Sigma-Aldrich), 1% penicillin-streptomycin (Invitrogen), and 1% L-glutamine (Invitrogen). For drug treatment, cells were treated with bortezomib, dexamethasone, lenalidomide (Sigma), melphalan (MP Biomedicals), nutlin-3a (Cayman Chemical), or the GSI LY3039478 (Selleck Chem) for 72 hours followed by quantification of colony formation and cell proliferation (Cell Proliferation Kit I [MTT]; Sigma).
Cell lines were generated using plasmids listed in supplemental Table 1. p53 knockout (p53-KO) and scrambled control (Scr) MM1.S, MM1.R, MOLP8, and NCI-H929 cells were generated using lentiviral vectors (LentiCRISPR_v2 113; Addgene) expressing CRISPR-Cas9 and TP53-targeted or nontargeted scrambled guide-RNAs (supplemental Table 2). Single-cell p53-KO clones were expanded under puromycin selection, and the deletion was validated by sequencing a genomic PCR amplicon across the edited locus (supplemental Table 2). p53 was overexpressed (p53-OVX) in KMS11 cells using the pLVX-IRES-mCherry plasmid (Clontech) containing the p53 cDNA from pLenti6/V5-p53 (Addgene).
For short hairpin RNA (shRNA) knockdown (KD) studies, shRNA sequences (supplemental Table 2) were selected based on The RNAi Consortium library (Sigma) and cloned into the pLKO.1-blast or pLKO.1-mCherry lentiviral vectors (Addgene). shRNA KD cells were selected using blasticidin or sorted using BD FACS Aria (BD Biosciences). For Notch intracellular domain (NICD) overexpression, the NICD fragment (from TetO-FUW-NICD; Addgene) was cloned into the pINDUCER21 (Addgene) lentiviral vector, then transfected into MM.1S p53-KO cells. Green fluorescent protein (GFP)–positive cells were sorted by BD FACS Aria.
Clinical specimens
Clinical bone marrow samples were obtained from patients with MM who gave informed consent, in accordance with the Declaration of Helsinki and as approved by the Johns Hopkins Medical Institutes Institutional Review Board. Bone marrow mononuclear cells were isolated by density centrifugation (Ficoll-Paque; GE Healthcare), and plasma cells were isolated using anti-CD138 magnetic microbeads (Miltenyi Biotec). Gamma-secretase inhibitor GSI-1814 was provided as a gift from Yue-Ming Li at Memorial Sloan Kettering Cancer Center. The clinical samples were treated with 2uM GSI-18 or its vehicle for 96 hours followed by quantification of colony formation.
Colony formation assay
Tumor colony formation in methylcellulose was carried out as previously described.15,16 Cells were seeded at a density of 100 000 cells/mL in complete media, expanded over 3 days to reach a density of approximately 500 000 cells/mL, and then plated as 1000 cells in 1 mL of 1.2% methylcellulose containing 10% FBS, 1% BSA, 10–4 M 2-mercaptoethanol, and 2 mM L-glutamine. Colonies consisting of >40 cells were scored using an inverted microscope 8 to 12 days after plating. Methylcellulose cultures assessing clinical MM colony formation also contained 10% lymphocyte conditioned media as a source of growth factors.17 For serial replating studies, colonies were harvested, washed twice with complete media, and then replated (1000 cells) in methylcellulose as above.
Gene expression profiling
Total RNA was extracted from MM.1S Scr and 3 distinct p53-KO clones (A7, B6, B12) with the Quick-RNA Miniprep Plus Kit (Zymo Research). RNA library preparation, messenger RNA (mRNA) sequencing, and bioinformatics analysis were conducted by Novogene. RNA-seq raw and processed data are available from NCBI Gene Expression Omnibus at GSE217769. The volcano plot of differential expression of genes was defined as adjusted P value < .05 and |log2(FoldChange)| > 1. Gene Ontology and Kyoto Encyclopedia of Genes and Genomes pathway enrichment were generated using the Novogene standard pipeline, and a second independent pathway analysis was done with the not just another heatmap (NOJAH) pipeline.18 RNA-seq output was used to filter and analyze the data set. Gene count values were converted to counts per minute, which was then log10 transformed. The genes were filtered based on interquartile range, with a percentile cutoff >99.6% applied to the 25 716 genes. The filtered data set that was used as input into heatmap construction included 235 genes. Upon normalizing the data by z-score and scaling by rows, a heatmap was generated based on Manhattan distance and Ward clustering. Pathway analysis was performed on genome-wide gene clusters shown to separate the conditions. The gene expression-profiling data sets are summarized in supplemental Data.
Flow cytometry
Cells were washed, stained with fluorescein isothiocyanate (FITC)–conjugated mouse antihuman CD138 (BD Pharmingen), and then washed and resuspended in staining buffer (PBS, 0.2% BSA) containing 0.1 ng/mL propidium iodide (PI; Sigma). Cells were analyzed using an Aurora Spectral Flow Cytometry (Cytek Biosciences). Cells were initially gated to exclude PI-positive cells and then analyzed for CD138 expression. For aldehyde dehydrogenase (ALDH) staining, cells were stained with the Aldefluor reagent (Stem Cell Technologies) according to the manufacturer’s protocol. ALDH-positive cells were quantified based on control cells stained with Aldefluor in the presence of diethylaminobenzaldehyde (DEAB). Data analyses were done by FlowJo Software (BD Biosciences).
Quantitative real-time PCR
Total RNA was extracted using the RNeasy Plus Mini Kit (Qiagen) and reverse-transcribed with SuperScript III reverse transcriptase (Invitrogen). qRT-PCR was performed using TaqMan probe against ACTB (Hs99999903_m1), HES1 (Hs00172878_m1), JAG1 (Hs01070032_m1), and NOTCH1 (Hs01062014_m1) with the TaqMan Universal PCR Master Mix (Applied Biosystems) or oligonucleotides of primer pairs with SYBR Select Master Mix (Applied Biosystems) on the CFX384 Real-Time PCR Detection System (Bio-Rad). Data analyses were done by CFX Maestro software (Bio-Rad), and quantitative calculations were performed using the ΔΔct method.
Western blot analysis
Whole-cell lysates were prepared using prechilled Mammalian Protein Extraction Reagent (M-PER; Life Technologies), cleared by centrifugation, and then separated by electrophoresis using Mini-PROTEAN TGX Stain-Free Gels (Bio-Rad). After semidry transfer using the Trans-Blot Turbo Transfer System (Bio-Rad), 0.2 um polyvinylidene fluoride membranes (Millipore) were blocked using 5% w/v BSA, 1× TBS, and 0.1% Tween-20, and incubated with primary antibodies (supplemental Table 3) followed by HRP-conjugated secondary antibodies. Blots were developed using the Clarity Western enhanced chemiluminescence substrate (Bio-Rad), and then imaged with the ChemiDoc Imaging System (Bio-Rad) and quantified using Image Lab software (Bio-Rad).
Single-cell clonal assay
Single cells were seeded into individual wells of 96-well plates and confirmed by light microscopy. Cells were cultured for 2 weeks and evaluated for clonal expansion (>128 cells) by microscopy. The frequency of wells with clonal expansion are provided.
Statistical analysis
Data are represented as mean ± standard error of the mean, ∗P < .05, ∗∗P < .01, and ∗∗∗P < .001. Statistical differences between 2 groups were analyzed using a 2-tailed, paired t test or multiple comparisons with uncorrected Fisher least significant difference test in 1-way analysis of variance (GraphPad Prism software). P values <.05 were considered significant.
Results
p53 loss enhances the clonogenic growth of MM cells
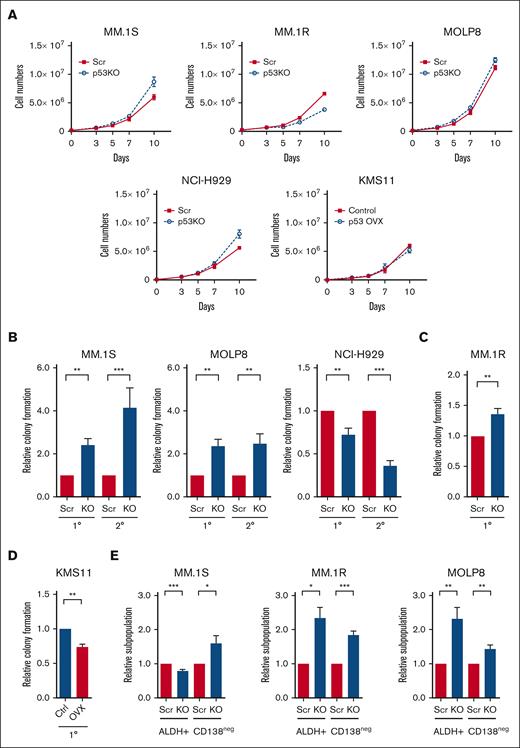
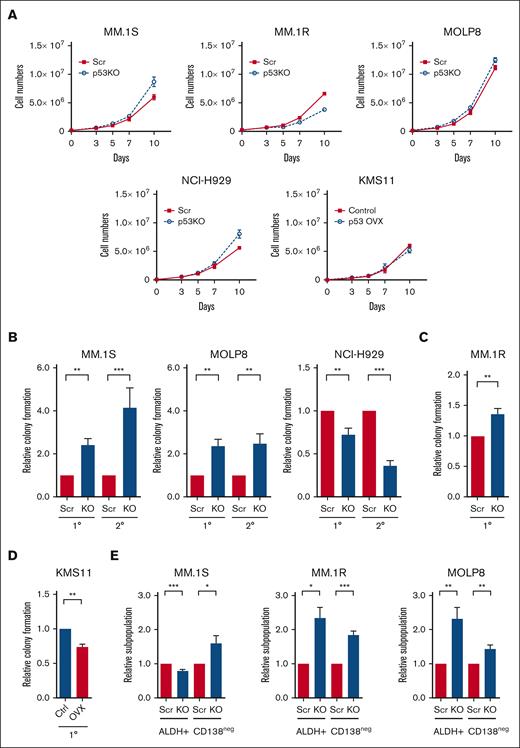
To investigate the molecular and cellular impact of p53 loss, we knocked out the TP53 gene (p53-KO) in MM.1S, MM.1R, MOLP8, and NCI-H929 human MM cells using the CRISPR-Cas9 system as well as isogenic control cells (p53-wt) with nontargeting scrambled guide RNAs (Scr).13 Multiple p53-KO clones were established and the loss of p53 was confirmed by western blot (supplemental Figures 1A-C). The expression of the p53 targets p21CIP1, MDM2, MDM4, PUMA, and NOXA were reduced in p53-KO compared with that of p53-wt cells (supplemental Figure 1C). The loss of p53 also limited the induction of p21CIP1 after treatment with nutlin-3a, a MDM2 inhibitor and p53 stabilizer, and the alkylator melphalan (supplemental Figure 1D). The levels of BCL2-Associated X Protein (BAX) were not strongly associated with p53 loss or treatment with nutlin-3a (supplemental Figures 1C, D). The percentage of cells in S-phase was significantly increased in NCI-H929 p53-KO cells suggesting disruption of p53-dependent G1/S checkpoint (supplemental Figure 2A), but only minor changes in cell proliferation were seen in all cell lines examined (Figure 1A).
Loss of p53 enhances the tumor-initiating potential of MM cells. (A) Growth curves of p53-wt (Scr) and p53-KO MM.1S, MM.1R, MOLP8, NCI-H929, and KMS11 cells (n = 3). (B) Primary (1°) and secondary (2°) colony formation of p53-wt (Scr) and p53-KO MM.1S, MOLP8, and NCI-H929 cells (n = 5). (C) Colony formation of p53-wt (Scr) and p53-KO MM.1R cells (n = 3). (D) Colony formation of p53-null KMS11 (Ctrl) and KMS11 p53-overexpression cells (n = 3). (E) Frequency of CD138neg and ALDH+ cells within Scr and p53-KO MM.1S, MM.1R, and MOLP8 cell lines by flow cytometry (n = 6).
Loss of p53 enhances the tumor-initiating potential of MM cells. (A) Growth curves of p53-wt (Scr) and p53-KO MM.1S, MM.1R, MOLP8, NCI-H929, and KMS11 cells (n = 3). (B) Primary (1°) and secondary (2°) colony formation of p53-wt (Scr) and p53-KO MM.1S, MOLP8, and NCI-H929 cells (n = 5). (C) Colony formation of p53-wt (Scr) and p53-KO MM.1R cells (n = 3). (D) Colony formation of p53-null KMS11 (Ctrl) and KMS11 p53-overexpression cells (n = 3). (E) Frequency of CD138neg and ALDH+ cells within Scr and p53-KO MM.1S, MM.1R, and MOLP8 cell lines by flow cytometry (n = 6).
TP53 deletion is associated with shorter progression-free survival in patients with MM,3,19 suggesting that the loss of p53 may enhance tumor-initiating potential. We found that colony formation by p53-KO MM.1S, MM.1R, and MOLP8 cells, but not NCI-H929 cells, increasing 1.3- to 2.4-fold compared with p53-wt cells (Figures 1B-C; P < .01). The increase in the tumor-initiating potential of p53-KO clones was not associated with changes in proliferation or cell survival (Figure 1A; supplemental Figure 2B). In addition, the enhanced clonogenic potential of p53-KO MM1.S and MOLP8 cells was maintained during serial replating, indicating enhanced MM self-renewal (Figure 1B; P < .01). We also conducted p53 gain-of-function studies by expressing p53 in p53null KMS11 cells and found that subsequent treatment with nutlin-3a led to the induction of P21CIP1 (supplemental Figure 2C). The restoration of p53 expression also significantly reduced colony formation by 26% compared with empty vector control cells (Figure 1D; P < .01).
We also examined the clonal expansion of single cells and found that the proportion of cells p53-KO MM.1S, MM.1R ,and MOLP8 cells capable of propagation was 1.1- to 1.6-fold higher than that of p53-wt cells (supplemental Figure 2D; P < .05). We previously demonstrated that MM cells lacking surface expression of CD138 (CD138neg) or exhibiting higher levels of ALDH activity (ALDH+) are enriched for clonogenic cells in vitro and TICs in vivo.16,20 We carried our flow cytometry and found that CD138neg and ALDH+ cells increased by 44% to 84% and 132% to 134%, respectively, in p53-KO MM.1R and MOLP8 cells (Figure 1E; P < .05). In MM1.S cells, the frequency of CD138neg cells increased by 60% and ALDH+ decreased by 20% in p53-KO cells (Figure 1E; P < .05). Taken together, the loss of p53 expression is associated with enhanced clonogenic growth and the expansion of phenotypically defined MM TICs.
p53 loss increases the drug resistance of clonogenic MM cells
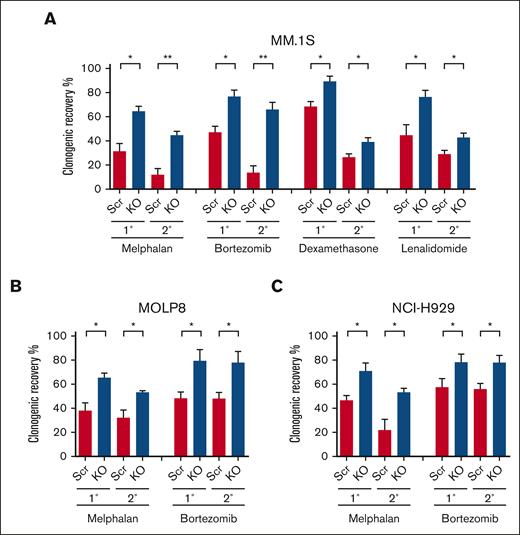
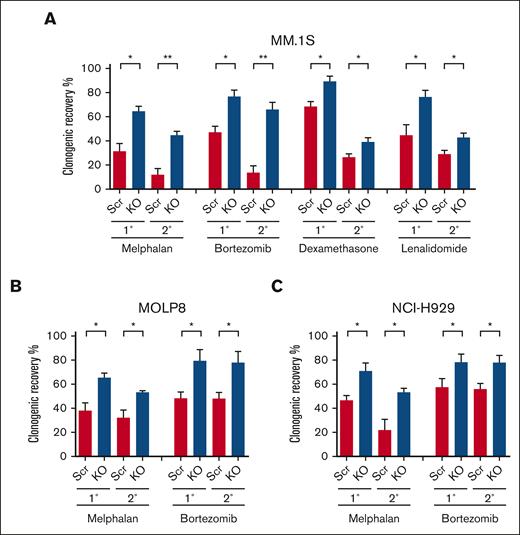
The loss of p53 is associated with the development of clinical drug resistance, and we previously demonstrated that clonogenic MM cells are relatively drug resistant.16 To examine the impact of p53 loss on the drug sensitivity or resistance of clonogenic MM cells, we treated p53-KO and p53-wt cells with melphalan, the proteasome inhibitor bortezomib, the corticosteroid dexamethasone, or the immunomodulatory drug lenalidomide. We found that the clonogenic recovery of p53-KO MM.1S, MOLP8, and NCI-H929 cells was significantly increased by 1.3- to 2-fold compared with that of p53-wt cells (Figures 2A-C; P < .05). Furthermore, this increased clonogenic recovery was maintained during serial replating (Figures 2A-C; P < .05). The increase in clonogenic recovery in p53-KO MM.1S and MOLP8 cells was associated with increased clonogenicity (Figure 1B; P < .01). Interestingly, although the clonogenicity in p53-KO NCI-H929 cells decreased (Figure 1B; P < .01), clonogenic recovery still increased (Figure 2C). Taken together, our data demonstrate that p53 loss led to increased drug resistance of clonogenic MM cells to all 4 agents.
Loss of p53 enhances the drug resistance of clonogenic MM cells. (A) Primary (1°) and secondary (2°) colony formation of MM.1S p53-wt (Scr) and p53-KO cells after treatment with melphalan (1 uM), bortezomib (1.5nM), dexamethasone (1.5 nM), or lenalidomide (62.5 nM) (n = 3). (B) Colony formation of p53-wt (Scr) and p53-KO MOLP8 cells with melphalan (1 uM) or bortezomib (5 nM) (n = 3). (C) Colony formation of p53-wt (Scr) and p53-KO NCI-H929 cells after treatment with melphalan (0.5 uM) or bortezomib (2 nM) (n = 3).
Loss of p53 enhances the drug resistance of clonogenic MM cells. (A) Primary (1°) and secondary (2°) colony formation of MM.1S p53-wt (Scr) and p53-KO cells after treatment with melphalan (1 uM), bortezomib (1.5nM), dexamethasone (1.5 nM), or lenalidomide (62.5 nM) (n = 3). (B) Colony formation of p53-wt (Scr) and p53-KO MOLP8 cells with melphalan (1 uM) or bortezomib (5 nM) (n = 3). (C) Colony formation of p53-wt (Scr) and p53-KO NCI-H929 cells after treatment with melphalan (0.5 uM) or bortezomib (2 nM) (n = 3).
Other studies using isogenic MM cell line models have demonstrated increased resistance of bulk MM cells to melphalan.21,22 We similarly found that the loss of p53 significantly enhanced the resistance of bulk MM.1S, MOLP8, and NCI-H929 cells to melphalan (supplemental Figure 3A). In contrast, there were no differences in the sensitivity of bulk p53-KO and p53-wt cells to bortezomib, dexamethasone, or lenalidomide (supplemental Figures 3B-C). Therefore, the loss of p53 differentially impacts the drug resistance of MM bulk tumor cells and TICs.
RNA-seq identifies notch signaling and ID proteins in p53-KO cells
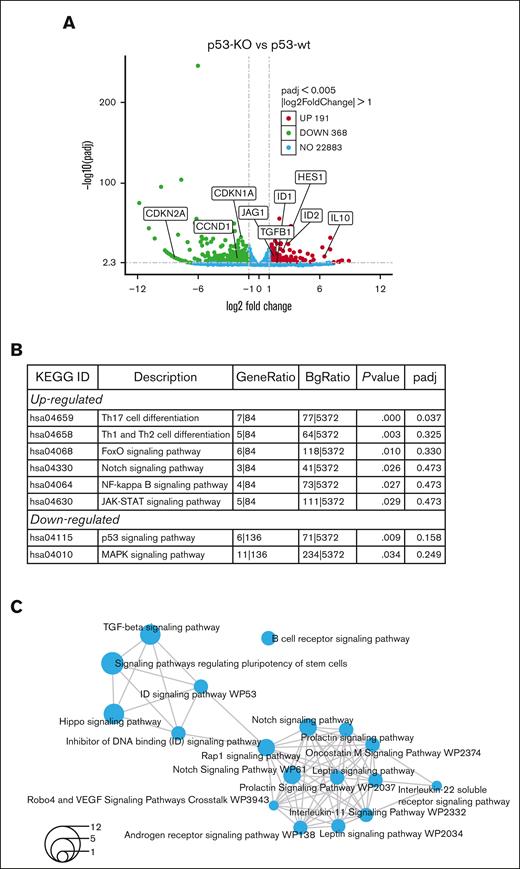
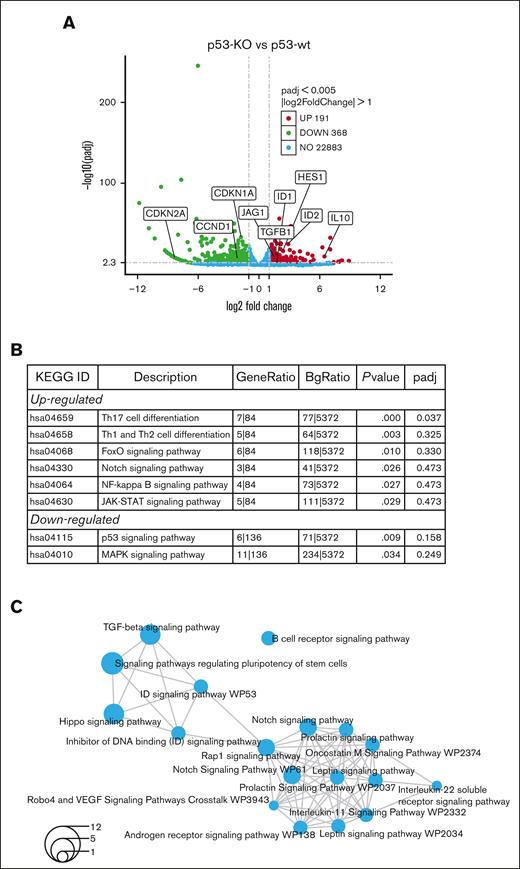
To investigate the mechanisms driving increased tumor-initiating potential in p53-KO cells, RNA-seq was performed in p53-wt and p53-KO MM.1S cells. We studied MM.1S because these cells had the greatest difference in clonogenic growth with the loss of p53 and identified 559 genes that were differentially expressed (Figure 3A; FC ≥ 2, FDR < 0.05) in p53-KO MM.1S cells, including 191 with significantly increased and 368 with decreased expression (supplemental Files). The Novogene bioinformatics pipelines identified FoxO, Notch, and NF-kappaB signaling among the top upregulated Kyoto Encyclopedia of Genes and Genomes enriched pathways (Figure 3B). We also found HES1 and JAG1 Notch signaling components as top-regulated genes in multiple stemness-related GO-enriched pathways (supplemental Figure 4A).
RNA-seq identifies Notch signaling in MM.1S p53-KO cells. (A) A volcano plot demonstrates upregulated (red), downregulated (green), no-change (blue) genes in p53-KO clones (A7, B6 and B12). (B) Top Kyoto Encyclopedia of Genes and Genomes enriched pathways from Novogene analysis in p53-KO cells. (C) Shared pathways among p53-KO clones from NOJAH analysis. Circle size corresponds to the number of genes associated with each pathway (refer to bottom left for scale).
RNA-seq identifies Notch signaling in MM.1S p53-KO cells. (A) A volcano plot demonstrates upregulated (red), downregulated (green), no-change (blue) genes in p53-KO clones (A7, B6 and B12). (B) Top Kyoto Encyclopedia of Genes and Genomes enriched pathways from Novogene analysis in p53-KO cells. (C) Shared pathways among p53-KO clones from NOJAH analysis. Circle size corresponds to the number of genes associated with each pathway (refer to bottom left for scale).
Analyses using NOJAH,18 a cluster-based next-generation sequencing pipeline designed for small sample sizes and to independently perform pathway analysis, identified 2 clusters from the input data set (supplemental Figure 4B). Cluster 1 (light blue) has a single Scr condition, whereas Cluster 2 (yellow) is defined by 3 p53-KO conditions. The 2 sample clusters were further defined by 2 distinct sets of genes, with Gene Cluster 1 (red) representing the p53-wt Scr cluster and Gene Cluster 2 (green) representing the 3 p53-KO samples (supplemental Figure 4B). Enrichment maps displayed networks of pathways associated with the 2 gene clusters (Figure 3C; supplemental Figure 4C). Notably, all pathways were unique between the 2 gene clusters. TGF-beta, Notch, ID, and Hippo signaling pathways were top candidates from p53-KO Gene Cluster 2 (Figure 3C). We also identified ID genes as top upregulated candidates in multiple pathways (supplemental Figure 4D). Finally, the Novogene and NOJAH pipelines both revealed enrichment of the Notch signaling pathway in p53-KO MM.1S cells (Figures 3B-C).
ID1 is required for increased clonogenicity in p53-KO cells
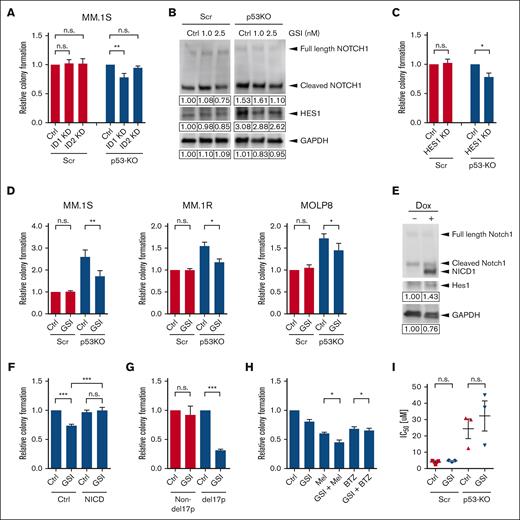
NOJAH analysis showed ID genes as top upregulated candidates, and the data from Database of Essential Genes demonstrate that ID1 and ID2 expression were increased 3.4- and 7.5-fold, respectively, in p53-KO cells (supplemental Files). Interestingly, ID1 expression has been associated with t(4;14) MM,23 and to determine the role of ID proteins in p53-KO MM cells, we knocked down the expression of ID1 and ID2 using shRNA (supplemental Figure 5A). Knockdown of ID1 significantly reduced the clonogenic growth of p53-KO MM.1S cells by 23% (Figure 4A; P < .01) but had no impact on p53-wt cells. Similarly, ID1 knockdown reduced the clonogenic growth of p53-KO MOLP8 cells by 14% (supplemental Figures 5B-C; P < .05) but had no impact on p53-wt cells. In contrast, ID2 knockdown did not affect colony formation by either p53-KO or p53-wt cells (Figure 4A). Therefore, ID1 is required for the increased clonogenicity in p53-KO, but not p53-wt, cells.
Notch1-Hes1 signaling is required for increased clonogenic growth and drug resistance of p53-KO MM TICs. (A) Colony formation of ID1-KD, ID2-KD, and nontargeting scramble (Ctrl)-treated p53-wt (Scr) and p53-KO MM.1S cells. (B) Western blot analysis of NOTCH1 and HES1 expression in p53-wt (Scr) and p53-KO MM.1S cells after treatment with a GSI. (C) Colony formation of HES1-KD and nontargeting scramble (Ctrl)-treated p53-wt (Scr) and p53-KO MM.1S cells (n = 4). (D) Colony formation of GSI-treated p53-wt (Scr) and p53-KO MM.1S, MM.1R, and MOLP8 cells (n = 4). (E) Western blot analysis of HES1 expression after doxycycline-induced Notch1 intracellular domain overexpression in p53-KO MM.1S cells. (F) Colony formation of Notch1 intracellular domain overexpressing p53-KO MM.1S cells after GSI treatment (n = 6). (G) Colony formation of GSI-treated clinical MM non-del17p samples (n = 6) and del17p samples (n = 3). (H) Colony formation of p53-KO MM.1S cells after treatment with GSI (2.5 nM) and melphalan (Mel, 1 uM) or GSI and bortezomib (BTZ, 1.5 nM) (n = 5). (I) Melphalan IC50 values of GSI-treated p53-wt (Scr) and p53-KO MM.1S cells (n = 3).
Notch1-Hes1 signaling is required for increased clonogenic growth and drug resistance of p53-KO MM TICs. (A) Colony formation of ID1-KD, ID2-KD, and nontargeting scramble (Ctrl)-treated p53-wt (Scr) and p53-KO MM.1S cells. (B) Western blot analysis of NOTCH1 and HES1 expression in p53-wt (Scr) and p53-KO MM.1S cells after treatment with a GSI. (C) Colony formation of HES1-KD and nontargeting scramble (Ctrl)-treated p53-wt (Scr) and p53-KO MM.1S cells (n = 4). (D) Colony formation of GSI-treated p53-wt (Scr) and p53-KO MM.1S, MM.1R, and MOLP8 cells (n = 4). (E) Western blot analysis of HES1 expression after doxycycline-induced Notch1 intracellular domain overexpression in p53-KO MM.1S cells. (F) Colony formation of Notch1 intracellular domain overexpressing p53-KO MM.1S cells after GSI treatment (n = 6). (G) Colony formation of GSI-treated clinical MM non-del17p samples (n = 6) and del17p samples (n = 3). (H) Colony formation of p53-KO MM.1S cells after treatment with GSI (2.5 nM) and melphalan (Mel, 1 uM) or GSI and bortezomib (BTZ, 1.5 nM) (n = 5). (I) Melphalan IC50 values of GSI-treated p53-wt (Scr) and p53-KO MM.1S cells (n = 3).
Notch1-Hes1 signaling is both necessary and sufficient for increased clonogenicity in p53-KO cells
Notch signaling is associated with stem cell features in several malignancies and is activated in MM.24-30 We confirmed our RNA-seq results and found that the expression of JAG1, NOTCH1, and HES1 were increased in p53-KO MM.1S, MM.1R, and MOLP8 cells by qRT-PCR (supplemental Figure 6A). In addition, NOTCH1 and HES1 were overexpressed (153% and 308%, respectively) in MM1.S cells by western blot (Figure 4B). To examine the role of Notch signaling in p53-KO MM cells, we knocked down the expression of HES1, the Notch pathway canonical effector, using shRNA (supplemental Figure 6B). Decreased expression of HES1 significantly inhibited the clonogenic growth of p53-KO MM.1S cells by 25% but had no impact on p53-wt cells (Figure 4C; P < .05). We also pharmacologically inhibited Notch-Hes1 signaling using LY3039478,31 a GSI that limits the formation of the NICD, and found that it significantly reduced Notch1 intracellular domain and HES1 expression in p53-KO MM1.S cells (Figure 4B) and colony formation compared with vehicle-treated cells (35% reduction; P < .01; Figure 4D). GSI treatment also significantly decreased the clonogenic recovery of p53-KO MM.1R and MOLP8 cells (21%-25% reduction; P < .05; Figure 4D). This effect of GSI was specific for Notch signaling as ectopic expression of Notch1 intracellular domain limited the inhibitory effect of LY3039478 (Figures 4E-F; P < .001). In addition, treatment of primary clinical MM bone marrow samples with GSI-1814 significantly reduced the clonogenic recovery of del17p samples by 69% but had no impact on non-del17p samples (Figure 4G; P < .001). Therefore, upregulation of the NOTCH signaling pathway enhances the tumor-initiating properties of p53-KO cells.
Notch signaling is required to support drug-resistant p53-KO clonogenic cells
Our initial findings suggest that the loss of p53 specifically leads to the drug resistance of MM TICs, and to determine the role of the Notch signaling pathway on resistance, we treated cells with combinations of GSI and chemotherapy. GSI significantly reduced the clonogenic recovery of p53-KO cells after treatment with melphalan or bortezomib (15% and 3%, respectively, P < .05; Figure 4H). In contrast, GSI treatment had no impact on the resistance of bulk p53-KO cells to melphalan (Figure 4I). Therefore, Notch signaling specifically impacts the drug resistance of p53-KO TICs but not of bulk MM cells.
Discussion
We generated isogenic MM cell lines and found that the loss of p53 enhanced tumor-initiating potential and self-renewal. Although p53 loss did not impact the sensitivity of bulk tumor cells to bortezomib, dexamethasone, or lenalidomide, the resistance of MM TICs was increased against all of these drugs that potentially explains the pan-drug resistance seen clinically in patients with del17p.3,19 Furthermore, RNA-seq analysis identified significantly increased expression of ID1 and ID2 and activation of the Notch signaling pathway with the loss of p53, and both ID1 and Notch1-Hes1 signaling were required for enhanced TIC potential in p53-KO MM cells. We also acknowledge that our studies may not be applicable to all cases of MM with p53 mutations, and other mutations of p53 may have other biological consequences.
In human cancers, the loss of p53 activity is pleiotropic and can lead to alterations in cell cycle checkpoints and abnormal cell proliferation.32 We found that the loss of TP53 had no impact on cell proliferation during short-term cell culture, but it is possible that p53 loss provides a long-term clonal advantage through increased clonogenic growth and self-renewal.33 Furthermore, increased TIC frequency was consistently observed in all p53-KO cell lines, including those without baseline changes, potentially explaining the increased incidence of del17p with relapse.
Our studies identified 2 mechanisms, increased ID1 expression and Notch signaling, that are responsible for the increased clonogenic growth of p53-deficient MM cells. A previous report identified ID1 overexpression in patients with high-risk t(4;14) MM,23 but its role in del17p MM remains unknown. ID1 and ID2 are known to regulate stemness in several malignancies,34-36 and we identified a role for ID1 in regulating the clonogenic capacity of p53-KO, but not p53-wt, MM cells. In neural stem cells, increased expression of ID proteins leads to HES1 expression,37 but additional studies are needed to understand the interaction between ID1 and HES1 in p53-KO MM cells. Although we found that changes in the expression of Notch pathway components were relatively small, similar changes can dramatically alter pathway signaling activity.38,39 Moreover, small changes in Notch signaling have been found to significantly impact stem cell properties in other cancers.40 Notch signaling is known to drive MM progression,24,25 but its role in del17p MM remains unknown. Notch-Hes1 signaling plays a crucial role in maintaining stemness in multiple malignancies,26-29 and our data demonstrate that Notch-Hes1 signaling is increased and contributes to the tumor-initiating potential of p53-KO MM cells. The upregulation of Notch-Hes1 signaling in the context of TP53 loss has been implicated in some cancer types,41,42 and p53 loss may drive Notch upregulation through changes in microRNA and epigenetic regulation.43,44 Further studies are required to determine whether these mechanisms regulate Notch1-Hes1 signaling in p53-KO MM. Importantly, our findings support the potential of targeting Notch1-Hes1 signaling, including the use of GSIs to selectively reduce the clonogenic growth and drug resistance of p53-KO cells.
Acknowledgments
The work was supported by National Institutes of Health grants R01CA150142 and R01CA193887 (W.M.).
Authorship
Contribution: Y.-T.C., I.C., J.L., K.R., and Q.W. performed experiments; Y.-T.C., I.C., Q.W., S.Y., and J.B. acquired and analyzed data; W.J. made the volcano plot; Y.-T.C. and W.M. designed the study; Y.-T.C. and J.B. wrote the manuscript; Y.-T.C., I.C., K.R., and W.M. edited the manuscript; and J.K.-M. and W.M. supervised the study.
Conflict-of-interest disclosure: The authors declare no competing financial interests.
Correspondence: William Matsui, Livestrong Cancer Institutes, Dell Medical School, The University of Texas at Austin, Health Discovery Bldg, 1601 Trinity St Bldg B, Mailstop Z1100, Austin, TX 78712; e-mail: william.matsui@austin.utexas.edu.
References
Author notes
RNA-seq raw and processed data are available from NCBI Gene Expression Omnibus at GSE217769. Data (in all other forms) are available on request from the corresponding author, William Matsui (william.matsui@austin.utexas.edu).
The full-text version of this article contains a data supplement.

