Key Points
Children with obesity frequently experience hepatotoxicity during ALL induction therapy.
Pretreatment lipid metabolites in the GPC pathway may identify patients at increased risk of hepatotoxicity.
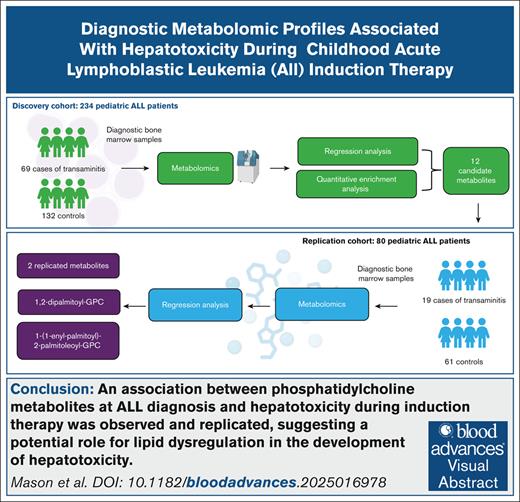
Visual Abstract
Hepatotoxicity is a well-documented complication of induction chemotherapy for acute lymphoblastic leukemia (ALL), but our understanding of its biological mechanisms is limited. We identified 314 patients with ALL (aged 1-19 years) treated at Texas Children’s Hospital (2008-2019) with diagnostic bone marrow plasma available for metabolomic profiling: 234 for discovery and 80 for replication. Hepatotoxicity during induction was defined as follows: (1) transaminitis: grade ≥3 aspartate aminotransferase or alanine aminotransferase or (2) conjugated hyperbilirubinemia: conjugated bilirubin (c.bili) >3 mg/dL. Untargeted profiling detected 519 metabolites. Adjusted odds ratios (aORs) for each metabolite were calculated with logistic regression, accounting for sex, age, body mass index, race/ethnicity, and treatment intensity. The population was 56% Latino, 57% male, 92% B-ALL, 25% overweight/obese, and 57% National Cancer Institute standard-risk at a median age of 5 years. Transaminitis was observed in 34% of the discovery and 24% of the replication cohort. Seven instances of c.bili >3 mg/dL were observed in the discovery cohort, with none in the replication cohort. Furthermore, 12 metabolites were associated with transaminitis (P < .05) in the discovery cohort, including 2 that replicated (P < .05): 1,2-dipalmitoyl-glycerophosphocholine (GPC) (aOR combined = 1.88 [95% confidence interval [CI], 1.26-2.79], P = .002) and 1-(1-enyl-palmitoyl)-2-palmitoleoyl-GPC (aOR combined = 1.56 [95% CI: 1.17-2.09], P = .003). In the discovery cohort, 34 metabolites were associated with c.bili >3 mg/dL, including the top association of 1,2-dipalmitoyl-GPC (aOR = 5.76 [95% CI: 2.20-23.16], P = .002). We observed and replicated associations between phosphatidylcholine metabolites at ALL diagnosis and hepatotoxicity during induction therapy, suggesting a potential role for lipid dysregulation in the development of hepatotoxicity.
Introduction
Acute lymphoblastic leukemia (ALL) is the most common pediatric malignancy, with ∼3000 children diagnosed in the United States each year.1 Induction is a critical treatment phase, during which children receive a drug regimen consisting of a glucocorticoid, vincristine, and asparaginase, with or without anthracycline.2-4 Early disease response with a deep remission after the induction phase is associated with a reduced relapse risk and better long-term survival from ALL.4 Unfortunately, treatment-associated hepatotoxicity (TAH) is a well-documented and common complication of induction chemotherapy.5,6 TAH often results in dose limitation and/or omission of curative chemotherapy, thereby adversely affecting disease response, risk of relapse, and survival.7 However, our understanding of the underlying mechanisms for TAH is limited.5,8,9 Obesity and older age at diagnosis have consistently been independently associated with increased risk of TAH.10-12 The effect of these risk factors seems to be amplified in those with Latino ethnicity.5,8,9,13-15 Obesity-associated metabolic changes in physiology, including insulin resistance, impaired glucose tolerance, dyslipidemia, and cardiovascular dysregulation,16 have been connected to hepatic injury in adults.17
Metabolomics involves the systematic identification and characterization of hundreds to thousands of metabolites present in biologic samples, including amino acids, carbohydrates, and lipids.18 Metabolomics techniques have been successfully used to investigate biomarkers of liver dysfunction in nonleukemia patients and early treatment response and treatment-related toxicities in patients with acute leukemia.19-21 Insights into the association of metabolome changes and development of TAH may generate hypotheses regarding the mechanisms of TAH and identify opportunities for prevention and intervention. The objective of this study was to leverage metabolomics technology to identify predictive biomarkers for hepatotoxicity in pediatric patients receiving induction chemotherapy for ALL.
Materials and methods
The cohort used for this analysis has been previously described.19 Briefly, we retrospectively identified 341 patients diagnosed with ALL before 18 years of age at Texas Children’s Hospital (Houston, TX) between 2008 and 2019. Eligible participants had cryopreserved bone marrow plasma samples collected at diagnosis and available for analysis. Metabolomic profiling was performed in 2 distinct batches, resulting in a discovery and a replication cohort. The discovery cohort consisted of 245 patients diagnosed between 2012 and 2019, and the replication cohort consisted of 96 patients diagnosed between 2008 and 2015.
Patients with missing outcome data for both conjugated hyperbilirubinemia and transaminitis (N = 11) were excluded from the discovery cohort. Patients with missing outcome data for transaminitis (N = 16) were excluded from the replication cohort. This resulted in a final sample of 314, with 234 in the discovery cohort and 80 in the replication cohort. Patient clinical and demographic information, including age at diagnosis, induction chemotherapy protocol and arm, sex, height and weight at diagnosis, and self-reported race and ethnicity, was abstracted from the electronic health record. Body mass index (BMI) z scores and percentiles were calculated from Centers for Disease Control and Prevention age- and sex-specific BMI growth charts for patients aged 2 to 20 years at diagnosis. Individuals were categorized as underweight (<5%), normal weight (5%-84.9%), overweight (85%-94.9%), or obese (95%) based on BMI percentile. Risk groups were defined by immunophenotype and the National Cancer Institute (NCI)-Rome criteria.22 Patients with NCI standard-risk B-cell ALL (age <10 years and white blood cells <50 × 103/μL at diagnosis) receive a 3-drug induction, and patients with NCI high-risk B-cell ALL (age ≥10 years and/or white blood count ≥50 × 103/μL) and all patients with T-cell ALL receive a 4-drug induction.
Liver laboratory results were assessed at diagnosis and day 1 of consolidation therapy, with additional time points collected at the discretion of the treating physician. Liver laboratories taken after initiation of antineoplastic chemotherapy were considered in outcome classifications. The primary end point for the planned analysis was transaminitis, based on the highest postdiagnosis value of either aspartate aminotransferase (AST) or alanine aminotransferase (ALT) available for each individual, graded according to the Common Terminology Criteria for Adverse Events version 4: grade 3 transaminitis if maximum AST or ALT >5 times to 20 times the institutional upper limit of normal and grade 4 transaminitis if maximum AST or ALT >20 times the upper limit of normal. In addition, we considered the secondary end point of conjugated bilirubin >3 mg/dL, a pragmatic threshold for which induction chemotherapy dose modification is required on contemporary ALL treatment protocols.
Metabolomic profiling
Bone marrow aspirates were collected before receipt of antineoplastic chemotherapy during routine standard of care. Samples were centrifuged with plasma collected and cryopreserved. Untargeted metabolomic profiling was conducted by Metabolon (Metabolon, Inc, Morrisville, NC) using ultraperformance liquid chromatography tandem mass spectrometry as previously described.22 Stringent quality control procedures were performed at Metabolon. This included the analysis of several types of controls, including a pooled matrix sample to serve as a technical replicate, extracted water samples used as process blanks, and a cocktail of QC standards that were spiked into each sample. This allowed for instrument performance monitoring and assisted in chromatographic alignment. After quality assessment and control, retention time/index, mass-to-charge ratio, and spectral data were compared with a library of known metabolites to identify each compound detected in the samples. The relative abundances of identified compounds were autoscaled (median = 1), and missing values were set to the minimum of observed values for each metabolite.
Statistical analysis
Statistical analysis was performed in RStudio version 2023.09.0+463. Comparisons between categorical variable distributions in the discovery and replication cohorts were performed using χ2 and Fisher exact tests, and comparisons between the cohorts for the continuous age variable were preformed using a 2-sample t test. Multiple logistic regression was performed on covariate-only models that included age at diagnosis, sex, race/ethnicity, BMI z score at diagnosis, and NCI risk group classification to assess the potential for confounding. Logistic regression was performed on the discovery and replication cohorts for Common Terminology Criteria for Adverse Events grade ≥3 transaminitis and in the discovery cohort only for conjugated hyperbilirubinemia, adjusting for age, sex, race/ethnicity, and BMI z score. Metabolites with P < .05 and a confidence interval (CI) that excluded 1 were considered significant. Only metabolites detected in both the discovery and replication cohorts were evaluated in the replication cohort for transaminitis. Metabolites significant in both the discovery and replication cohorts with consistent directions of effect for transaminitis were considered replicated. Odds ratios (ORs) for each metabolite were generated through logistic regression. With a null value of 1, an OR >1.0 indicating increased relative abundances of the metabolite were associated with higher risk of hepatotoxicity and an OR <1.0 indicating decreased abundances were associated with higher risk of hepatotoxicity. Combined ORs were calculated through meta-analysis techniques using weighted averages of the logarithm of the 2 individual ORs.
Volcano plots and clustered heat maps were created to visually examine the data. For the volcano plots, each point represents a metabolite with the –log10P value plotted on the y axis and log odds on the x axis. Clustered heat maps display the relative abundances of metabolites across samples, allowing for the identification of clusters.
Multivariate dimensionality reduction analyses were performed to differentiate between classes of metabolites across hepatotoxicity conditions. A principal component analysis (PCA), an unsupervised method that aims to achieve unbiased dimensionality reduction, and a partial least-squares discrimination analysis (PLS-DA), a supervised method that incorporates class labels, were performed for each outcome.23
A quantitative enrichment analysis (QEA) was performed in MetaboAnalyst 5.0. QEA is a statistical method that assesses whether specific metabolic pathways are enriched in the data set. QEA can be used to compare metabolic pathways between different groups or conditions.24 In this study, it was used to identify metabolite sets altered in children with transaminitis or conjugated hyperbilirubinemia.25 This was done using a concentration table of relative abundances for all identified metabolites and a MetaboAnalyst 5.0 built in reference library. Additional QEAs for each outcome were performed separately for Metabolon classified lipids and nonlipid metabolites. A reference metabolite library containing 39 super chemical class metabolite sets was selected. Only metabolite sets containing at least 2 entries were used for the purposes of this analysis. Holm P values were assessed to account for multiple comparisons, using a significance of P < .05. Enrichment ratios were computed using a ratio of observed hits over expected hits.
All participants were treated on or according to Children’s Oncology Group frontline ALL protocols. The study protocol was reviewed and approved by the Institutional Review Board at Baylor College of Medicine.
Results
Discovery and replication cohorts
Diagnostic bone marrow plasma and hepatotoxicity data were available for 314 patients, 234 in the discovery cohort and 80 in the replication cohort (Table 1). In the discovery cohort, the median (range) age at diagnosis was 5 (1-19) years. The sample was 56% male, 58% Hispanic, and 26% overweight or obese. Approximately 95% were diagnosed with B-cell ALL, 40% of whom were categorized as NCI high risk. The incidences of transaminitis and conjugated hyperbilirubinemia in the discovery cohort were 35% and 3%, respectively. The χ2 and Fisher exact tests were performed on categorical variables, and a 2-sample t test was performed on continuous variables to compare the distribution of demographic characteristics in each cohort.
In the replication cohort, the median (range) age was 5 (1-17) years old. The distributions of sex, race, ethnicity, and BMI were comparable to the discovery cohort. The replication cohort had a higher proportion of cases with T-cell and NCI high-risk B-ALL (50%). Notably, the incidence of transaminitis was lower in this cohort (24%; P = .02) and there were no instances of conjugated hyperbilirubinemia.
In covariate-only models, age at diagnosis, risk group, and BMI z score were associated with transaminitis in the discovery cohort; none of the covariates were associated with transaminitis in the replication cohort nor conjugated hyperbilirubinemia in the discovery cohort.
Metabolomic profiling detected 869 metabolites in the discovery cohort and 865 in the replication cohort, with a total of 1215 metabolites detected. Of these, 519 metabolites were detected in samples from both cohorts. In the discovery cohort, the most common metabolites detected were lipids (47%) followed by amino acids (21%), xenobiotics (13%), nucleotides (7%), carbohydrates, cofactors, vitamins, and peptides (3%), and energy and partially characterized molecules (1%). When looking at only the 414 detected lipids, 38% were fatty acyls, 19% glycerophospholipids, 14% sphingolipids, 9% sterol lipids, 8% glycerolipids, 7% bile acids and derivatives, and 4%, 3%, and 0.2% other lipids, polyketides, and prenol lipids, respectively (supplemental Figure 1).
Metabolite associations with transaminitis
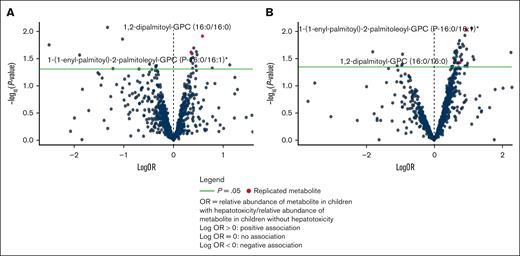
A total of 23 metabolites were associated with transaminitis in the discovery cohort. Of these, 12 were also detected in the replication cohort and 2 were associated with transaminitis: 1,2-dipalmitoyl-glycerophosphocholine (GPC) (adjusted OR [aOR] combined = 1.88 [95% CI: 1.26-2.79], P = .0019) and 1-(1-enyl-palmitoyl)-2-palmitoleoyl-GPC (aOR combined = 1.56 [95% CI: 1.17-2.09], P = .0026) in both cohorts. Logistic regression models for each replicated metabolite controlling for race/ethnicity, diagnostic age, sex, induction intensity, and BMI z score were assessed for performance using area under the receiver operating characteristic curve (AUC-ROC). Both models indicated moderate predictive ability, with an AUC of 0.751 for the model containing 1,2-dipalmitoyl-GPC (supplemental Figure 2) and 0.757 for the model containing 1-(1-enyl-palmitoyl)-2-palmitoleoyl-GPC (supplemental Figure 3).
In addition, 1-linoleoylglycerol (18:3), 1-linoleoylglycerol (18:2), 1-palmitoleoylglycerol (16:1), tetradecanedioate (C14-DC), hexadecanedioate (C16-DC), and gamma-tocopherol/beta-tocopherol were significant in the discovery cohort and in meta-analysis of the 2 cohorts, but not in the replication cohort (Table 2). PCA and PLS-DA analyses of the discovery cohort indicated global similarities between patients with and without transaminitis, but the conditions were distinguished by a limited number of metabolites (supplemental Figure 4).
Volcano plots (Figure 1) and clustered heat maps (supplemental Figures 5 and 6) were evaluated as a visual representation of the data.
Individual metabolites associated with TAH. Volcano plots for transaminitis metabolite associations in (A) the discovery cohort and (B) the replication cohort.
Individual metabolites associated with TAH. Volcano plots for transaminitis metabolite associations in (A) the discovery cohort and (B) the replication cohort.
Given the top replicated metabolites belonged to the GPC class, we evaluated all metabolites in this class in relation to transaminitis. Though the replicated GPCs had a positive association with risk of TAH, a volcano plot including all GPCs indicated an approximately equal distribution of positive and negative associations. Broadly, there does not appear to be an overall trend in the associations between relative abundances of GPCs and transaminitis (supplemental Figure 7).
Metabolite associations with conjugated hyperbilirubinemia
There were no patients with conjugated hyperbilirubinemia in the replication cohort; thus, the analysis of this secondary end point was performed in the discovery cohort only. Of 869 metabolites detected in this cohort, 34 were associated with conjugated hyperbilirubinemia postchemotherapy administration (supplemental Table 1). Seven of these metabolites were also significant in discovery cohort for transaminitis (Table 3). The PCA and PLS-DA analyses for conjugated hyperbilirubinemia indicated a modest discrimination between conditions, with the PLS-DA demonstrating a more distinct separation than the PCA (supplemental Figure 8).
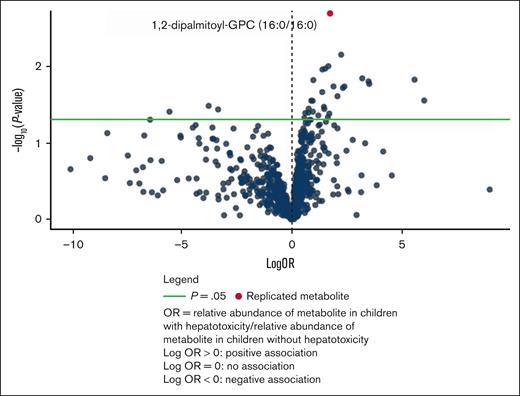
The top association was 1,2-dipalmitoyl-GPC (aOR = 5.76 [95% CI: 2.20-23.16], P = .002), which was also 1 of the 2 replicated metabolites for transaminitis (Table 3). The performance of a logistic regression model containing 1,2-dipalmitoyl-GPC for the conjugated hyperbilirubinemia outcome was also assessed using AUC-ROC. The model had a high predictive ability with an AUC of 0.985, but this also likely indicates an overfit model due to the rarity of conjugated hyperbilirubinemia (supplemental Figure 9). A volcano plot (Figure 2) and a clustered heat map (supplemental Figure 10) created as a visual representation of the data.
Volcano plot for conjugated hyperbilirubinemia metabolite associations in the discovery cohort.
Volcano plot for conjugated hyperbilirubinemia metabolite associations in the discovery cohort.
We also evaluated all metabolites in the GPC class and their associations with conjugated hyperbilirubinemia. A volcano plot including all GPCs demonstrated a negative trend, indicating that the replicated metabolite may have a unique effect (supplemental Figure 11).
Quantitative enrichment analysis
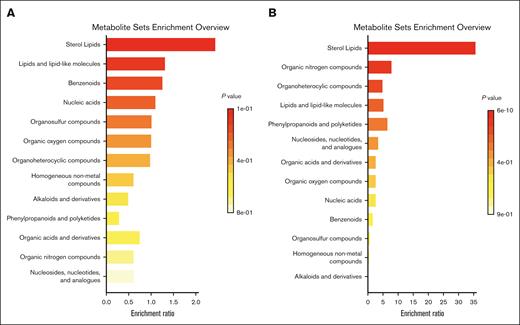
QEA did not identify enrichment of any metabolite sets among patients with transaminitis in the discovery cohort, though the most enriched class when evaluating all metabolites was sterol lipids. When separating lipids and nonlipid metabolites, the most enriched class for lipids remained sterol lipids, and the most enriched class for metabolites was lipid-like molecules, though neither achieved statistical significance (supplemental Figure 12). Several classes were enriched for conjugated hyperbilirubinemia, but the sterol lipids class was the most significantly enriched when evaluating all metabolites (Holm P = 7.4 × 10⁻⁹) (Figure 3). This was also the most enriched pathway in lipids only (Holm P = 2.8 × 10⁻⁹). In nonlipid metabolites only, the most enriched pathway was organic nitrogen compounds (Holm P = 6.3 × 10⁻⁷) followed by organoheterocyclic compounds (Holm P = 3.2 × 10⁻⁵) and lipid-like molecules (Holm P = .01), which was the most enriched class in the transaminitis analysis (supplemental Figure 13).
Metabolite super class enrichment. QEA for transaminitis (A) and conjugated hyperbilirubinemia (B) in the discovery cohort using 39 super chemical class metabolite sets.
Metabolite super class enrichment. QEA for transaminitis (A) and conjugated hyperbilirubinemia (B) in the discovery cohort using 39 super chemical class metabolite sets.
Discussion
We used an untargeted screening of the bone marrow plasma metabolome to identify potential biomarkers and mechanistic pathways involved in chemotherapy-acquired liver dysfunction during the initial induction phase of ALL therapy. We identified 2 GPC metabolites that were significantly associated with transaminitis in both the discovery and replication cohorts: 1-(1-enyl-palmitoyl)-2-palmitoleoyl-GPC and 1,2-dipalmitoyl-GPC. Notably, 1,2-dipalmitoyl-GPC was also the top metabolite associated with conjugated hyperbilirubinemia in the discovery cohort.
GPC metabolites have previously been associated with liver dysfunction and metabolic syndrome.26-28 In much of the existing literature, higher levels of GPCs are associated with decreased risk of liver disease.26,28 This differs from the significant, replicated metabolites in this study, which reveals an increased risk of hepatotoxicity with elevated 1-(1-enyl-palmitoyl)-2-palmitoleoyl-GPC and 1,2-dipalmitoyl-GPC. Notably, some studies collectively considered metabolites in super- or sub-pathways, which may obscure important associations and does not allow for the evaluation of individual metabolites.26,27 Furthermore, considering all GPCs detected in the discovery cohort, there was a trend toward an inverse association with conjugated hyperbilirubinemia. This is consistent with previous research and suggests that the associations found between the 2 GPCs highlighted in this study may be unique.
In support of this, Bajaj et al28 reported on 30 metabolites, including 12 individual GPCs, associated with Model for End-Stage Liver Disease (MELD) scores, which is a score used to characterize severity of liver disease, in adult patients with cirrhosis. Higher MELD scores indicate more severe disease. All reported GPCs were inversely associated with MELD scores, indicating a protective effect of higher abundances, except for 1,2-dipalmitoyl-GPC, which was positively associated with MELD scores. This is consistent with the increased risk associated with higher abundances of 1,2-dipalmitoyl-GPC we observed in this study, further suggesting that this particular GPC may have a unique impact. In addition, 7 of the top 30 metabolites in that study were also correlated with transaminitis at P < .10 and 11 were correlated with conjugated hyperbilirubinemia at P < .10 in this study. All these metabolites were consistent in direction in both studies.28 This suggests that metabolomic features linked with compromised hepatic function might be informative biomarkers for treatment-associated liver injury in pediatric ALL.
Obesity is a well-documented risk factor for TAH, highlighting the importance of controlling for BMI in our analysis. In this study, the detected metabolites were associated with TAH independently of BMI. This observation highlights the potential for metabolic dysfunction to play a role in this relationship independent of initial weight status. Weight status often changes rapidly after initiation of therapy, and treatment-induced metabolic changes are common.29,30 These may influence the risk of TAH, but this was outside of the scope of this study. More research is needed to assess any potential associations between treatment-related weight or metabolic changes and transaminitis or hyperbilirubinemia.
In Candi et al31 1,2-dipalmitoyl-GPC was significantly increased in metabolically unhealthy individuals with obesity when compared with otherwise metabolically healthy individuals with obesity. This supports the results of this study that increased levels of 1,2-dipalmitoyl-GPC may be an indication of lipid dysregulation independent of weight classification. Our QEA also revealed that sterol lipids were the most enriched class for both conjugated hyperbilirubinemia and transaminitis, though this was only statistically significant in the conjugated hyperbilirubinemia outcome. Despite lack of significance for transaminitis, our results suggest that lipid dysregulation may be implicated in the development of TAH.
Strengths of this study include its ethnically diverse and clinically well-annotated sample and the large number of detected metabolites. Still, it should be interpreted in light of several limitations. First, the small number of cases with hyperbilirubinemia limited power in the discovery analysis and prohibited us from evaluating these associations in the replication cohort. Owing to the study’s exploratory nature and limited sample size, we did not use statistical corrections for multiple comparisons in our multivariable regression models, though we did replicate findings concerning transaminitis to reduce the possibility of false positives. Despite its limited power, our work identified metabolites known to be associated with liver dysfunction.28 Second, untargeted metabolomic profiling is semiquantitative in that it produces relative abundances and not absolute abundances. In addition, although the bone marrow plasma samples used in this study may not reflect circulating biomarkers for all metabolites, previous research reveals a strong correlation between bone marrow plasma and blood lipid metabolites.19
This exploratory study presents several opportunities for future research. We used diagnostic bone marrow samples as they are routinely obtained as part of standard clinical care for children with ALL, but further correlation with end of induction bone marrow may be warranted to determine whether these associations hold in a remission sample. Further targeted lipidomic profiling is needed to confirm the results of this study and to evaluate lipids associated with hepatotoxicity that were not present in both cohorts. In addition, Halton et al32 observed significant therapy-related changes in lipid profiles in children with ALL treated with l-asparaginase, including increased triglycerides and reduced levels of lipoprotein(a). Longitudinal studies of blood lipids with real-time monitoring could provide a more complete picture of the role of lipid dysregulation in TAH.
The results of this study indicate a potential role of lipid dysregulation at diagnosis in the development of TAH in the first month of induction therapy in children being treated for ALL. We anticipate that these results may inform future research to identify at-risk patients and drug targets to reduce acute complications of modern ALL chemotherapy.
Acknowledgments
This work was supported, in part, by National Cancer Institute grants P20CA262733 (K.R.R. and P.J.L.), R56CA258856 (P.J.L.), UH3CA260607 (M.E.S. and M.M.G.), and R01CA272981 (A.L.B.), St. Baldrick’s Consortium grant 522277 (P.J.L. and K.R.R.), and Cancer Prevention and Research Institute of Texas grants RP210064 (M.E.S.), RP160771 (M.E.S.), RP210075 (J.M.S.), and RP230026 (A.L.B. and M.M.G.).
Authorship
Contribution: E.J.M., A.M.C., M.E.S., P.J.L., K.R.R., J.M.S., and A.L.B. designed the research; E.J.M., J.P.W., J.M.S., and A.L.B. analyzed the results; M.E.S., P.J.L., O.A.T., M.R., and A.C. acquired the data; M.E.S., P.J.L., K.R.R., M.M.G., J.M.S., and A.L.B. provided funding for the research; E.J.M., A.M.C., S.D.M., V.H., E.O., and A.L.B. drafted the manuscript; and all authors reviewed and edited the manuscript.
Conflict-of-interest disclosure: S.L.P. reports consulting fees from Pfizer and Gilead outside the present work. The remaining authors declare no competing financial interests.
Correspondence: Austin L. Brown, Department of Pediatrics, Center for Epidemiology and Population Health, Baylor College of Medicine, 1 Baylor Plaza, Houston, TX 77030; email: austin.brown@bcm.edu.
References
Author notes
E.J.M. and A.M.C. contributed equally to this work.
Presented in abstract form at the 56th Annual International Society of Pediatric Oncology Congress, Honolulu, HI, 17 to 20 October 2024.
Processed data used for this study were accessioned in Mendeley data (https://doi.org/10.17632/br223h8sdd.3). Annotated phenotype data are available on reasonable request from the investigators; please contact Austin L. Brown (austin.brown@bcm.edu) for the original data.
The full-text version of this article contains a data supplement.


