Key Points
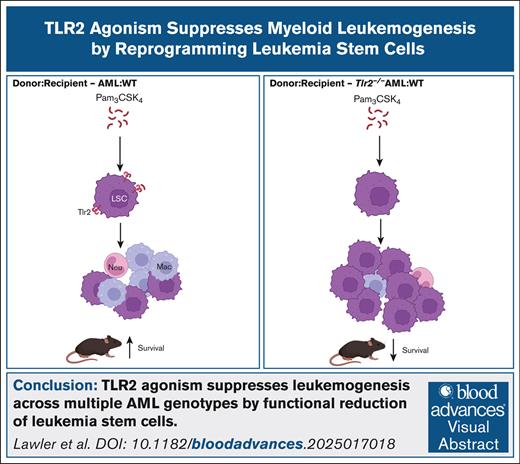
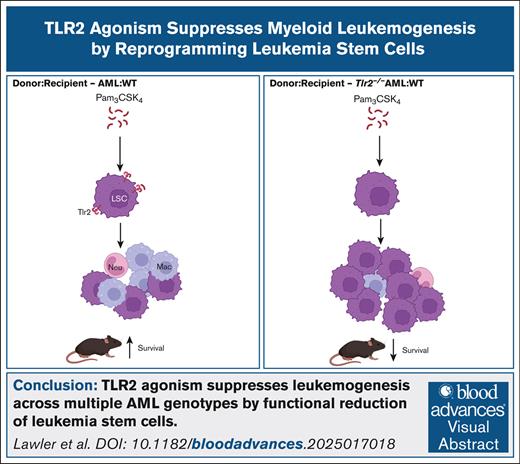
TLR2 agonism suppresses leukemogenesis across multiple AML genotypes by functional reduction of LSCs.
Diminished LSC function is associated with TLR2-mediated cell-intrinsic upregulation of MHC class II.
Visual Abstract
The consequences of activated innate immune signaling in acute myeloid leukemia (AML) is not well understood. Using ligands directed at the toll-like family receptors (TLR) in models of high-risk AML, we uncover that TLR2 ligands exert unique antileukemic effects that are distinct from other TLRs. Although TLR2 signaling broadly induces inflammatory gene expression in AML cells, at the single-cell level, cell-type–dependent, divergent transcriptional responses coordinate cellular outputs of proliferation, differentiation, cell death, and activation of immune cell function. TLR2 ligands were the only TLR agonists capable of extending survival of AML-bearing mice through leukemia stem cell (LSC) reprogramming that elevated major histocompatibility complex (MHC) class II surface expression and ultimately impaired self-renewal. We find that the coexpression of TLR2 and MHCII genes is associated with better overall survival in patients with AML, which is consistent with our observations of activated TLR2 signaling in mice. These data reveal functional TLR2 signaling critically antagonizes leukemogenesis and emphasizes a role for TLR2 agonism in AML.
Introduction
Acute myeloid leukemia (AML) is characterized by the accumulation of clonal myeloid progenitor cells with impaired differentiation into mature, innate immune cells including monocytes, granulocytes, and dendritic cells.1 As a result, patients with AML often suffer from symptoms of neutropenia and have difficulty fighting infections.2,3 To what extent infection-induced inflammation impacts AML cell–intrinsic and –extrinsic mechanisms of disease pathogenesis, is not understood.
Toll-like receptors (TLRs) are a large family of pattern recognition receptors expressed on a variety of cell types, including stem cells that are essential for the recognition of foreign microbes and endogenous stress response proteins. Upon TLR ligation, intracellular signaling results in cytokine release to promote inflammation and recruit T cells that kill damaged or infected cells recognized by expression of major histocompatibility complex (MHC) molecules. In the case of normal hematopoietic stem cells (HSCs), TLR activation induces rapid expansion of HSCs with myeloid-biased progenitor maturation, associated with reduced self-renewal and HSC exhaustion.4-13 Conversely, chronic inflammation mediated by TLR signaling in the context of human and murine models of clonal hematopoiesis (CH) and myelodysplastic syndrome (MDS) are thought to create a competitive advantage driving aberrant clonal expansion and disease progression.14-20 However, it is unclear if similar consequences of TLR activation occur in AML.
DNMT3A and FLT3 mutations are prevalent in AML and commonly co-occur in the poor-risk AML subgroup. DNMT3A and FLT3 have known roles in hematopoietic stem and progenitor cell (HSPC) biology and inflammatory signaling, making DNMT3A/FLT3-mutant AML an ideal system in which to dissect the functional consequences of TLR signaling on AML pathogenesis.20-22 We previously generated a mouse model of DNMT3A/FLT3-mutant AML (Dnmt3afl/flFlt3ITD/ITDMx1Cre,23 termed Dnm3a+/−Flt3ITD), which can be serially transplanted in immune-competent, syngeneic wild-type (WT) recipient mice.24,25 Using this model, we demonstrated that mice with Dnm3a+/−Flt3ITD AML are sensitive to chronic TLR7/8 agonism which prolonged overall survival (OS).25 In another report, ex vivo exposure of MLL-rearranged AML to TLR1/2 agonists extended disease latency upon transplantation into mice.26 In both studies, the long-term survival effects of TLR agonism were attributed to induction of AML differentiation and cell death. However, whether and how cell-intrinsic TLR signaling might influence the function of rare leukemia stem cells (LSCs) and/or cells within the bone marrow (BM) microenvironment were not investigated.
To evaluate these possibilities, we administered a panel of TLR agonists, based on the expression pattern of TLRs in human and murine AML, directed at TLRs 1, 2, 3, 4, 6, and 7 to leukemic mice. We longitudinally evaluated the effects of TLR agonism on AML maturation, stem cell function, and survival. All TLR agonists produced an initial wave of monocytic differentiation that returned to baseline within 2 weeks. Although TLR2 and TLR4 agonists induced rapid and uniform cell death across most AML cell types, only TLR2 agonism extended the survival of leukemic mice. Single-cell analyses revealed that TLR2-signaling induced inflammatory gene expression across the spectrum of AML cell types that resulted in varied cell outputs from proliferation, differentiation, and immune activation to apoptosis. The most immature LSCs exhibited TLR2-mediated transcriptional reprogramming with induction of interferon responses, antigen processing and presentation, and elevated MHC class II surface expression, whereas metabolic and cell-cycle programs were decreased resulting in abrogated self-renewal. Our data reveal new possibilities for the use of TLR2 agonism to combat AML.
Methods
Additional methods details can be found in the supplemental Methods.
Mice
All animal housing, breeding, and procedures were approved by and performed in compliance with the institutional animal care and use committee at Thomas Jefferson University (protocol number 01932). Dnmt3afl/fl;Flt3ITD/ITDMx1-Cre mice (referred to as Dnmt3a+/−Flt3ITD) were generated previously.23 As previously reported,23 mice are not treated with polyinosinic:polycytidylic acid (Poly(I:C)) to induce AML development, instead AML cells exhibit spontaneous deletion of at least 1 floxed Dnmt3a allele. Tlr2−/− mice27 (Jackson Laboratory product code 004650) were bred with Dnmt3afl/fl;Flt3ITD/ITDMx1-Cre mice. Tlr2−/−;Dnmt3afl/fl;Flt3ITD/ITDMx1-Cre (referred to as Tlr2−/−Dnmt3a+/−Flt3ITD) mice are not treated with poly(I:C) to induce AML development.
TLR agonist treatments
Sublethally irradiated CD45.1+ WT mice were transplanted with CD45.2+ AML cells isolated from moribund Dnmt3a+/−Flt3ITD or Tlr2−/−Dnmt3a+/−Flt3ITD mice. Peripheral blood was assessed 2 weeks posttransplant to ensure at least 70% CD45.2+ chimerism, and mice were treated intraperitoneally with a single dose of the indicated TLR agonists or phosphate buffered saline (PBS) control. TLR agonists: 100 μg Pam3CSK4 (InvivoGen), 100 μg Pam2CSK4 (InvivoGen), 10 μg lipopolysaccharide (LPS) (InvivoGen), 100 μg Poly(A:U) (InvivoGen), 100 μg Poly(I:C) (InvivoGen), or 70 μg R848 (InvivoGen). Blood, bone marrow, or other tissues were examined at 24 hours posttreatment unless otherwise indicated. CD45.1+ MLL-AF9 AML cells28 were transplanted into sublethally irradiated CD45.2+ WT mice, and 10 days later treated with Pam3CSK4 or PBS control.
LSC identification and function
Immunophenotypic HSCs (CD150+CD48−CD34−CD135− LSK), multipotent progenitor (MPP1) (CD150+CD48−CD34+CD135− LSK), or MPP2 (CD150+CD48−CD34+CD135− LSK) cells were sorted from moribund Dnmt3a+/−Flt3ITD mice (n = 4) and transplanted into sublethally irradiated CD45.1+ WT mice. Limiting cell dilution transplantation assays were performed to quantify the number LSCs after Pam3CSK4 treatment. CD45.2+ Lin−cKit+ AML cells were sorted from bone marrow of treated mice and cell dilutions were retransplanted into secondary CD45.1+ WT mice. LSC frequencies were estimated using extreme limiting dilution analysis (ELDA).28,29
CITE-seq (cellular indexing of transcriptomes and epitopes sequencing) analysis
Twenty-four hours after treatment, bone marrow cells were isolated, replicate mice were combined, and cells were stained and sorted for HSPC and mature AML populations. Sorted cells were stained with TotalSeq-A antibodies (supplemental Table 3) and processed using the Chromium Single Cell 3’ Reagent Kit v3.1 and Chromium Controller (10× Genomics) and sequenced on Illumina NovaSeq 6000. Data normalization, clustering, cell-type annotations, differential gene expression, gene set enrichment analysis (GSEA), transcription factor activity, and pseudotime analyses were performed using AltAnalyze or R.30-34
Human AML RNA and survival analyses
Results
High TLR2 expression is conserved across AML subtypes
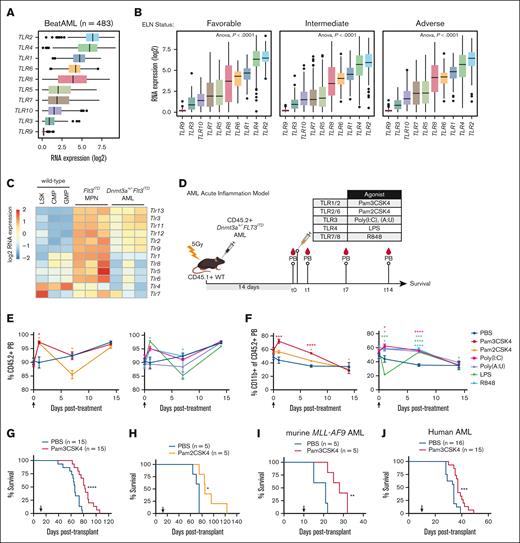
To describe clinically relevant TLRs in patients with AML, we interrogated published RNA sequencing data from newly diagnosed patients in the BeatAML functional genomics study cohort (n = 483).35 Although all 10 human TLRs are expressed in patients with AML, TLRs 2 and 4 are the most highly expressed (Figure 1A) regardless of European LeukemiaNet risk classification (Figure 1B), karyotype, or prognostically relevant driver mutations such as TP53, DNMT3A, and FLT3-ITD (supplemental Figure 1A-C). Analogous to the human disease, murine Dnmt3a+/−Flt3ITD AML23 cells express all 12 murine TLRs (Figure 1C), with surface expression of Tlr2 on the majority of cells (supplemental Figure 1D). Given that TLR2 is reproducibly expressed in human and murine AML, we focused on determining what role TLR2 signaling plays in leukemogenesis and contrasted this with the effects of other TLR outputs.
TLR2 expression and activation extends survival of AML-bearing mice. (A) Box plots of log2 RNA expression of TLR1-TLR10 in patients with AML (n = 483). (B) Box plots of log2 RNA expression of TLR1-TLR10 in patients with AML with DNMT3A, FLT3, or coincident DNMT3A/FLT3, or other mutations (n = 483). (C) Heat map of Tlr1-Tlr13 expression in cKit+ cells isolated from moribund Dnmt3a+/−Flt3ITD AML mice (n = 3) and age-matched Flt3ITD MPN (n = 3). WT mouse LSK, CMP, and GMP are shown as a normal baseline comparison. (D) Transplantation and treatment schematic for panels E-G. CD45.2+Dnmt3a+/−Flt3ITD AML cells transplanted into CD45.1+ WT recipient mice. Treatment was initiated 14 days after transplant. PB collection time points indicated “t” in days after treatment with indicated TLR agonists. (E) Average ± SEM percent CD45.2+Dnmt3a+/−Flt3ITD AML cells in PB from transplanted mice. Day 0 time point was immediately before treatment, then sampling at days 1, 7, and 15 after treatment with PBS, Pam3CSK4, Pam2CSK4, Poly(I:C), Poly(A:U), LPS, or R848 (n = 3/group). Arrow indicates agonist treatment. (F) Average ± SEM percent CD11b+ cells in CD45.2+Dnmt3a+/−Flt3ITD PB cells from transplanted mice. Day 0 time point was immediately before treatment, then sampling at days 1, 7, and 15 after treatment with PBS, Pam3CSK4, Pam2CSK4, Poly(I:C), Poly(A:U), LPS, or R848 (n = 3/group). Arrow indicates agonist treatment. (G) Kaplan-Meier survival curves of Dnmt3a+/−Flt3ITD AML-transplanted mice (n = 15/group) and treated with Pam3CSK4 or PBS control. Arrow indicates treatment on day 14 after transplant. (H) Kaplan-Meier survival curves of Dnmt3a+/−Flt3ITD AML-transplanted mice (n = 15/group) and treated with Pam2CSK4 or PBS control. Arrow indicates treatment on day 14 after transplant. (I) Kaplan-Meier survival curves of murine MLL-AF9 AML-transplanted WT recipients treated with 1 dose of Pam3CSK4 or PBS control. Arrow indicates time of treatment (n = 5/group). (J) Kaplan-Meier survival curves of human OCI-AML3 AML cells transplanted into NSG recipient mice treated with PBS (n = 16) or Pam3CSK4 (n = 15). Arrow indicates treatment on day 10 after transplant. Statistical significance by unpaired t test (E-F) or Kaplan-Meier log rank test (G-J). ∗∗∗∗P < .0001, ∗∗∗P < .001, ∗∗P < .01, ∗P < .05. SEM, standard error of the mean.
TLR2 expression and activation extends survival of AML-bearing mice. (A) Box plots of log2 RNA expression of TLR1-TLR10 in patients with AML (n = 483). (B) Box plots of log2 RNA expression of TLR1-TLR10 in patients with AML with DNMT3A, FLT3, or coincident DNMT3A/FLT3, or other mutations (n = 483). (C) Heat map of Tlr1-Tlr13 expression in cKit+ cells isolated from moribund Dnmt3a+/−Flt3ITD AML mice (n = 3) and age-matched Flt3ITD MPN (n = 3). WT mouse LSK, CMP, and GMP are shown as a normal baseline comparison. (D) Transplantation and treatment schematic for panels E-G. CD45.2+Dnmt3a+/−Flt3ITD AML cells transplanted into CD45.1+ WT recipient mice. Treatment was initiated 14 days after transplant. PB collection time points indicated “t” in days after treatment with indicated TLR agonists. (E) Average ± SEM percent CD45.2+Dnmt3a+/−Flt3ITD AML cells in PB from transplanted mice. Day 0 time point was immediately before treatment, then sampling at days 1, 7, and 15 after treatment with PBS, Pam3CSK4, Pam2CSK4, Poly(I:C), Poly(A:U), LPS, or R848 (n = 3/group). Arrow indicates agonist treatment. (F) Average ± SEM percent CD11b+ cells in CD45.2+Dnmt3a+/−Flt3ITD PB cells from transplanted mice. Day 0 time point was immediately before treatment, then sampling at days 1, 7, and 15 after treatment with PBS, Pam3CSK4, Pam2CSK4, Poly(I:C), Poly(A:U), LPS, or R848 (n = 3/group). Arrow indicates agonist treatment. (G) Kaplan-Meier survival curves of Dnmt3a+/−Flt3ITD AML-transplanted mice (n = 15/group) and treated with Pam3CSK4 or PBS control. Arrow indicates treatment on day 14 after transplant. (H) Kaplan-Meier survival curves of Dnmt3a+/−Flt3ITD AML-transplanted mice (n = 15/group) and treated with Pam2CSK4 or PBS control. Arrow indicates treatment on day 14 after transplant. (I) Kaplan-Meier survival curves of murine MLL-AF9 AML-transplanted WT recipients treated with 1 dose of Pam3CSK4 or PBS control. Arrow indicates time of treatment (n = 5/group). (J) Kaplan-Meier survival curves of human OCI-AML3 AML cells transplanted into NSG recipient mice treated with PBS (n = 16) or Pam3CSK4 (n = 15). Arrow indicates treatment on day 10 after transplant. Statistical significance by unpaired t test (E-F) or Kaplan-Meier log rank test (G-J). ∗∗∗∗P < .0001, ∗∗∗P < .001, ∗∗P < .01, ∗P < .05. SEM, standard error of the mean.
TLR2-specific acute inflammation extends survival of AML mice
Guided by our expression data, we assessed the effects of a select panel of receptor-specific TLR agonists on differentiation, leukemic progression, and OS in an immune-competent transplantation model of AML (Figure 1D). CD45.2+Dnmt3a+/−Flt3ITD AML23 were engrafted into CD45.1+ WT recipient mice and allowed to expand for 2 weeks reaching over 70% chimerism in peripheral blood (PB), at which point mice were administered a single dose of each TLR agonist or PBS control (Figure 1E-F, arrow). TLR agonists rapidly and transiently increased CD45.2+ leukemic cells in the periphery, predominantly associated with monocytic maturation (Figure 1E-F). By 14 days after treatment the PB of all agonist-treated mice were comparable to controls, despite some notable early responses for Poly(A:U) (TLR3) on AML expansion and LPS (TLR4) on AML maturation (Figure 1E-F). Importantly, only TLR2 agonists Pam3CSK4 (TLR1/2) and Pam2CSK4 (TLR2/6), significantly extended the survival of mice (Figure 1G-H; supplemental Figure 1E). The antileukemic effects of TLR2 signaling were not restricted to Dnmt3a+/−Flt3ITD AML, as Pam3CSK4 also significantly prolonged survival of mice harboring MLL-AF9 AML (Figure 1I) and NSG mice xenotransplanted with DNMT3A-mutant human AML cells (Figure 1J). Thus, TLR2 agonism enhanced survival across multiple AML models, highlighting its promising therapeutic potential.
TLR2-specific signaling controls AML progression
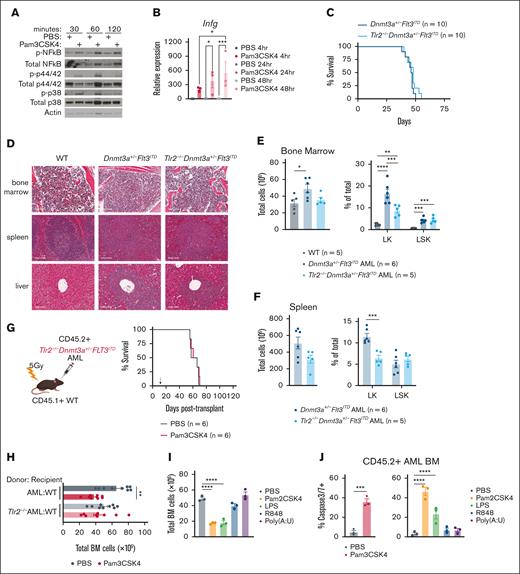
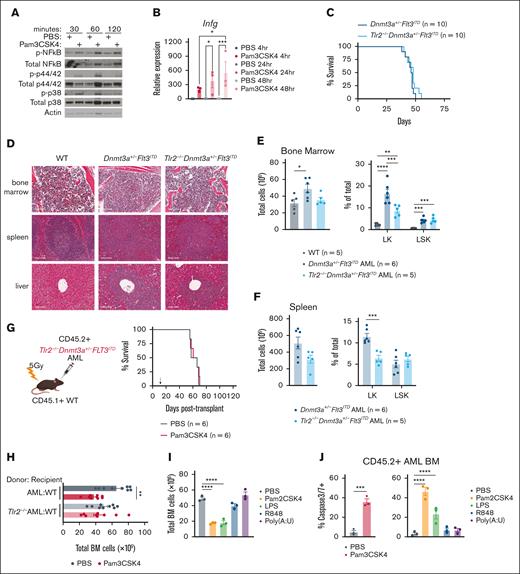
Given that TLR2 is expressed on a variety of cell types and TLR agonists can elicit paracrine and autocrine cytokine signaling, we first investigated whether TLR2 agonism activated the canonical Myd88/Irak/NF-κB pathway in AML cells.37-40 Pam3CSK4 induced rapid phosphorylation of NF-κB, p42/44, and p38 and transcriptional upregulation of Ifng in AML cells (Figure 2A-B). We next tested if cell-intrinsic Tlr2 was necessary for transformation, AML progression, and/or the antileukemic effects of Pam3CSK4. We crossed the Tlr2 germ line knockout (Tlr2−/−)27 into Dnmt3afl/flFlt3ITD/ITDMx1Cre mice.23 Like Dnmt3a+/−Flt3ITD controls, Tlr2-/-Dnmt3a+/−Flt3ITD mice developed fully penetrant lethal AML with similar latencies characterized by immature blasts in the bone marrow, spleen, and liver (Figure 2C-D). Compared to WT, both Dnmt3a+/−Flt3ITD and Tlr2−/−Dnmt3a+/−Flt3ITD mice possessed aberrant expansion of HSPCs with fewer committed progenitors in Tlr2-deficient leukemias as compared to Tlr2-proficient leukemias (Figure 2E-F). Dnmt3a+/−Flt3ITD and Tlr2−/−Dnmt3a+/−Flt3ITD AML cells generated equivalent diseases in secondary WT recipient mice (Figures 1G and 2G, PBS groups median survival 66 days and 62.5 days, respectively). Although Tlr2 is dispensable for the development and maintenance of AML driven by Dnmt3a and Flt3 mutations, it is required on AML cells for prolonged survival in response to Pam3CSK4 (Tlr2+/+AML + Pam3CSK4 median survival 82 days, Tlr2−/−AML + Pam3CSK4 median survival 64 days, P < .0001; Figures 1G and 2G). These data suggest that the primary target of TLR2 agonism is on the leukemic cells directly.
Cell-intrinsic requirements for Tlr2 expression in AML. (A) Western blot analysis of Tlr2 pathway (NF-κB, p42/44, p38) activation in response to Pam3CSK4 or PBS treatment in Dnmt3a+/−Flt3ITD AML cells. Treatments were performed in vitro for the indicated times. β-actin served as loading control. (B) Average ± SEM relative expression of Infg by RT-qPCR in response to Pam3CSK4 or PBS treatment in Dnmt3a+/−Flt3ITD AML cells. Treatments were performed in vitro for the indicated times (n = 3/group). (C) Kaplan-Meier survival curves of de novo Dnmt3a+/−Flt3ITD AML and Tlr2−/−Dnmt3a+/−Flt3ITD AML mice (n = 10/group). (D) Histopathology of BM, spleen, and liver sections from moribund de novo Dnmt3a+/−Flt3ITD AML and Tlr2−/−Dnmt3a+/−Flt3ITD AML or age-matched WT mice. (E) Average ± SEM total BM counts (left) and average ± SEM percent Lin−cKit+ (LK) and Lin−cKit+Sca1+ (LSK) (right) populations in BM from age-matched WT (n = 5) and moribund de novo Dnmt3a+/−Flt3ITD AML (n = 6) and Tlr2−/−Dnmt3a+/−Flt3ITD AML (n = 5) mice. (F) Average ± SEM (left) total SP counts and average ± SEM percent LK and LSK (right) populations in spleens from moribund de novo Dnmt3a+/−Flt3ITD AML (n = 6) and Tlr2−/−Dnmt3a+/−Flt3ITD AML (n = 5) mice. (G) Schematic (left) of CD45.2+Tlr2−/−Dnmt3a+/−Flt3ITD AML-transplanted mice into CD45.1+ WT recipient mice, treatment schematic in panel D. Kaplan-Meier survival curves (right) of Tlr2−/−Dnmt3a+/−Flt3ITD AML-transplanted mice (n = 6/group). Arrow indicates treatment on day 14 after transplant. (H) Average ± SEM total BM counts of Dnmt3a+/−Flt3ITD AML-transplanted WT recipients (AML:WT, n = 9/group) and Tlr2−/−Dnmt3a+/−Flt3ITD AML-transplanted WT recipients (Tlr2−/−AML:WT, n = 9/group) 24 hours after treatment with Pam3CSK4 or PBS control. (I) Average ± SEM total BM counts of Dnmt3a+/−Flt3ITD AML-transplanted WT recipients 24 hours after treatment with indicated TLR agonist or PBS control (n = 3/group). (J) Average ±SEM percent of cleaved caspase 3/7+ BM cells from Dnmt3a+/−Flt3ITD AML-transplanted WT recipients 24 hours after treatment with indicated TLR agonist or PBS control (n = 3/group). Statistical significance by ordinary 1-way analysis of variance (ANOVA) using Tukey multiple comparison test (B,E-F,H-I,J, right) or unpaired t test (J, left), or Kaplan-Meier log rank test (C,G). ∗∗∗∗P < .0001, ∗∗∗P < .001, ∗∗P < .01, ∗P < .05.
Cell-intrinsic requirements for Tlr2 expression in AML. (A) Western blot analysis of Tlr2 pathway (NF-κB, p42/44, p38) activation in response to Pam3CSK4 or PBS treatment in Dnmt3a+/−Flt3ITD AML cells. Treatments were performed in vitro for the indicated times. β-actin served as loading control. (B) Average ± SEM relative expression of Infg by RT-qPCR in response to Pam3CSK4 or PBS treatment in Dnmt3a+/−Flt3ITD AML cells. Treatments were performed in vitro for the indicated times (n = 3/group). (C) Kaplan-Meier survival curves of de novo Dnmt3a+/−Flt3ITD AML and Tlr2−/−Dnmt3a+/−Flt3ITD AML mice (n = 10/group). (D) Histopathology of BM, spleen, and liver sections from moribund de novo Dnmt3a+/−Flt3ITD AML and Tlr2−/−Dnmt3a+/−Flt3ITD AML or age-matched WT mice. (E) Average ± SEM total BM counts (left) and average ± SEM percent Lin−cKit+ (LK) and Lin−cKit+Sca1+ (LSK) (right) populations in BM from age-matched WT (n = 5) and moribund de novo Dnmt3a+/−Flt3ITD AML (n = 6) and Tlr2−/−Dnmt3a+/−Flt3ITD AML (n = 5) mice. (F) Average ± SEM (left) total SP counts and average ± SEM percent LK and LSK (right) populations in spleens from moribund de novo Dnmt3a+/−Flt3ITD AML (n = 6) and Tlr2−/−Dnmt3a+/−Flt3ITD AML (n = 5) mice. (G) Schematic (left) of CD45.2+Tlr2−/−Dnmt3a+/−Flt3ITD AML-transplanted mice into CD45.1+ WT recipient mice, treatment schematic in panel D. Kaplan-Meier survival curves (right) of Tlr2−/−Dnmt3a+/−Flt3ITD AML-transplanted mice (n = 6/group). Arrow indicates treatment on day 14 after transplant. (H) Average ± SEM total BM counts of Dnmt3a+/−Flt3ITD AML-transplanted WT recipients (AML:WT, n = 9/group) and Tlr2−/−Dnmt3a+/−Flt3ITD AML-transplanted WT recipients (Tlr2−/−AML:WT, n = 9/group) 24 hours after treatment with Pam3CSK4 or PBS control. (I) Average ± SEM total BM counts of Dnmt3a+/−Flt3ITD AML-transplanted WT recipients 24 hours after treatment with indicated TLR agonist or PBS control (n = 3/group). (J) Average ±SEM percent of cleaved caspase 3/7+ BM cells from Dnmt3a+/−Flt3ITD AML-transplanted WT recipients 24 hours after treatment with indicated TLR agonist or PBS control (n = 3/group). Statistical significance by ordinary 1-way analysis of variance (ANOVA) using Tukey multiple comparison test (B,E-F,H-I,J, right) or unpaired t test (J, left), or Kaplan-Meier log rank test (C,G). ∗∗∗∗P < .0001, ∗∗∗P < .001, ∗∗P < .01, ∗P < .05.
Activation of TLRs and other cell receptors of proinflammatory signals can initiate a variety of cell death mechanisms which might contribute to OS.41 Bone marrow cellularity was significantly decreased 24 hours after Pam3CSK4 treatment in a Tlr2-dependent manner (Figure 2H). Bone marrow cellularity was also reduced by Pam2CSK4 and LPS, but not Poly(A:U) or R848 (Figure 2I). Consistently, we observed an increase in AML apoptosis following TLR1/2 (Pam3CSK4), TLR2/6 (Pam2CSK4), and TLR4 (LPS) agonists, but not TLR3 or TLR7/8 agonists (Figure 2J). A similar trend in apoptosis was also observed in CD45.1+ WT bone marrow cells upon TLR1/2, 2/6, and 4 activation (supplemental Figure 1F). Although apoptosis of AML cells was an outcome of TLR2 and TLR4 agonism, it was not exclusively correlated with an increase in disease latency and OS since TLR4 ligand LPS failed to prolong survival (Figure 1G; supplemental Figure 1E). These data indicate additional antileukemic mechanisms uniquely signaled by TLR2 contribute to the survival benefit with TLR2 agonism. These data reveal that innate immune signaling has separable impact on leukemogenesis, dependent on the specific receptor/ligand, with TLR2 signaling playing a central role in restraining leukemogenesis.
TLR2 signaling drives AML cell transcriptional reprogramming
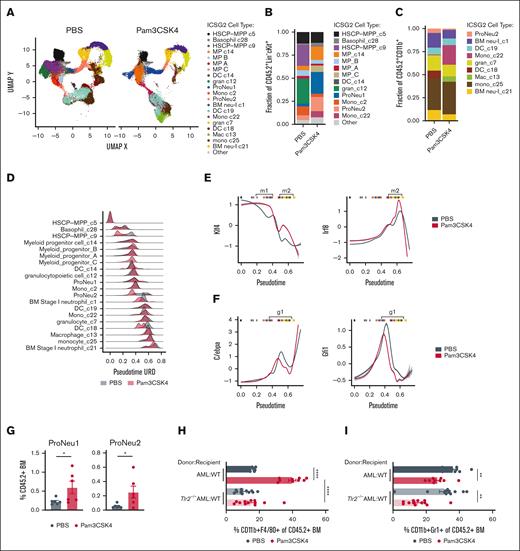
Murine Dnmt3a+/−Flt3ITD AML harbor remarkable cellular heterogeneity corresponding with varied clonogenic output.23 Therefore, to assess the responses to Pam3CSK4, we performed CITE-seq42 (supplemental Figure 2A). Using an unsupervised discovery workflow (ICGS2)31,43 we identified 21 transcriptionally distinct cell states, or clusters, in Dnmt3a+/−Flt3ITD AML isolated from treated mice (Figure 3A). The most immature HSPC-like clusters c5 and c9 expressed known stemness-associated genes including Mecom, Meis1, Hoxa9 and Cd34 (supplemental Figure 2B). Progenitor and more committed mature cells were similarly associated with lineage-defining marker genes: granulocytic c12, ProNeu1, and ProNeu2 (eg, Mpo, Ctsg, Elane, Gfi1), dendritic cell-like (DC-like) c18 and c19 (eg, Cx3cr1, Cbfa2t3), monocytic c22 and c25 (eg, Cebpb, Ly6c1/c2), and neutrophilic c7, c21, and c1 (eg, Mmp9, Cebpe, S100a8/a9) (supplemental Figure 2B,C). Both transcriptional signatures associated with stemness/differentiation and antibody-derived tag immunophenotyping supported these cell-type annotations (supplemental Figure 2D-F). We identified an increase in Sca1 protein expression across all AML stem/progenitor–like cell populations following Pam3CSK4 treatment, indicating a broad inflammatory response elicited by the ligand44,45 (supplemental Figure 2E). Of note, several clusters (c9, c12, c18) contracted following Pam3CSK4 treatment (Figure 3B-C). Meanwhile, myeloid progenitor clusters expanded through both cell-cycle dependent (multipotent progenitor [MP] C) and independent (c14) mechanisms (Figure 3B; supplemental Figure 3A).
TLR2 signaling induces AML cell transcriptional reprogramming. (A) UMAP projection of iterative clustering and guide-gene selection (ICGS2) of CD45.2+Dnmt3a+/−Flt3ITD AML cells single-cell RNA sequencing on sorted BM of transplanted CD45.1+ WT mice 24 hours after treatment with PBS or Pam3CSK4 (n = 2/group). Experimental schematic supplemental Figure 2A. (B-C) Fraction of cells in each cluster from sorted CD45.2+Lin−cKit+ cells (B) and CD45.2+CD11b+ cells (C). (D) Density plot depicting pseudotime (URD) on the x-axis and relative cell abundance on the y-axis. The density is scaled to total number of cells within a given cell type and treatment condition (PBS: gray, Pam3CSK4: red). (E-F) Transcription factor activity across pseudotime of Klf4 (left) and Irf8 (right) (E), C/ebpa (left) and Gfi1 (right) (F), in PBS (gray) and Pam3CSK4 (red) treatment groups. Vertical bars at the top of each graph indicate median pseudotime value for each cell-type pseudotime, to provide context for cell type (B-C). Bracketed pseudotime m1 and m2 indicate cell types with increased monocyte-specifying Klf4 and Irf8 activity and g1 indicates cell types with decreased granulocyte-specifying C/ebpa and Gfi1 activity in Pam3CSK4 treatment. (G) Average ± SEM percent proNeu1 (left) and proNeu2 (right) of CD45.2+Dnmt3a+/−Flt3ITD AML cells in WT recipient mice 24 hours after PBS or Pam3CSK4 treatment (n = 6/group). (H-I) Average ± SEM percent CD11b+F4/80+ (H) and CD11b+Gr1+ (I) of CD45.2+ BM. (H-I) Replicates for donor-recipient transplants include AML-WT (n = 9/group) and Tlr2−/−AML-WT (n = 12/group). Statistical significance was calculated by unpaired t test (G) and ordinary 1-way ANOVA using Tukey multiple comparison test (H-I). ∗∗∗∗P < .0001, ∗∗∗P < .001, ∗∗P < .01, ∗P < .05. BM neu, BM neutrophil; DC, dendritic cell; gran, granulocytic; HSCP, hematopoietic stem cell progenitor; Mac, macrophage; Mono, monocyte; MP, myeloid progenitor.
TLR2 signaling induces AML cell transcriptional reprogramming. (A) UMAP projection of iterative clustering and guide-gene selection (ICGS2) of CD45.2+Dnmt3a+/−Flt3ITD AML cells single-cell RNA sequencing on sorted BM of transplanted CD45.1+ WT mice 24 hours after treatment with PBS or Pam3CSK4 (n = 2/group). Experimental schematic supplemental Figure 2A. (B-C) Fraction of cells in each cluster from sorted CD45.2+Lin−cKit+ cells (B) and CD45.2+CD11b+ cells (C). (D) Density plot depicting pseudotime (URD) on the x-axis and relative cell abundance on the y-axis. The density is scaled to total number of cells within a given cell type and treatment condition (PBS: gray, Pam3CSK4: red). (E-F) Transcription factor activity across pseudotime of Klf4 (left) and Irf8 (right) (E), C/ebpa (left) and Gfi1 (right) (F), in PBS (gray) and Pam3CSK4 (red) treatment groups. Vertical bars at the top of each graph indicate median pseudotime value for each cell-type pseudotime, to provide context for cell type (B-C). Bracketed pseudotime m1 and m2 indicate cell types with increased monocyte-specifying Klf4 and Irf8 activity and g1 indicates cell types with decreased granulocyte-specifying C/ebpa and Gfi1 activity in Pam3CSK4 treatment. (G) Average ± SEM percent proNeu1 (left) and proNeu2 (right) of CD45.2+Dnmt3a+/−Flt3ITD AML cells in WT recipient mice 24 hours after PBS or Pam3CSK4 treatment (n = 6/group). (H-I) Average ± SEM percent CD11b+F4/80+ (H) and CD11b+Gr1+ (I) of CD45.2+ BM. (H-I) Replicates for donor-recipient transplants include AML-WT (n = 9/group) and Tlr2−/−AML-WT (n = 12/group). Statistical significance was calculated by unpaired t test (G) and ordinary 1-way ANOVA using Tukey multiple comparison test (H-I). ∗∗∗∗P < .0001, ∗∗∗P < .001, ∗∗P < .01, ∗P < .05. BM neu, BM neutrophil; DC, dendritic cell; gran, granulocytic; HSCP, hematopoietic stem cell progenitor; Mac, macrophage; Mono, monocyte; MP, myeloid progenitor.
Given the contraction and expansion of different cell populations, we reasoned that Pam3CSK4 treatment may result in transcriptional alterations that could confound cell-type annotation. To address this possibility, we performed pseudotime analysis rooted in the HSPC-MPP c5 cluster, allowing us to align cells and compare transcriptional responses along a continuum of cell states, and not strictly limited to paired cell-type comparisons (Figure 3D). The pseudotime order largely reflected the cell-type annotations. We identified 4 intervals that showed the highest pseudotime discordance following treatment encompassing the HSPC-MPP c9, ProNeu2, BM stage I neutrophil c1, and DC c18. The HSPC-MPP c9 and DC c18 clusters collapse in response to Pam3CSK4 treatment with the remaining few cells lower (earlier) in pseudotime (Figure 3B-D). This represents 2 clusters wherein the more mature cell states, which are highly sensitive to inflammation, may undergo either cell death or differentiation into downstream clusters. Alternatively, cells within ProNeu2 and BM stage I neutrophil c1 shift lower in pseudotime suggesting a shunting toward less-differentiated states (Figure 3D). Taken together, TLR2-mediated acute inflammation alters the transcriptional programs across the full spectrum of cell states within AML.
AML-autonomous TLR2 signaling promotes macrophage maturation and function
The reduction in granulocyte/neutrophil-like AML clusters c1, c7, and c21, expansion of monocyte clusters c22, c25, and emergence of c13 F4/80+ macrophage-like cluster by Pam3CSK4 (Figure 3B-C; supplemental Figure 2F) suggests that TLR2 promotes monocytic bias. To understand the molecular and cellular mechanisms driving this differentiation outcome, we compared pseudotime to inferred transcription factor activity by motif enrichment and flow cytometric immunophenotyping based on known cell surface markers. We identified increased activity of the monocyte specifying transcription factor Klf4 in immature AML cells (Figure 3E, m1, red vs gray), accompanied by a second wave of Klf4 and Irf8 activity induced by Pam3CSK4 in more mature macrophage-like AML cells (Figure 3E, m2, red vs gray) consistent with their development.46,47 Conversely, we observed decreased target gene expression of known neutrophil-specifying transcription factors C/ebpα and Gfi1 beginning at the ProNeu1 stage48,49 (Figure 3F, g1, red vs gray). These data suggest a granulocytic maturation bottleneck in myelomonocytic AML in response to TLR2 agonism. In line with this, immunophenotypic ProNeu1 and ProNeu2 AML cells expanded with Pam3CSK4 treatment50-52 (Figure 3G). However, expression of the critical neutrophil-specifying transcription factor Cebpe was significantly decreased at the ProNeu2 stage with treatment (supplemental Figure 3C), consistent with restricted neutrophilic AML maturation.
TLR2 signaling reportedly regulates the activity of Klf4 and Irf8, whereas a connection between TLR2 and C/epbα/ε or Gfi1 are unknown.53,54 Therefore, we sought to determine whether monocyte vs granulocyte maturation imposed by Pam3CSK4 is driven by AML-intrinsic or extrinsic Tlr2 signaling. Using Tlr2-proficient and -deficient AML transplants, we observed that monocyte and macrophage differentiation was blocked in Tlr2−/−Dnmt3a+/−Flt3ITD AML, whereas granulocytic maturation remained suppressed with Pam3CSK4 treatment (Figure 3H-I). Conversely, we observed significant increases in both monocyte and granulocyte maturation of CD45.1+ WT host BM cells in response to Pam3CSK4 (supplemental Figure 4A-C). This suggests that AML monocyte/macrophage but not granulocyte maturation is a Tlr2-dependent, AML-autonomous process, and that myeloid differentiation programs induced in WT BM cells by Pam3CSK4 differs from that of AML. We then investigated whether other TLR agonists elicited similar differentiation dynamics. Only the TLR4 agonist LPS increased Dnmt3a+/−Flt3ITD AML granulocyte differentiation (supplemental Figure 4D, left). Like Pam3CSK4, the Pam2CSK4 agonist significantly increased macrophage-like maturation of Dnmt3a+/−Flt3ITD AML (supplemental Figure 4D, right). Altogether these data indicate that TLR2 signaling promotes a pattern of AML differentiation that is distinct from WT BM and other TLRs.
It is not known whether AML cells possess the capability to engulf foreign pathogens. At baseline, a portion of both WT and macrophage-like AML cells demonstrated phagocytosis of pHrodo-tagged Staphylococcus aureus, which was further increased in Pam3CSK4 treated mice (supplemental Figure 4E). As expected, there was no phagocytic activity of macrophage-like, Tlr2-deficient AML cells consistent with the Tlr2-dependent recognition of Staphylococcus aureus55 (supplemental Figure 4E). Despite the inability to induce macrophage-like differentiation, LPS and R848, in addition to Pam2CSK4 increased phagocytosis by AML cells (supplemental Figure 4F). These data indicate that TLR signaling effects on AML cell maturation are separable from effects on cellular processes.
Acute inflammation causes a long-term impairment of LSC activity
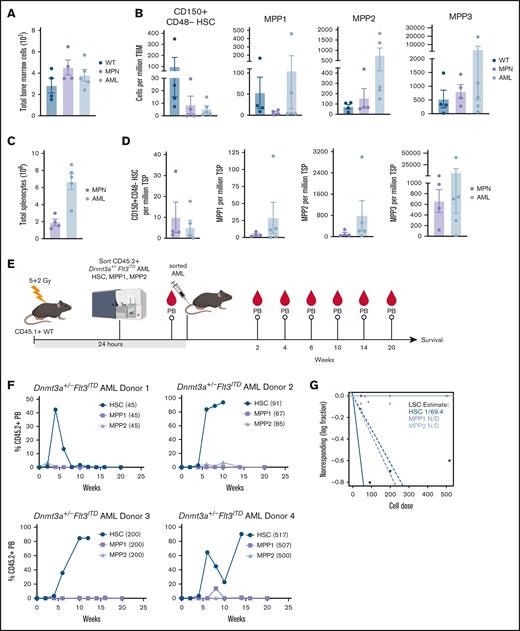
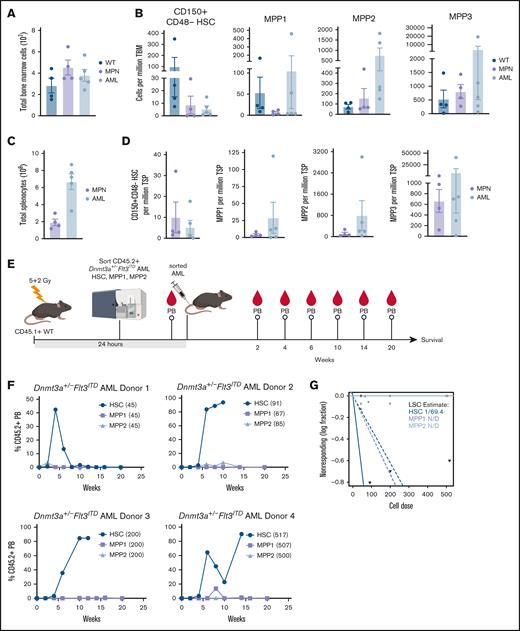
Based on our observations that only TLR2 agonists extend AML mouse survival, although some or all TLR agonists induced myeloid maturation and/or apoptosis, we postulated that Pam3CSK4 might functionally impair the LSCs. We previously described that Dnmt3a+/−Flt3ITD AML have a significantly expanded primitive LSK compartment compared to that of WT and Flt3ITD mice that develop a MPN.23 However, the AML LSK population is highly heterogeneous, comprised predominantly of immunophenotypic multipotent progenitors MPP2 and MPP3, with rare MPP1 and HSC (Figure 4A-D; supplemental Table 2). In a similar mouse model of Dnmt3a-KO/Flt3ITD AML, MPP3 cells were significantly expanded, but nevertheless could not propagate the disease in WT recipient mice.21 As such, the exact LSC population remains unknown. To define which of the remaining populations harbor the Dnmt3a+/−Flt3ITD LSCs, we sorted HSC, MPP1, and MPP2 cells from moribund CD45.2+Dnmt3a+/−Flt3ITD donor mice (n = 4), transplanted them into CD45.1+ WT recipients (n = 1 per cell-type per donor), and monitored mice for AML development (Figure 4E). At the cell doses tested, only the immunophenotypic HSC Dnmt3a+/−Flt3ITD cells produced sustained PB chimerism and lethal AML in recipient mice (Figure 4F). We estimated 1 LSC in 69 immunophenotypic HSC from moribund Dnmt3a+/−Flt3ITD mice (Figure 4G; supplemental Table 2).
Functional identification of Dnmt3a+/−Flt3ITD LSC population. (A-D) Moribund de novo Dnmt3a+/−Flt3ITD AML (n = 4) and age-matched Flt3ITD MPN (n = 5) and WT control (n = 4) mice. (A) Average ±SEM total BM. (B) Average ± SEM HSC (CD150+CD48−CD34−CD135−LSK), MPP1, MPP2, and MPP3 cells per million total BM. (C) Average ± SEM total spleen. (D) Average ± SEM HSC (CD150+CD48−CD34−CD135−LSK), MPP1, MPP2, and MPP3 cells per million total spleen. (E) Experimental schematic for panels F,G. Immunophenotypic HSC (CD150+CD48−CD34−CD135−LSK), MPP1 (CD150+CD48−CD34+CD135−LSK), or MPP2 (CD150+CD48+CD34+CD135−LSK) Dnmt3a+/−Flt3ITD AML cells (CD45.2+) were sorted and transplanted into CD45.1+ WT recipient mice. Peripheral blood (PB) chimerism evaluated at indicated time points after transplant. (F) Average ±SEM percent CD45.2+ cells in PB (n = 4 HSC/MPP1/MPP2 matched donor sets with n = 1 recipient/cell-type). (G) LSC estimation for each Dnmt3a+/−Flt3ITD AML cell-type from panel F. Statistical significance by ordinary 1-way ANOVA using Tukey multiple comparison test (A-D), or ELDA analysis (G).
Functional identification of Dnmt3a+/−Flt3ITD LSC population. (A-D) Moribund de novo Dnmt3a+/−Flt3ITD AML (n = 4) and age-matched Flt3ITD MPN (n = 5) and WT control (n = 4) mice. (A) Average ±SEM total BM. (B) Average ± SEM HSC (CD150+CD48−CD34−CD135−LSK), MPP1, MPP2, and MPP3 cells per million total BM. (C) Average ± SEM total spleen. (D) Average ± SEM HSC (CD150+CD48−CD34−CD135−LSK), MPP1, MPP2, and MPP3 cells per million total spleen. (E) Experimental schematic for panels F,G. Immunophenotypic HSC (CD150+CD48−CD34−CD135−LSK), MPP1 (CD150+CD48−CD34+CD135−LSK), or MPP2 (CD150+CD48+CD34+CD135−LSK) Dnmt3a+/−Flt3ITD AML cells (CD45.2+) were sorted and transplanted into CD45.1+ WT recipient mice. Peripheral blood (PB) chimerism evaluated at indicated time points after transplant. (F) Average ±SEM percent CD45.2+ cells in PB (n = 4 HSC/MPP1/MPP2 matched donor sets with n = 1 recipient/cell-type). (G) LSC estimation for each Dnmt3a+/−Flt3ITD AML cell-type from panel F. Statistical significance by ordinary 1-way ANOVA using Tukey multiple comparison test (A-D), or ELDA analysis (G).
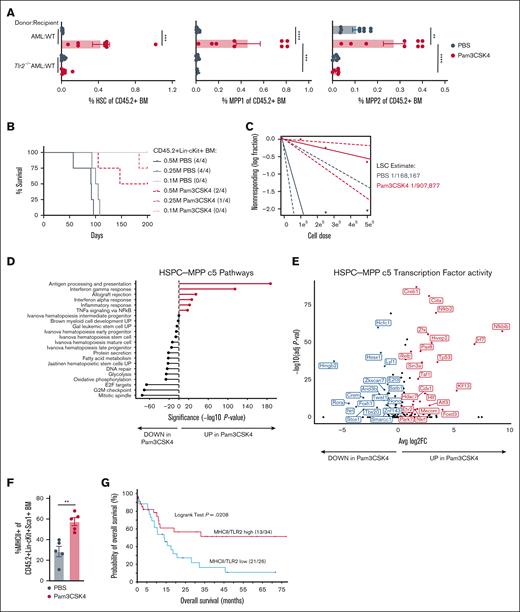
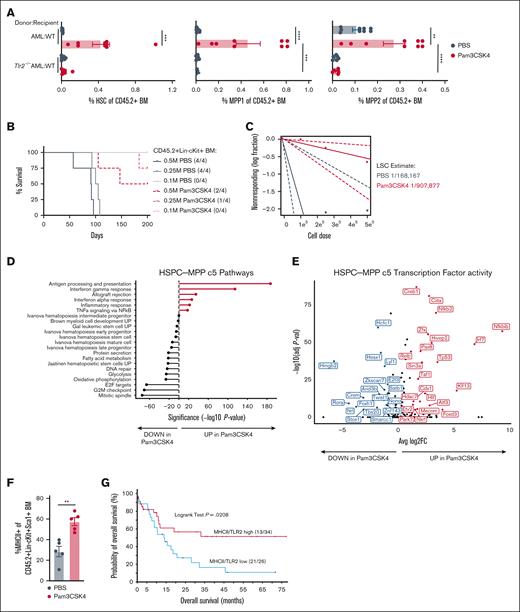
Although we resolved Dnmt3a+/−Flt3ITD LSCs to phenotypic HSCs (CD150+CD48-CD135-CD34-LSK) (Figure 4E-G), in the context of TLR2 agonism these analyses are complicated by the induction of HSPC marker Sca1 expression by interferons and tumor necrosis factor alpha (TNFα) downstream of Pam3CSK4 (supplemental Figure 2E).45,56 Therefore, Sca1 may not be a reliable marker to distinguish functional progenitors from LSCs in the context of inflammation (Figure 5A; supplemental Figure 5A). To definitively test whether LSC activity is perturbed, we performed limiting dilution transplantation assays, the gold standard for stem cell activity, on purified CD45.2+ Lin–cKit+Dnmt3a+/−Flt3ITD AML cells isolated from CD45.1+ WT mice 24 hours after treatment. Recipient mice exhibited differences in survival corresponding to the number of donor cells with overall fewer mice becoming moribund that received cells from Pam3CSK4-treated donors (Figure 5B). The estimated number of LSCs was reduced over 5-fold in recipients of Pam3CSK4-treated mouse donor cells (1/907 877; P = .0127) as compared to PBS control–treated mouse donors (1/168 167), ultimately extending AML mice survival (Figure 5C; supplemental Table 2).
TLR2 signaling causes long-term impairment of LSC activity. (A) Average ± SEM percent immunophenotypic HSC (left), MPP1 (middle), and MPP2 (right) in CD45.2+ BM. Replicates for donor-recipient transplants include: AML-WT (n = 9/group) and AML-Tlr2−/− (n = 8/group). (B) Kaplan-Meier survival curves of WT mice transplanted with limiting numbers (M million) of CD45+Lin−cKit+ BM cells sorted from transplanted WT mice 24 hours after PBS or Pam3CSK4 treatment (n = 4/group). (C) LSC estimation for each treatment group from panel B. (D) Gene set enrichment analysis of significantly differentially expressed genes with Pam3CSK4 vs PBS control treatment in HSPC-MPP c5 cells. (E) Volcano plot of transcription factor activity analyses associated with up and downregulated genes in Pam3CSK4 vs PBS control treatment for HSPC-MPP c5 cells. (F) Average ± SEM percent MHC class II+ cells within the CD45.2+Lin−cKit+Sca1+ (LSK) BM from Dnmt3a+/−Flt3ITD AML-transplanted CD45.1+ WT mice 24 hours after treatment with PBS or Pam3CSK4 (n = 5/group). (G) Comparison of the probability of OS in months for patients with AML with high (n = 34) vs low (n = 26) coexpression of TLR2 and MHCII genes. Statistical significance was calculated by unpaired t test (F). ∗∗P < .01 and log rank test (G). Statistical significance by ordinary 1-way ANOVA using Tukey multiple comparison test between cell populations (A), ELDA analysis (C), unpaired t test (F), and log rank test (G). ∗∗∗∗P < .0001, ∗∗∗P < .001, ∗∗P < .01, ∗P < .05.
TLR2 signaling causes long-term impairment of LSC activity. (A) Average ± SEM percent immunophenotypic HSC (left), MPP1 (middle), and MPP2 (right) in CD45.2+ BM. Replicates for donor-recipient transplants include: AML-WT (n = 9/group) and AML-Tlr2−/− (n = 8/group). (B) Kaplan-Meier survival curves of WT mice transplanted with limiting numbers (M million) of CD45+Lin−cKit+ BM cells sorted from transplanted WT mice 24 hours after PBS or Pam3CSK4 treatment (n = 4/group). (C) LSC estimation for each treatment group from panel B. (D) Gene set enrichment analysis of significantly differentially expressed genes with Pam3CSK4 vs PBS control treatment in HSPC-MPP c5 cells. (E) Volcano plot of transcription factor activity analyses associated with up and downregulated genes in Pam3CSK4 vs PBS control treatment for HSPC-MPP c5 cells. (F) Average ± SEM percent MHC class II+ cells within the CD45.2+Lin−cKit+Sca1+ (LSK) BM from Dnmt3a+/−Flt3ITD AML-transplanted CD45.1+ WT mice 24 hours after treatment with PBS or Pam3CSK4 (n = 5/group). (G) Comparison of the probability of OS in months for patients with AML with high (n = 34) vs low (n = 26) coexpression of TLR2 and MHCII genes. Statistical significance was calculated by unpaired t test (F). ∗∗P < .01 and log rank test (G). Statistical significance by ordinary 1-way ANOVA using Tukey multiple comparison test between cell populations (A), ELDA analysis (C), unpaired t test (F), and log rank test (G). ∗∗∗∗P < .0001, ∗∗∗P < .001, ∗∗P < .01, ∗P < .05.
To understand how TLR2 agonism abrogates LSC function, we interrogated the most primitive HSPC-MPP c5 cluster in our CITE-seq data. Expression of stem/progenitor, glycolysis, oxidative phosphorylation, and cell cycle genes were significantly decreased in the c5 cluster, whereas genes involved in antigen processing and presentation, interferon response, allograft rejection, and TNFα signaling were significantly increased with Pam3CSK4 (Figure 5D; supplemental Figure 5B). Transcription factor activity analysis identified enrichment for related transcription factors associated with stemness, cell cycle (eg, Hmgb2, Arid3b, Twist1, Hcfc1, E2f3), and immune response (eg, Ciita, NF-κB2, Relb, Irf7) (Figure 5E). These transcriptional alterations resulted in the upregulation of MHCII molecules, normally found on professional antigen-presenting cells, on the surface of immature LSK AML cells (Figure 5F). This upregulation of antigen presentation machinery may be of clinical importance as expression of MHC class II genes are positively correlated with expression of their known transcriptional regulator CIITA in patients with AML36 (supplemental Figure 5C; supplemental Table 1). Moreover, patients with AML with high MHC class II and TLR2 expression have significantly better OS than patients with low MHCII/TLR2 expression (Figure 5G). In contrast, the transcriptional responses of other HSPC-like and more mature clusters were highly variable within these same inflammatory gene ontologies (supplemental Figure 3B), supporting the notion that while AML cells may be exposed to a similar inflammatory milieu, they do not necessarily share the same response or fate. These data suggest a role for MHC class II in LSC function and interplay with TLR2 expression.
Discussion
Mechanisms of infection-induced inflammation and the impact on AML disease pathogenesis remains unclear. AML alters the inflammatory state within the BM and immune microenvironments in patients. Cross talk between these compartments and AML cells, in the absence of external inflammatory stimuli, can promote disease progression.57-59 This may in part be mediated by mutations in genes such as TET2 and DNMT3A that confer a selective advantage to mutant HSPCs under inflammatory conditions, whereas normal HSPCs are suppressed by a chronic inflammatory environment.6,20,60-62 In contrast, we now demonstrate that AML cells can be reprogrammed by acute exposure to TLR2-specific ligands resulting in extended OS. This reprogramming was detectable across multiple AML cell types by single-cell transcriptomics, and phenotypically resulted in diverse cell-specific responses, including monocytic differentiation, apoptosis, and impaired self-renewal and proliferation. It is likely that the cumulative effects of TLR2 ligands produced the observed OS benefit, rather than a singular mechanism. TLR4 agonism, however, although promoting apoptosis and differentiation, did not confer survival benefit, highlighting a mechanistic distinction. Why TLR2-specific, and no other TLR-specific ligands, produced this survival benefit is not entirely clear. It could be due to overall greater numbers and/or levels of TLR2 expression on AML cells as compared to other receptors, cell-type specific receptor expression patterns, or differences in specific TLR ligand mediated signaling and cross talk with other pathways that have yet to be elucidated.
Both advantages and disadvantages of TLR2 agonism as a therapeutic strategy for AML exist. The effects of chronic TLR2 agonism on normal and premalignant HSPC, and in MDS have been investigated but questions remain. Although Tlr2 is not required for normal HSC function in mice, repeated systemic exposure of WT mice to TLR2 ligands impaired the long-term repopulating ability of BM HSC.7,63 This functional impairment was suggested to be Tlr2-dependent, but HSC nonautonomous. Given effects of interferons on HSC function, it is possible that cytokine production, including interferons, downstream of TLR2 may be responsible for impairment of normal HSC.7,64,65 In a NUP98-HOXD13 (NHD13) driven mouse model of MDS, deletion of Tlr2 worsened or accelerated disease pathogenesis in mice indicating that Tlr2 plays a protective role against development of this type of myeloid malignancy.66 A later study by the same group found that chronic TLR2/6 heterodimer–specific activation, but not TLR2/1 activation, accelerated disease progression and latency by expansion of NHD13-expressing HSPCs.67 This is seemingly contradictory since NHD13 cells reportedly underwent TLR2-dependent, inflammasome-mediated cell death to protect against transformation.66 It is plausible, however, that TLR2 ligands may promote survival and/or proliferation of mutant HSPC harboring specific AML-driver mutations. In support of this, chronic systemic TLR2 agonist exposure or bacterial infection can induce the preleukemic expansion of HSPC in Tet2- or Dnmt3a-deficient mice.20,61 In sum, repeated or prolonged exposure to TLR2 ligands may have deleterious consequences on normal or mutant HSC.
In contrast, our study suggests that acute TLR2 agonism, regardless of the heterodimeric partner, is antileukemogenic in the contexts of already transformed DNMT3A-mutant and MLL-r AML. Whether these differences in disease responses to TLR2 agonism are due to the duration/frequency of agonist exposure (chronic vs acute), the disease stage or type of malignancy (premalignant vs MDS vs AML), the specific driver mutations, and/or different cell-intrinsic signaling are unclear. Because TLR2 is the most highly expressed TLR in human AML, regardless of mutation, karyotype, or risk stratification, we anticipate acute TLR2 agonism will provide similar benefit to other subtypes of AML, for which there is already some evidence in AML-ETO9a–expressing AML cells ex vivo.26 Recently, a study found that a single dose of TLR2/6 ligand FSL-1 could mitigate radiation-induced hematopoietic injuries in mice and nonhuman primates without adverse clinical effects,68 suggesting that if given acutely TLR2 agonism might be safe. However, given the risk of premalignant clonal expansion or damage to healthy HSPC in infection-prone patients with AML, the use of TLR2 agonism as an anti-AML therapy in the future may depend on either the ability to subsequently perform hematopoietic stem cell transplantation, or the identification of a downstream target of TLR2 activation that can be leveraged therapeutically to bypass potentially harmful effects.
We show that TLR2 ligands induce transcriptional changes in AML cell states across the full spectrum of the leukemic hierarchy. TLR2 signaling promotes proliferation and differentiation of immature AML cells and expands the pools of more specialized monocyte and granulocyte precursors that terminate into macrophage-like cells with enhanced effector function. In our work, TLR2 ligands also induced myeloid differentiation of nonleukemic BM cells from the host mice. Additional studies are needed to understand whether TLR2 agonism might stimulate these matured leukemic cells or the nonmalignant immune cells to suppress leukemogenesis (eg, phagocytosis, cytokine signaling, or T-cell–mediated killing) or even assist with combating infection. We also reveal a striking Tlr2-dependent, AML cell autonomous decrease in LSC activity with Pam3CSK4 treatment. This was associated with disruption of key metabolic, stem cell, and cell cycle transcriptional programs. Both glycolysis and oxidative phosphorylation are known dependencies of AML LSCs and represent important putative antileukemic mechanisms for future investigation as a consequence of TLR2 agonism in primitive AML cells.69-72
Alternatively, Pam3CSK4 treatment increased transcriptional activation of antigen presentation and interferon response pathways in LSCs, and upregulated MHC class II on the surface of immature AML cells. Consistently, activity of CIITA, the master transactivator of MHC class II gene expression,73 was enriched in Pam3CSK4 treated AML cells. We also identified that high coexpression of TLR2 and MHC class II genes portend a significantly better OS for patients with AML. MHC class II plays a role in the stimulation and activation of CD4+ T cells that could provide an effective immune response against tumor cells.74,75 Therefore, future experiments are needed to determine the susceptibility of AML cells to T-cell–mediated antitumor responses upon TLR2 activation. Both adult and pediatric AML exhibit decreased expression of multiple MHC and antigen presentation related genes compared to healthy controls.57 Further, in relapsed AML after allogeneic stem cell transplant, downregulation of MHC class II transcripts and proteins are a commonly observed mechanism of immune escape.76 Thus, our work suggests important translational potential for TLR2 agonists in MHC class II expression and LSC function, and future studies will clarify the exact role of MHC class II in the suppression of leukemogenesis by TLR2 agonism.
Acknowledgments
The authors acknowledge the SKCCC Shared Resources, including Flow Cytometry and Human Immune Monitoring, Translational Research/Pathology, and Cancer Genomics & Bioinformatics.
The research was supported by National Cancer Institute (NCI) F31 CA268843 (M.E.L.), NCI T32 CA236736 (J.S.R.-S.), NCI R00 CA248460 (R.L.B.), National Institutes of Health (NIH) R01 CA226432 (C.M.E.), NCI R37 CA226433 (S.E.M.), Concern Foundation Conquer Cancer Now award (S.E.M.), Philadelphia Department of Health CURE grant (S.E.M.), American Society of Hematology (R.L.B.), Leukemia Research Foundation (R.L.B.), and Sidney Kimmel Comprehensive Cancer Center support grant NIH P30 CA056036.
Schematics in Figures 1D, 2G, 4E and visual abstract were created with BioRender.com.
Authorship
Contribution: M.E.L. and S.E.M. were involved in study design; M.E.L. and J.S.R.-S. carried out data acquisition; M.E.L., J.S.R.-S., M.S.B., R.M., C.M.E., R.L.B., and S.E.M. conducted data analysis and interpretation; and M.E.L., R.L.B., S.E.M. were involved in writing the manuscript writing.
Conflict-of-interest disclosure: S.E.M. received research funding from CellCentric Ltd. C.M.E. received research funding from AbbVie unrelated to this project. The remaining authors declare no competing financial interests.
Correspondence: Sara E. Meyer, Department of Pharmacology, Physiology, and Cancer Biology, Sidney Kimmel Comprehensive Cancer Center, Thomas Jefferson University, 233 S. 10th St, Philadelphia, PA 19107; email: sara.meyer@jefferson.edu.
References
Author notes
Bulk RNA sequencing of Dnmt3a+/−Flt3ITD AML, Flt3ITD MPN (myeloproliferative neoplasm), LSK (Lin–cKit+Sca1+), CMP (common myeloid progenitor), and GMP (granulomonocytic progenitor) wild type mouse are available at https://doi.org/10.1158/2159-8290.CD-16-0008 (Gene Expression Omnibus [GEO] accession number: GSE77849). CITE-seq (Cellular Indexing of Transcriptomes and Epitopes by Sequencing) data can be accessed in the GEO (GEO accession GSE287620).
All R code used to analyze the CITE-seq data can be found at https://github.com/bowmanr/Meyer_TLR (GEO accession number for CITE-seq data: GSE287620).
The full-text version of this article contains a data supplement.

