Key Points
Pacritinib exhibits fourfold higher potency for inhibition of the hepcidin regulator ACVR1 compared to momelotinib based on in vitro data.
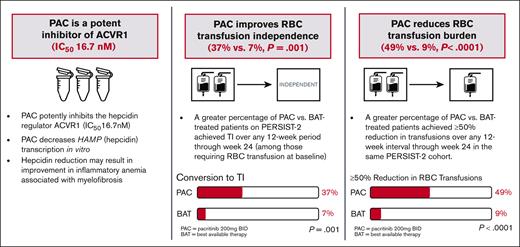
Pacritinib is associated with an increase in red blood cell transfusion independence in patients with cytopenic myelofibrosis.
Abstract
In patients with cytopenic myelofibrosis, treatment with the JAK2/IRAK1 inhibitor pacritinib was associated with anemia benefit in the phase 3 PERSIST-2 study. The impact of pacritinib on transfusion independence (TI) has not been previously described, nor has the mechanism by which pacritinib improves anemia been elucidated. Because it has been previously postulated that inhibition of activin A receptor, type 1 (ACVR1)/activin receptor-like kinase-2 improves anemia in patients with myelofibrosis via suppression of hepcidin production, we assessed the relative inhibitory potency of pacritinib compared with other JAK2 inhibitors against ACVR1. Pacritinib inhibited ACVR1 with greater potency (half-maximal inhibitory concentration [IC50] = 16.7 nM; Cmax:IC50 = 12.7) than momelotinib (IC50 = 52.5 nM; Cmax:IC50 = 3.2), fedratinib (IC50 = 273 nM; Cmax:IC50 = 1.0), or ruxolitinib (IC50 > 1000; Cmax:IC50 < 0.01). Pacritinib’s inhibitory activity against ACVR1 was corroborated via inhibition of downstream SMAD signaling in conjunction with marked suppression of hepcidin production. Among patients on PERSIST-2 who were not transfusion independent at baseline based on Gale criteria, a significantly greater proportion achieved TI on pacritinib compared with those treated on best available therapy (37% vs 7%, P = .001), and significantly more had a ≥50% reduction in transfusion burden (49% vs 9%, P < .0001). These data indicate that the anemia benefit of the JAK2/IRAK1 inhibitor pacritinib may be a function of potent ACVR1 inhibition.
Introduction
In myelofibrosis (MF), patients with cytopenias form the highest risk group for disease progression and death1,2 and are the most challenging to treat, because the first 2 approved JAK2 inhibitors, ruxolitinib and fedratinib, are associated with drug-induced anemia, thrombocytopenia, and worsening transfusion requirements over the first 8 to 16 weeks of treatment.3-5 Anemia is associated with poor quality of life in patients with MF, particularly in those requiring red blood cell (RBC) transfusions,6 and is a known poor prognosis factor.7-9
Anemia in MF is multifactorial, although inflammation driven by aberrant cytokine production is a major cause.6,10-13 Disease-related inflammation leads to increased hepcidin production, resulting in functional iron deficiency and impaired erythropoiesis.11,14 It has been postulated that reduction of hepcidin levels, either by targeting pathological inflammation12 or by inhibiting the hepcidin regulator activin A receptor, type 1 (ACVR1),15 could be a viable therapeutic strategy for improving anemia. Recent studies in murine models of chronic disease show that ACVR1 inhibition leads to increased mobilization of sequestered iron and stimulation of erythropoiesis.15 These results were recapitulated in human studies, with the experimental JAK1/JAK2/ACVR1 inhibitor momelotinib found to be associated with stable or increasing rates of transfusion independence (TI) in patients with MF.16-19
Pacritinib, a JAK1-sparing inhibitor of JAK2/IRAK1, has also demonstrated anemia benefit in patients with MF. In the phase 3 PERSIST-2 study, patients on pacritinib 200 mg twice daily (BID) experienced higher rates of clinical improvement in hemoglobin (≥2 g/dL increase or RBC TI for ≥8 weeks) at week 24 compared with those treated with best available therapy (BAT).20 Here, we explore a mechanistic explanation for the impact of pacritinib on anemia by assessing its in vitro inhibitory potency against ACVR1 and its ability to suppress hepcidin production, and we describe the impact of pacritinib on RBC transfusion burden in patients with MF requiring transfusion support.
Methods
In vitro assays
The inhibitory activity of the JAK inhibitors pacritinib, momelotinib, fedratinib, and ruxolitinib against ACVR1 was assessed using the HotSpot assay from Reaction Biology Corporation. A positive control (LDN 193189) was assessed in parallel.21 The half-maximal inhibitory concentration (IC50) of each compound was calculated using threefold serial dilutions starting at 10 μM, with the mean IC50 reported based on duplicate assays. The maximum plasma concentration (Cmax) at the clinically recommended dose for each compound was sourced from the medical literature based on clinical pharmacokinetic studies performed at the clinical recommended dose in humans, and the unbound fraction of Cmax was calculated as described in supplemental Material. Inhibitory potency was defined as the ratio of unbound Cmax to IC50. Exposure-time concentration modeling for ACVR1 inhibitors was performed as previously described for pacritinib.22 For momelotinib (including its active metabolite M21), the mean time-concentration data were captured from the medical literature, digitized, and fit using Phoenix WinNonlin version 8.3. R (version 4.1.1) was used to simulate and visualize the time-concentration curves.
The impact of the JAK inhibitors on signaling downstream of ACVR1 was assessed in human HepG2 liver cells. Immunoblots of phosphorylated STAT5 (pSTAT5) and phosphorylated SMAD1/5/9 (pSMAD1/5/9) were performed as previously described15 in the presence of BMP6. Hepcidin (HAMP) transcription was assessed by quantitative reverse transcription polymerase chain reaction in HepG2 cells stimulated with BMP6 in the presence of each of the JAK inhibitors. HAMP forward primer: 5′-CACAACAGACGGGACAACTT-3′; HAMP reverse primer: 5′-CGCAGCAGAAAATGCAGATG-3′. All JAK inhibitors were administered in 1-μM concentrations.
PERSIST-2 was approved by the institutional review boards at each participating institution and conducted in accordance with the principles outlined in the Declaration of Helsinki.
Study population
The PERSIST-2 (NCT02055781) study design has been previously described.20 Briefly, the study enrolled patients with MF and platelet counts of ≤100 × 109/L, randomizing patients to pacritinib 200 mg BID (US Food and Drug Administration–approved dose), pacritinib 400 mg once daily, or BAT. For this analysis, comparisons were made between patients treated with pacritinib 200 mg BID and BAT, as well as the subgroup of patients treated with BAT who received erythroid supportive therapies, including erythropoiesis stimulating agents, danazol, thalidomide or its analogs, and corticosteroids. Patients treated with study drug who enrolled ≥12 weeks before study termination and who were not transfusion independent at baseline were included in the analysis. Non-TI at baseline was defined using both the Gale criteria23 (any RBC transfusions over the 12 weeks before first dose) and the criteria similar to that used in the pivotal studies of momelotinib16,17 (SIMPLIFY criteria: any RBC transfusion over the 12 weeks before first dose, or baseline hemoglobin of <8 g/dL).
End points and statistical analysis
The following end points were analyzed: the proportion of patients who achieved TI over any 12-week interval, the proportion who achieved a ≥50% reduction in transfusion burden over any 12-week interval, the cumulative probabilities of TI, the median change in hemoglobin and platelets through week 24, and overall survival. TI was defined using both the Gale criteria23 (absence of RBC transfusions over any 12-week interval) and criteria similar to that used in the SIMPLIFY studies16,17 (absence of RBC transfusions and no hemoglobin of <8 g/dL over any 12-week interval). Notably, the SIMPLIFY studies report the predefined end point of TI in the 12 weeks leading up to week 24, whereas this analysis reports TI over any 12-week interval through week 24. All end points were analyzed among patients who were not transfusion independent at baseline based on Gale criteria; in addition, TI conversion rates and cumulative probabilities based on SIMPLIFY criteria were analyzed in patients who were not transfusion independent at baseline based on SIMPLIFY criteria.
The proportion of patients who achieved TI and had a ≥50% reduction in transfusion burden were compared by treatment arm using the Fisher exact test with the 95% confidence interval (CI) estimated using the Clopper-Pearson method. Statistical testing was not performed within subgroups. Cumulative probabilities and overall survival were estimated using Kaplan-Meier methods. Cox proportional hazard models were performed to estimate the unadjusted and baseline 30-day transfusion rate-adjusted hazard ratios (HRs) and 95% CIs for overall survival. A logistic regression model was used to assess whether baseline platelet count and the interaction between treatment and baseline platelet counts modified the treatment effect.
Results
ACVR1 inhibition assays
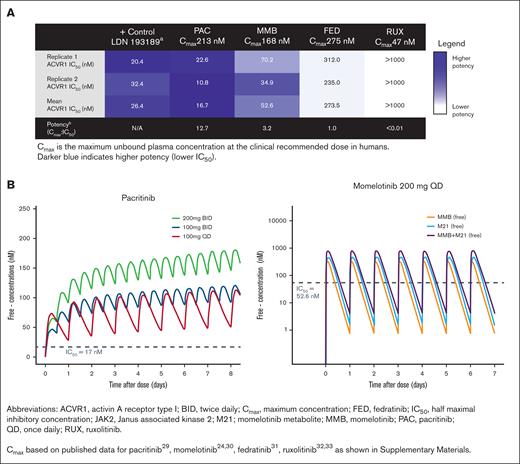
The mean IC50 of pacritinib against ACVR1 was 16.7 nM, which is ∼12.7-fold lower than the mean unbound Cmax achieved clinically with pacritinib 200 mg BID (Figure 1A). Momelotinib inhibited ACVR1 with a mean IC50 of 52.5 nM, which is ∼3.2 times lower than the clinical unbound Cmax based on 200 mg daily dosing. Fedratinib is not a potent ACVR1 inhibitor based on a mean IC50 (273.5 nM), which is similar to its Cmax (275 nM) for a 400 mg daily dose. Ruxolitinib had no inhibitory activity against ACVR1. Derivation of the Cmax for each compound is shown in supplemental Materials. Based on modeled concentration-time curves, pacritinib steady-state plasma concentrations in humans exceed ACVR1 IC50 for the entire day (24 hours) at the 200 mg BID dosage, whereas momelotinib plasma concentrations exceed ACVR1 IC50 ∼9 hours per day based on 200 mg daily dosing. When accounting for momelotinib and the active metabolite (M21), exposure exceeds ACVR1 IC50 ∼14 hours per day, although the metabolite is twofold to threefold less active against ACVR1 in vitro compared with momelotinib (Figure 1B).24
Inhibition of ACVR1 by JAK inhibitors. (A) Strength of inhibition of ACVR1 by JAK2 inhibitors. The IC50 is shown in comparison with the Cmax achieved clinically. (B) Simulated free drug concentration for pacritinib and momelotinib relative to ACVR1 IC50. Data plotted as median concentration of free drug over time through steady state for pacritinib and for momelotinib (MMB) and its metabolite (M21).
Inhibition of ACVR1 by JAK inhibitors. (A) Strength of inhibition of ACVR1 by JAK2 inhibitors. The IC50 is shown in comparison with the Cmax achieved clinically. (B) Simulated free drug concentration for pacritinib and momelotinib relative to ACVR1 IC50. Data plotted as median concentration of free drug over time through steady state for pacritinib and for momelotinib (MMB) and its metabolite (M21).
SMAD phosphorylation and hepcidin expression
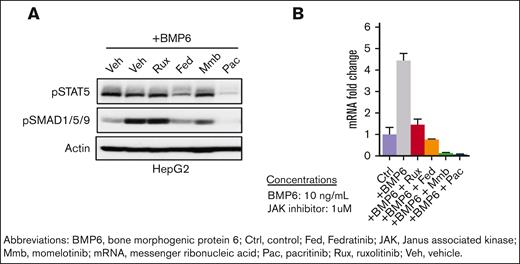
Pacritinib resulted in potent in vitro inhibition of both STAT5 and SMAD1/5/9 phosphorylation in HepG2 liver cells after BMP6 stimulation (Figure 2A). Both fedratinib and momelotinib reduced pSMAD1/5/9 levels to a lesser extent, whereas ruxolitinib did not alter levels compared with vehicle control (Figure 2A). Although all JAK inhibitors reduced HAMP (hepcidin) messenger RNA expression in BMP6-stimulated HepG2 cells, the reduction was most potent with pacritinib and momelotinib, which reduced expression to levels below those seen in control cells in the absence of BMP6 stimulation (Figure 2B).
SMAD phosphorylation and hepcidin expression. (A) Pacritinib decreases STAT5 and SMAD1/5/9 phosphorylation and (B) HAMP (hepcidin) messenger RNA (mRNA) levels in human HepG2 cells stimulated by BMP6 for 24 hours.
SMAD phosphorylation and hepcidin expression. (A) Pacritinib decreases STAT5 and SMAD1/5/9 phosphorylation and (B) HAMP (hepcidin) messenger RNA (mRNA) levels in human HepG2 cells stimulated by BMP6 for 24 hours.
Characteristics of patients requiring RBC transfusion
Among 106 and 98 patients treated on PERSIST-2 with pacritinib 200 mg BID and BAT, respectively, 41 and 43, respectively, were not transfusion independent at baseline based per Gale criteria. The baseline characteristics of these patients were similar (Table 1); >50% had received a prior JAK2 inhibitor, and >50% had a baseline platelet count of <50 × 109/L. Among patients with JAK2V617F, most patients had a low allele burden (<50%), which is associated with increased risk of anemia and more advanced disease.25 Among patients receiving BAT, the most common regimens included ruxolitinib (n = 18, median dose: 5 mg daily), hydroxyurea (n = 9), watch-and-wait only (n = 8), and erythroid supportive therapies including danazol, immunomodulatory agents, erythropoietin analogs, and corticosteroids (n = 11).
Baseline characteristics of patients who were not transfusion independent, by treatment arm
| Characteristic . | Pacritinib n = 41 . | BAT n = 43 . |
|---|---|---|
| Age in y, median (range) | 67 (49-85) | 70 (50-83) |
| Female, n (%) | 16 (39%) | 17 (40%) |
| Primary MF, n (%) | 34 (83%) | 27 (63%) |
| DIPSS high risk, n (%) | 18 (44%) | 19 (44%) |
| Time since MF diagnosis in years, median | 2.5 | 2.9 |
| Prior JAK2 inhibitor, n (%) | 23 (56%) | 25 (58%) |
| Bone marrow fibrosis grade 3, n (%) | 26 (63%) | 25 (58%) |
| Platelet count (×109/L), median (IQR) | 41 (21-70) | 43 (23-67) |
| Platelet count <50 × 109/L, n (%) | 25 (61%) | 26 (61%) |
| Hemoglobin (g/dL), median (IQR) | 8.7 (7.7-9.7) | 8.6 (7.7-9.4) |
| RBC transfusions per month within 90 days before informed consent, median (IQR) | 1.5 (0.8-3.4) | 1.9 (1.0-3.7) |
| White blood cells (×109/L), median (IQR) | 5.4 (3.4-18.1) | 5.1 (3.5-13.7) |
| JAK2V617F mutation | 35 | 34 |
| Allele burden <50% | 26 (74%) | 25 (74%) |
Patients randomized to pacritinib 200 mg BID or BAT were included if they had received RBC transfusion in the 12 weeks before treatment. Transfusion independence is based on Gale criteria.
Abbreviations: BAT, best available therapy; BID, twice per day; DIPSS, Dynamic International Prognostic Scoring System; JAK2, Janus associated kinase 2; IQR, interquartile range; MF, myelofibrosis; RBC, red blood cell.Note: Transfusion independence is based on Gale criteria.
TI and transfusion reduction
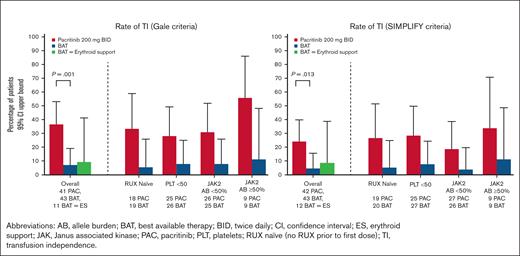
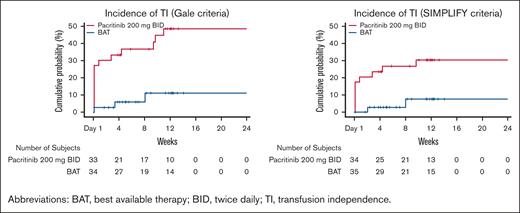
A significantly greater proportion of patients treated with pacritinib achieved TI over any 12-week interval within the first 24 weeks on study compared with those treated with BAT (37% [15/41] vs 7% [3/43], P=.001 based on Gale criteria; 24% [10/42] vs 4.5% [2/44], P=.013 based on SIMPLIFY criteria), as shown in Figure 3. Among patients who received erythroid supportive agents as BAT, the TI conversion rates were similar to the overall BAT group (9% [1/11] with Gale criteria, 8% [1/12] with SIMPLIFY criteria). Among patients treated with pacritinib, ∼50% of the TI conversions that occurred from baseline through week 24 were achieved starting with the first dose (TI achieved from baseline through week 12), with the other half occurring steadily thereafter (Figure 4). There was no diminution in the treatment effect after adjusting for baseline platelet count.
Rate of transfusion independence. Percentage of patients achieving transfusion independence over any 12 weeks through week 24 among patients who were not TI at baseline based on Gale criteria (left) and SIMPLIFY criteria (right) over any 12-week interval. Data shown in overall population (including statistical testing), as well as in subgroups.
Rate of transfusion independence. Percentage of patients achieving transfusion independence over any 12 weeks through week 24 among patients who were not TI at baseline based on Gale criteria (left) and SIMPLIFY criteria (right) over any 12-week interval. Data shown in overall population (including statistical testing), as well as in subgroups.
Cumulative incidence of RBC TI over any 12-week interval. Events are counted at the start of the transfusion-free interval.
Cumulative incidence of RBC TI over any 12-week interval. Events are counted at the start of the transfusion-free interval.
The effect of pacritinib on TI conversion rate was maintained in patients naïve to ruxolitinib, suggesting that the higher TI rate observed in the pacritinib arm was not because of a rebound effect after washout of prior ruxolitinib (Figure 3). Similar trends were seen in the subgroup of patients with baseline platelet counts of <50 × 109/L, as well as in those with both low and high JAK2V617F allele burden.
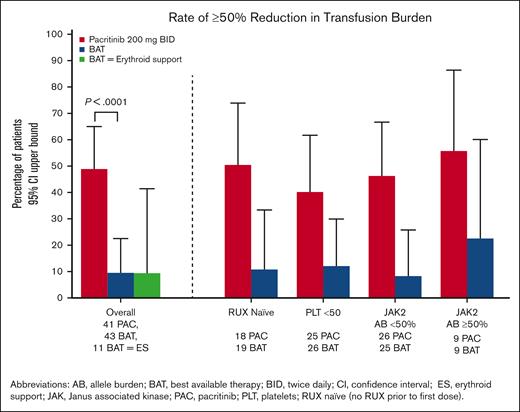
The percentage of patients who achieved a ≥50% reduction in transfusion rate over any 12-week interval was significantly higher on pacritinib compared with BAT (49% [20/41] vs 9% [4/43], P < .0001), including patients who received erythroid support therapies as BAT (9% [1/11]). As shown in Figure 5, these trends were also seen regardless of prior ruxolitinib, presence of severe thrombocytopenia, or JAK2V617F allele burden.
Percentage of patients achieving ≥50% reduction in transfusion burden over any 12 weeks through week 24. Data shown in overall population of patients requiring RBC transfusions at baseline (including statistical testing), as well as in subgroups.
Percentage of patients achieving ≥50% reduction in transfusion burden over any 12 weeks through week 24. Data shown in overall population of patients requiring RBC transfusions at baseline (including statistical testing), as well as in subgroups.
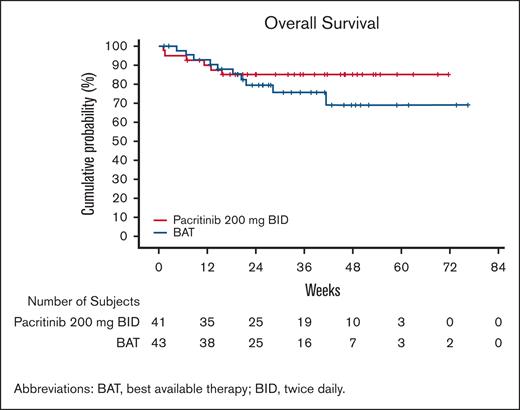
Overall survival on pacritinib and BAT was similar over the first 12 weeks of study follow-up but subsequently diverged (Figure 6), with a trend toward improved survival on pacritinib, with HR = 0.61 (95% CI, 0.22-1.68). This trend persisted after adjustment for baseline RBC transfusion rate, with HRadjusted = 0.64 (95% CI, 0.23-1.76).
Overall survival from randomization among patients requiring baseline RBC transfusions. Data presented among patients on pacritinib and BAT requiring RBC transfusions at baseline.
Overall survival from randomization among patients requiring baseline RBC transfusions. Data presented among patients on pacritinib and BAT requiring RBC transfusions at baseline.
Discussion
Pacritinib exhibited fourfold higher potency and longer exposure time for ACVR1 inhibition in vitro compared with momelotinib and, when administered at the clinically recommended dose, was associated with a clinically meaningful and statistically significant improvement in TI in this retrospective analysis of patients with cytopenic MF. These features contrast with JAK2 inhibitors that do not inhibit ACVR1 (ruxolitinib and fedratinib), which tend to worsen anemia, leading to dose reductions and subtherapeutic dosing.
Pacritinib’s potent inhibition of ACVR1 and hepcidin production in conjunction with its anemia benefit support the hypothesis that ACVR1 is an important drug target for patients with cytopenic MF. Further studies are warranted to confirm that the TI benefit seen with pacritinib results from ACVR1 inhibition in patients with MF and whether dual inhibition of ACVR1 and IRAK1 could act synergistically to ameliorate anemia. IRAK1 is an integral part of the Toll-like receptor/Myddosome signaling pathway, resulting in NF-κB activation and production of multiple inflammatory cytokines, including interleukin-6, interleukin-1β, and tumor necrosis factor α.26 This pathway is overactive and likely pathogenic in MF,12 and its blockade could result in an anemia benefit that is synergistic with ACVR1 inhibition. Clinical and correlative analyses from the ongoing phase 3 PACIFICA study of pacritinib vs physician’s choice therapy in patients with MF with severe thrombocytopenia could shed light on the mechanism behind pacritinib’s anemia benefit.
The clinical data from this subgroup analysis should be interpreted in the context of the PERSIST-2 study as a whole. Although patients on the pacritinib 200 mg BID arm experienced hemoglobin improvement and reduction in transfusion requirements, they also experienced cytopenia adverse events (AEs) at higher rates compared with patients on BAT (anemia: 24% vs 15%; thrombocytopenia: 34% vs 23%).20 Safety data from the overall PERSIST-2 trial are not discordant with the observed TI benefit, because multiple study-related factors impacted differences in AE rates between arms. First, patients on the pacritinib arm tolerated full-dose JAK2 inhibitor therapy for the duration of the study (100% median dose intensity)27; by contrast, most patients on the BAT arm were either not treated with a JAK2 inhibitor or were treated with low doses of ruxolitinib that are not typically associated with drug-induced cytopenias.27 Second, the median duration of therapy on pacritinib 200 mg BID was longer than on BAT (25 months for PAC vs 21 months for BAT), and many patients on BAT were receiving no active treatment (19% of BAT patients were watch-and-wait only).20 Finally, erythroid support agents were permitted on the BAT arm but prohibited on the pacritinib arm. Thus, although differences in dose intensity, time on treatment, and use of supportive care between treatment arms could have affected cytopenia AE rates on PERSIST-2, results from this study support the hypothesis that pacritinib is associated with anemia benefit in a subset of patients.
Although this analysis was retrospective, a similar proportion of patients from each arm of the PERSIST-2 study were included, and baseline characteristics were comparable between analyzed groups. An important and distinguishing feature of this population is the severity of baseline cytopenias, with 60% of patients having a platelet count of <50 × 109/L. Because thrombocytopenia is an established marker for poor prognosis in MF,2,28 this cytopenic population differs from those described in studies of momelotinib, in which the average platelet count was normal.16-19 Therefore, although clinical results should not be compared directly between studies given differences in methodology for analyzing transfusion benefit, the anemia benefit demonstrated in PERSIST-2 is notable, given the study population of patients with cytopenias and advanced disease.
Pacritinib’s inhibition of ACVR1 provides a strong rationale for its clinical benefit in patient with MF who are anemic. Additional studies are needed to further elucidate the mechanisms underlying this benefit, including the relative roles of IRAK1 and ACVR1 inhibition.
Acknowledgments
The authors acknowledge the late Mark Heaney for his contributions to this work. This study was supported by CTI BioPharma Corp.
Authorship
Contribution: All authors contributed to the design of this analysis, interpretation of data, and editing of the manuscript; S.T.O. and S.A.B. drafted the manuscript; and all authors critically revised and reviewed the manuscript and granted final approval for publication.
Conflict-of-interest disclosure: S.T.O. has consulted for AbbVie, Blueprint Medicines, Celgene/Bristol Myers Squibb (BMS), Constellation Pharmaceuticals, CTI BioPharma Corp., Disc Medicine, Geron, Incyte, Cogent, and Sierra Oncology; and has received research funding from Actuate Therapeutics, Blueprint Medicines, Celgene/BMS, Constellation Pharmaceuticals, CTI BioPharma Corp, Incyte, Kartos Therapeutics, Sierra Oncology, and Takeda. R.A.M. has acted in a consulting or advisory role for Constellation Pharmaceuticals, La Jolla Pharmaceutical, Novartis, and Sierra Oncology; has received research support from AbbVie, Celgene, Constellation Pharmaceuticals, CTI BioPharma Corp, Genotech, Incyte, Promedior, and Samus; and has received grants from Mays Cancer Center P30 Cancer Center Support Grant from the National Cancer Institute (CA054174). C.N.H. received honoraria from AbbVie, CTI BioPharma Corp, Geron, Janssen, and Novartis; has served in consulting/advisory capacity for AOP, Celgene/BMS, Constellation Pharmaceuticals, CTI BioPharma Corp, Galecto, Geron, Gilead, Janssen, Keros, Promedior, Roche, Shire, Sierra Oncology, and Novartis; has served on a speakers’ bureau for AbbVie, BMS, CTI BioPharma Corp, Geron, Sierra Oncology, and Novartis; and has received research funding from BMS, Constellation Pharmaceuticals, and Novartis. P.B. has received research support from CTI BioPharma Corp, Disc Medicine, Incyte Corporation, BMS, Blueprint Medicines Corporation, Cogent Biosciences, Morphosys, Kartos Therapeutics, Ionis Pharmaceuticals, Pfizer, Sumitomo Pharma, Telios, Astellas, NS Pharma and Promedior; and honoraria/consulting fees from CTI BioPharma Corp, Incyte Corporation, BMS, Blueprint Medicines Corporation, Cogent Biosciences, Morphosys, Kartos Therapeutics, AbbVie, GSK, Karyopharm Therapeutics, Novartis, and PharmaEssentia. A.T.G. has acted in a consulting or advisory role for AbbVie, BMS, Constellation Pharmaceuticals, CTI BioPharma Corp, Novartis, PharmaEssentia, and Sierra Oncology. V.G. has consulted for AbbVie, Celgene/BMS, Constellation Pharmaceuticals, Novartis, Pfizer, and Sierra Oncology; he has received honoraria from Celgene/BMS, Constellation Pharmaceuticals, and Novartis; and has served in consulting/advisory capacity for AbbVie, Celgene/BMS, Pfizer, and Roche. B.L.S. has consulted for Acceleron Pharma, Celgene, and Novartis; has served on speakers’ bureaus for Alexion Pharmaceuticals, Celgene, Jazz Pharmaceuticals, and Novartis; has received honoraria from BMS, Incyte, and Taiho Oncology; and reports his institution receiving research funding from Celgene. J.-J.K. has acted in a consulting or advisory role for AbbVie, BMS, Incyte, Novartis, and PharmaEssentia. A.L. has consulted for and participated on speakers’ bureaus for Amgen, Grifols, Novartis, and Sanofi; has participated on speakers’ bureaus for BMS Incyte, Pfizer, and SOBI; and has consulted for Morphosys. S.A.B., S.T., B.G.H., K.R.-T., J.S., and A.R.C. are employed at, and own stock in, CTI BioPharma Corp. J.M. has acted in a consulting or advisory role for AbbVie, BMS, Celgene, Constellation Pharmaceutical, CTI BioPharma Corp, Galecto, Geron, Incyte, Kartos, Karyopharm, Novartis, PharmaEssentia, Prelude Therapeutics, and Sierra Oncology; and has received funding to their institution from AbbVie, BMS, Celgene, CTI BioPharma Corp, Forbius, Geron, Incyte, Imago, Kartos, Merck, Novartis, PharmaEssentia, and Roche. S.V. has consulted for BMS, Constellation Pharmaceuticals, Incyte, Novartis, and Sierra Oncology; and has received researching funding from AstraZeneca, Blueprint Medicines, Celgene, CTI BioPharma Corp, Genentech, Gilead, Incyte, Italfarmaco, Novartis, NS Pharma Inc, PharmaEssentia, Promedior, Protagonist Therapeutic, Roche, and Sierra Oncology. T.K. declares no competing financial interests.
Correspondence: Stephen T. Oh, Washington University School of Medicine, 660 S. Euclid Ave, Campus Box 8125, St. Louis, MO 63110; e-mail: stoh@wustl.edu.
References
Author notes
Inquiries regarding availability of data and clinical trial documentation will be considered on a case-by-case basis and should be directed to Medinfo@ctibiopharma.com.
The full-text version of this article contains a data supplement.

