Key Points
The ATO supports healthy HSPC differentiation into polyclonal αβ/γδ T cells; RAG1-SCID HSPCs arrest at CD4+/CD8dim stage without TCRs.
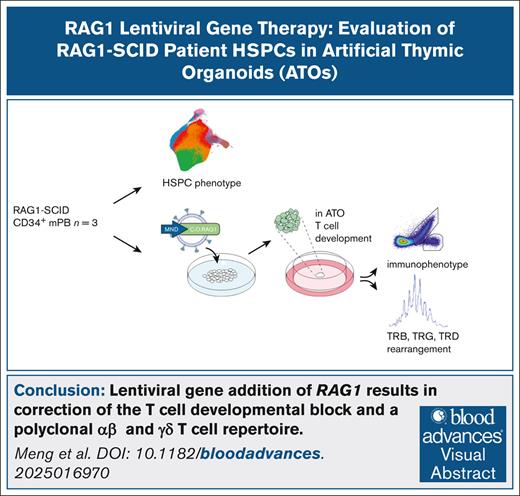
Lentiviral gene addition of RAG1 results in correction of the developmental block and a polyclonal αβ and γδ T-cell repertoire.
Visual Abstract
Recombination activating gene 1 (RAG1) is essential for variable diversity joining recombination during early T- and B-cell development. Null mutations cause a complete block in receptor rearrangement, resulting in T–B– severe combined immunodeficiency (SCID). Patients with RAG1-SCID require hematopoietic stem cell transplantation for survival. Our phase I/II clinical trial (NCT04797260) is currently evaluating lentiviral RAG1 gene addition in autologous hematopoietic stem and progenitor cells (HSPCs). However, studying early human T-cell development is challenging due to limited access to thymic tissue. The artificial thymic organoid (ATO) system offers a promising in vitro model to study human T-cell differentiation. Here, we show that ATO cultures efficiently support T-cell development from healthy donor HSPCs derived from umbilical cord blood or mobilized peripheral blood, yielding not only αβ but also γδ T cells with a polyclonal T-cell receptor (TCR) repertoire. In contrast, noncorrected RAG1-deficient HSPCs from 3 RAG1-SCID patients show a developmental arrest before or at the aberrant CD4+CD8dim double-positive stage, characterized by minimal or absent CD1a upregulation and CD7 downregulation, absence of TCRβ rearrangement, and only partial TCRγ and TCRδ rearrangement. Lentiviral RAG1 gene addition using the clinical vector rescues T-cell development in these patient-derived HSPCs and restores TCR repertoire diversity. These findings highlight the ATO system as a valuable model for dissecting human T-cell development and for the preclinical development and evaluation of gene therapy.
Introduction
The recombination activating genes (RAG)1 and RAG2 play a critical role in variable diversity joining recombination, a process essential for generating a diverse repertoire of antigen receptors during T- and B-cell development. Mutations in these genes have been reported scattered throughout the entire coding sequence, and can give various clinical phenotypes including severe combined immunodeficiency (SCID) with a (near) complete block in T- and B-cell development at an early progenitor stage due to very low or absent recombination activity of the mutant RAG protein.1-7 For both RAG1 and RAG2, a correlation was shown between the residual recombination activity of mutant RAG protein and the clinical phenotype of the patients.1,8-12 SCID can be caused by mutations in an increasing number of genes essential for T-cell development and is currently defined as having <50 circulating T cells per μL (Primary Immune Deficiency Treatment Consortium [PIDTC] guidelines) or <300 T cells per μL (European Society for Immunodeficiencies [ESID] guidelines).13-16 The resulting increased susceptibility to severe infections is inevitably fatal early in life, unless treated with hematopoietic stem cell transplantation, with outcomes significantly better when transplanted prior to onset of infection and with matched donors.17
Transplantation of autologous hematopoietic stem and progenitor cells (HSPCs) following ex vivo lentivirus (LV) gene addition of a correct copy of the mutated gene has been shown to be effective in clinical trials for other genetic causes of SCID, for example, adenosine deaminase (ADA)-SCID, X-SCID, and Artemis-SCID.18 This approach eliminates the risk of graft rejection and graft-versus-host disease associated with HLA mismatches between donor and patient, as well as complications related to the required immunosuppressive interventions. Our group developed a viral gene addition strategy using a self-inactivating LV vector containing codon optimized RAG1 (c.o.RAG1) under control of the MND promoter (SIN-MND-c.o.RAG1 vector), allowing for sufficient RAG1 expression while maintaining a low vector copy number (VCN) per cell.19-22
In an ongoing clinical trial, we treat RAG1-SCID patients with LV gene therapy, restoring RAG1 function by gene addition using the clinical SIN-MND-c.o.RAG1 vector (ClinicalTrials.gov identifier: NCT04797260). The first patients showed a favorable clinical course and immunological recovery based on peripheral blood sampling. However, the development of T cells in the thymus of these patients cannot be studied. During normal development in humans, HSPCs migrate from the bone marrow to the thymus where they gradually lose CD34 while sequentially acquiring CD7, CD5 and CD1a. The most immature thymocytes are not yet committed to the T-lineage and can become natural killer (NK) cells, dendritic cells, or B cells. CD1a is considered to mark this commitment, when TCR gene rearrangement is initiated.23,24 An in vitro functional assay in combination with TCRβ (TRB) rearrangement analysis confirmed and further pinpointed this commitment to be just before the CD1a acquisition upon loss of the CD44 marker, as sorted CD7+CD5+CD1a–CD44dim thymocytes still had NK, myeloid, and B-cell potential while CD7+CD5+CD1a–CD44– did not.25 Shortly after CD1a, thymocytes acquire CD4 at the immature single-positive (ISP) stage, before becoming double-positive (DP) for CD4 and CD8. At the DP stage, CD3/TCRαβ is expressed, and positive and negative selection processes take place, after which CD3+ DP thymocytes become CD4 or CD8 mature, naïve T cells. In the thymus, most cells are CD4/CD8 DP and the various immature double-negative (DN) populations are rare and difficult to distinguish. Artificial thymic organoids (ATOs) have successfully been used to differentiate CD34+ HSPCs to the T-lineage, and to study T-cell development of HSPCs from patients with T-cell deficiencies including SCID.4,26-32 Restoration of several forms of SCID by gene editing has been functionally assessed in ATOs.33-35 While the earliest TRB rearrangement that marks T-cell commitment takes place just before the CD1a stage, single-cell RNA sequencing of sorted human thymocytes has revealed that it continues into ISP and CD3– DP stages, followed by TRA rearrangement in CD3+ DP thymocytes.26 While γδ T cells are thought to mainly develop from the more immature DN thymocytes, single-cell RNA sequencing data also revealed continued TCRγ (TRG) and TCRδ (TRD) rearrangement in the ISP and DP thymocytes, indicating that γδ T cells may branch off anywhere from the DN-ISP-DP path toward αβ T cells.26
Here, we used CD34+ HSPCs from 3 RAG1-SCID patients, corrected with the clinical LV RAG1 gene therapy vector, and monitored T-cell development of corrected and noncorrected HSPCs in ATOs. We report the functional restoration of T-cell development of RAG1-SCID patient HSPCs that have received a functional RAG1 gene, including the restoration of a polyclonal TCR repertoire. In parallel, we investigated the immunological phenotype of the HSPCs and in more detail the phenotype at the previously reported CD4/CD8 DP stage of arrest4,28 in the noncorrected RAG1-SCID patient cells, and assess the extend of not only TRB, but also TRG and TRD rearrangements in these cells at the DNA level. Studying our LV gene therapy vector in ATOs while the patients who received the corrected cells experience T-cell reconstitution provides a platform to study T-cell development of clinical cellular products in detail. The inherently rapid T-cell development in ATOs (∼6 weeks) as opposed to the earliest detectable reconstitution in patients (3-4 months) provides important confidence that the approach is likely to be effective in patients who have undergone transplantation, even though the in vivo situation is more complex. Although there is usually not enough time to wait for ATO results in a clinical setting, the system as presented in this paper could eventually evolve into a surrogate potency assay for SCID gene therapy.
Methods
Cell collection, culture, enrichment, and transduction
Patients’ cells had been mobilized using granulocyte colony-stimulating factor and plerixafor, and collected using leukapheresis as per our clinical trial protocol (ClinicalTrials.gov identifier: NCT04797260) and other HSPC-based gene therapy.18,36 Subsequently, CD34+ HSPC enrichment was performed with the CliniMACS (Miltenyi Biotec). CD34+-enriched patients’ cells were cultured in stem cell growth medium (SCGM; CellGenix) supplemented with cytokines (300 ng/mL stem cell factor, 100 ng/mL thrombopoietin (TPO), 300 ng/mL FLT3-L (STF) + 10 ng/mL IL3; Miltenyi Biotec) for 1 day prior to cryopreservation. Cryopreserved cells were thawed and subsequently cultured in SCGM+STF. LentiBOOST (Sirion, 1 mg/mL) was added during LV transduction using the MND-c.o.RAG1 lentivirus at 1000 viral particles per cell. Control CD34+-HSPCs from mobilized peripheral blood (mPB) and umbilical cord blood (UCB) were precultured for a total of 2 days in SCGM+STF. The patients’ parents or legal guardians provided informed consent to use leftover HSPCs for research purposes in accordance with the Declaration of Helsinki and the Leiden University Medical Center Institutional Review Board.
VCN
Part of the transduced HSPCs were cultured in SCGM+STF for 9 days, before genomic DNA was isolated from single-cell suspensions using the QIAamp DNA Micro Kit (Qiagen). Quantitative polymerase chain reaction (PCR) was performed to measure the human immunodeficiency virus-1 packaging signal (HIV-psi or Ψ) present in the LV vector, normalized to the housekeeping gene albumin (ALB). Primers and probes used were: HIV-psi FW primer: 5′-CAGGACTCGGCTTGCTGAAG-3′; HIV-psi RV primer 5′-TCCCCCGCTTAATACTGACG-3′; HIV-psi probe: 5′-FAM-CGCACGGCAAGAGGCGAGG-TAMRA-3′; ALB FW-2 primer: 5′-GCTGTCATCTCTTGTGGGCTGT-3′; ALB RV primer: 5′-ACTCATGGGAGCTGCTGGTTC-3′; ALB probe: 5′-VIC-CCTGTCATGCCCACACAAATCTCTCC-TAMRA-3′. This method allows calculation of the average number of inserted vector copies per cell in a bulk population, referred to as the vector copy number (VCN).
Primeflow
To detect the percentage of cells with c.o.RAG1 messenger RNA expression as a measure of transduction efficiency, the PrimeFlow RNA assay (ThermoFisher) was performed on HSPCs after 9 days in culture.37 Specific target probe sets were huRPL13A (type 4[AF488], VA4-13187) and c.o.RAG1 (type 1[AF647], custom-ordered). Cells were measured by flow cytometry.
Flow cytometry
Spectral flow cytometry (antibodies, supplemental Table 1) was performed at the Leiden University Medical Center Flow Cytometry Core Facility using a Cytek Aurora 3L (Cytek Biosciences, Fremont, CA), and analyzed using FlowJo (Tree Star Inc) or OMIQ software (www.omiq.ai, Dotmatics). All results shown are on CD45+-gated cells, and subsequent gates are indicated in figures and legends. For the data analyzed using OMIQ, FlowAi was applied to detect anomalous events, based on changes in flow rate, or outlier events. Data were compensated, arcsinh transformed, and gated to remove dead cells and doublets, as previously described.38 Uniform manifold approximation and projection (UMAP) was applied for visualization and calculated based on all markers included in the HSPC panel, except CD10 for spillover reasons. Subsets were selected by gating on a 2-dimensional plot. The heat map was generated in R (v.4.4.2, R Foundation for Statistical Computing) using the pheatmap package.39
ATO cultures
ATOs were initiated with 7500 CD34+-enriched (Miltenyi Biotec, 130-100-453) HSPCs and mixed with 150 000 MS5-hDLL1 cells (Millipore, SCC167) per ATO. The ATOs were placed on 0.4-μm cell culture inserts (Millipore) and maintained as described previously.27
GeneScan
Gene rearrangements of the TRB were determined using 3 BIOMED-2 multiplex PCR reactions on genomic DNA and visualized using GeneScan as previously described.40 TRG gene rearrangements were determined using the optimized 1-reaction GeneScan assay.41 Primers for all functional (rearrangeable) Vγ families (Vγ1f, Vγ9, Vγ10, Vγ11) were included together with Jγ1 and Jγ2 primers. TRD gene rearrangements40 using the IdentiClone assay (Invivoscribe) included 6 Vδ primers recognizing all 6 classical Vδ gene segments, all 4 Jδ primers and 1 Dδ3 primer.
Results
RAG1-SCID patient samples
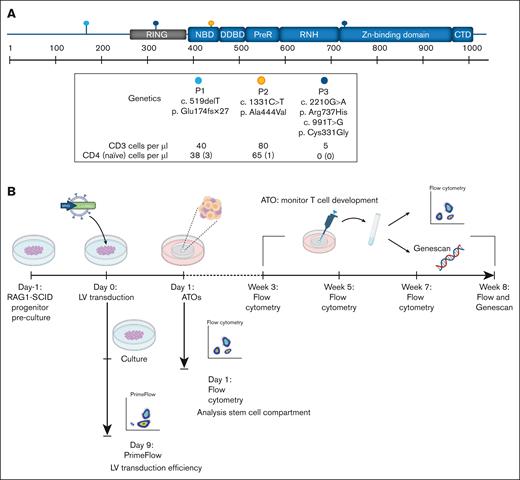
All 3 RAG1-SCID patients presented with low TCR excision circles levels picked up by national newborn screening42 and had different RAG1 mutations that led to a near complete absence of (αβ) T and B cells and ≤3 naïve T cells per μL (Figure 1A). Patient 2 had γδ T-cell expansion together with an active cytomegalovirus infection, a phenomenon reported previously.43-45 Patient 1 had an early homozygous frameshift with a resulting stop codon (c.519delT, p.Glu174fsX27). For this mutation, remaining RAG1 activity of 0.5% was previously reported based on an in vitro recombination assay.8 Patient 2 had a homozygous missense mutation in the nonamer-binding domain (c.1331C>T, p. Ala444Val) with a previously reported 1.4% residual in vitro RAG1 activity.8 Patient 3 had compound heterozygous missense mutations for c.2210G>A, p.Arg737His (0.2% in vitro activity) in the zinc-binding domain, and c.991T>G, p(Cys331Gly) in the zinc finger RING type domain (in vitro activity unknown).8
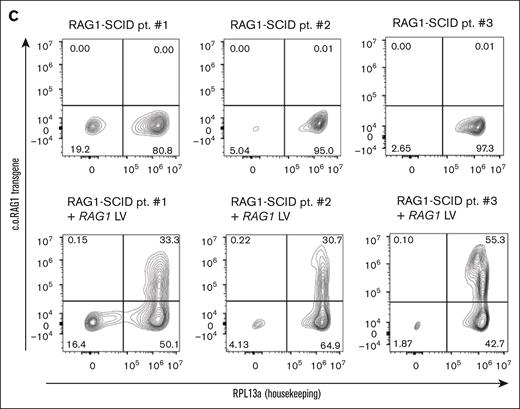
MND-c.o.RAG1 lentivirus (LV) efficiently transduces HSPCs from RAG1-SCID patients. (A) Schematic representation of the location of the RAG1 mutations in the 3 RAG1-SCID patients, including the specific mutation and the cell count of CD3, CD4, and naïve CD4 cells per microliter of blood. The N-terminal noncore domain consists of a series of basic motifs (not depicted) and a domain formed by a RING finger and zinc finger motif. The core domain consists of NBD, DDBD, PHD, preR, RNH, zinc-binding domain, and the CTD. Based on Notarangelo et al. with permission.1 (B) Experimental setup created with biorender.com. Canté-Barrett, K. (2025) https://biorender.com/gz8bj0t (C) Primeflow analysis of patient samples 1 to 3 before and after LV transduction with MND-c.o.RAG1. RPL13a: housekeeping mRNA, c.o.RAG1: codon-optimized RAG1 mRNA, as measured by flow cytometry. CTD, carboxy-terminal domain; DDBD, dimerization and DNA-binding domain; NBD, nonamer-binding domain; PHD, plant homeodomain; preR, pre-RNase H; pt, patient; RNH, catalytic RNase H.
MND-c.o.RAG1 lentivirus (LV) efficiently transduces HSPCs from RAG1-SCID patients. (A) Schematic representation of the location of the RAG1 mutations in the 3 RAG1-SCID patients, including the specific mutation and the cell count of CD3, CD4, and naïve CD4 cells per microliter of blood. The N-terminal noncore domain consists of a series of basic motifs (not depicted) and a domain formed by a RING finger and zinc finger motif. The core domain consists of NBD, DDBD, PHD, preR, RNH, zinc-binding domain, and the CTD. Based on Notarangelo et al. with permission.1 (B) Experimental setup created with biorender.com. Canté-Barrett, K. (2025) https://biorender.com/gz8bj0t (C) Primeflow analysis of patient samples 1 to 3 before and after LV transduction with MND-c.o.RAG1. RPL13a: housekeeping mRNA, c.o.RAG1: codon-optimized RAG1 mRNA, as measured by flow cytometry. CTD, carboxy-terminal domain; DDBD, dimerization and DNA-binding domain; NBD, nonamer-binding domain; PHD, plant homeodomain; preR, pre-RNase H; pt, patient; RNH, catalytic RNase H.
Efficient LV transduction of CD34+ HSPCs from RAG1-deficient patients with SCID
Prior to analyzing the patients’ HSPCs for their potential to differentiate into T cells, before and after lentiviral RAG1 gene correction, we determined the transduction (correction) efficiency. The SIN-MND-c.o.RAG1 LV vector was used to correct RAG1 expression and activity in HSPCs. CD34+ HSPCs were maintained for 9 days to determine the true transduction efficiency (Figure 1B). Nine days was chosen to exclude the measurement of any “pseudotransduction” of cells that may retain nonintegrated vector in the first days after transduction. Due to the technical challenges of reliable RAG1 protein quantification with currently available antibodies, we directly measured c.o.RAG1 messenger RNA expression using PrimeFlow as a determinant of transduction efficiency.37 Transduction efficiencies varied between ∼30% and 50% (Figure 1C). The VCN determined by quantitative PCR was 4.3, 4.0, and 4.3 per cell for the 3 patient samples, respectively.
CD34+ HSPCs from RAG1-SCID patients have a uniform stem and progenitor phenotype at the start of the ATOs
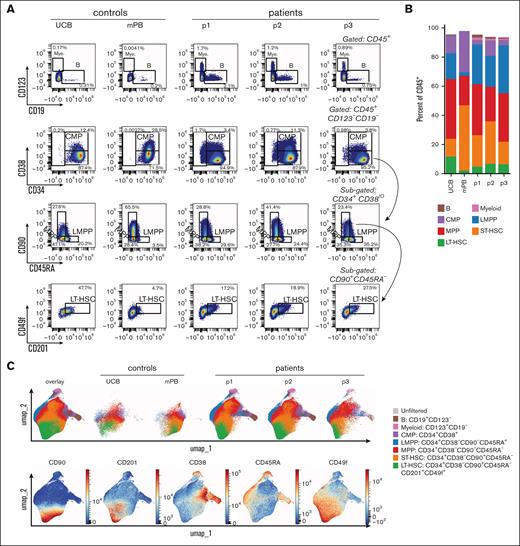
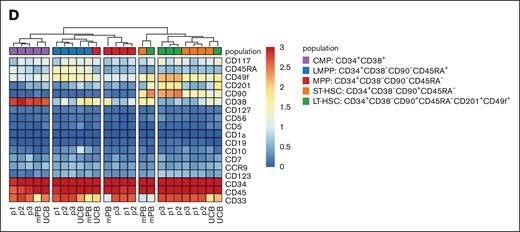
Because of the necessary patients’ stem cell mobilization and subsequent culturing of the CD34+ enriched HSPCs, we set out to test whether at the start of the ATOs these HSPCs would vary in their phenotype. As controls, CD34+ HSPCs from UCB and mPB were included. As starting material for the ATOs, after a total of 2 days (controls) or 3 days (patients’ HSPCs) in culture (see “Methods”), the HSPCs are all still mostly positive for CD34 (Figure 2A). HSPCs from the 3 patients have a low percentage of CD10+CD19+ B and CD123+ myeloid cells. These populations were hardly present in the mPB and UCB controls (Figure 2A-B). The frequency of the common myeloid progenitors, lymphomyeloid primed progenitors, multipotent progenitors and short-term and long-term HSCs within the 3 patient samples was fairly consistent (Figure 2B). Noteworthy, control mPB had the lowest long-term HSC percentage of 2.2% (within the total CD45+ population), whereas UCB had the highest with 11.5% (Figure 2B). Furthermore, both controls differed significantly from the patients’ CD34+ HSPCs, as revealed by the absence of the B, myeloid and common myeloid progenitors populations (brown, pink, and purple in Figure 2C) and by the relatively lower CD33 and higher CD38 expression in control samples (Figure 2D). The unbiased generation of a UMAP based on the expression of a selected set of 17 markers (as shown in Figure 2D with the exception of CD10; supplemental Table 1) resulted in similar populations as defined by the manual gating in Figure 2A (Figure 2C). The 3 patient samples mostly overlapped in the UMAP (Figure 2C) and the individual patients’ CD34+ HSPCs hierarchically clustered in the heat map with limited interpatient variation in phenotype (Figure 2D). Therefore, while different from controls, CD34+ HSPCs from RAG1-SCID patients have a comparable and uniform phenotype at the start of the ATOs.
HSPCs from RAG1-SCID patients have a uniform stem and progenitor phenotype at the start of the ATOs. Gated populations within the CD34+-enriched HSPCs are defined as follows, in addition to positive gating for CD45: B cells, CD19+CD123–; myeloid, CD123+CD19–; CMP (common myeloid progenitor), CD34+CD38+; LMPP (lymphomyeloid primed progenitors), CD34+CD38–CD90–CD45RA+; MPP (multipotent progenitor), CD34+CD38–CD90–CD45RA–. Short-term HSC: CD34+CD38–CD90+CD45RA–. Long-term HSC: CD34+CD38–CD90+CD45RA–CD201+CD49f+. Controls from UCB and mPB; patients: p1, p2, and p3. (A) Flow cytometry plots of gated populations, as indicated. (B) Relative distribution of the different HSPC populations. (C) UMAP based on 17 markers as shown in panel D with the exception of CD10 (supplemental Table 1), including 3 patient and 2 control samples. A total of 643 743 CD45+ cells are included. The different progenitor populations (as gated in panel A) are overlaid (top row, left) and separately (others, top row), as well as the overlaid expression of selected markers (bottom row). Red, high expression; blue, low/no expression. (D) Heat map of gated CD34+ HSPCs based on the median expression of all markers. The small B-cell and myeloid cell populations from 2C were only present in patients’ HSPCs and omitted from the heat map.
HSPCs from RAG1-SCID patients have a uniform stem and progenitor phenotype at the start of the ATOs. Gated populations within the CD34+-enriched HSPCs are defined as follows, in addition to positive gating for CD45: B cells, CD19+CD123–; myeloid, CD123+CD19–; CMP (common myeloid progenitor), CD34+CD38+; LMPP (lymphomyeloid primed progenitors), CD34+CD38–CD90–CD45RA+; MPP (multipotent progenitor), CD34+CD38–CD90–CD45RA–. Short-term HSC: CD34+CD38–CD90+CD45RA–. Long-term HSC: CD34+CD38–CD90+CD45RA–CD201+CD49f+. Controls from UCB and mPB; patients: p1, p2, and p3. (A) Flow cytometry plots of gated populations, as indicated. (B) Relative distribution of the different HSPC populations. (C) UMAP based on 17 markers as shown in panel D with the exception of CD10 (supplemental Table 1), including 3 patient and 2 control samples. A total of 643 743 CD45+ cells are included. The different progenitor populations (as gated in panel A) are overlaid (top row, left) and separately (others, top row), as well as the overlaid expression of selected markers (bottom row). Red, high expression; blue, low/no expression. (D) Heat map of gated CD34+ HSPCs based on the median expression of all markers. The small B-cell and myeloid cell populations from 2C were only present in patients’ HSPCs and omitted from the heat map.
RAG1 gene therapy rescues in vitro T-cell differentiation
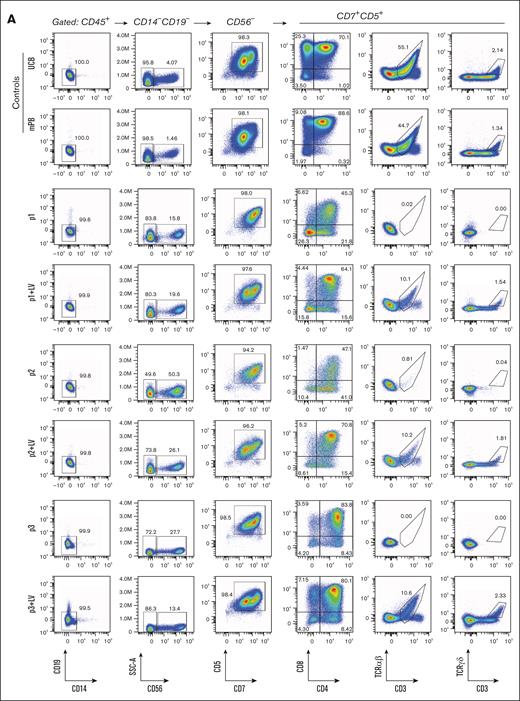
The RAG1-corrected and noncorrected HSPCs from RAG1-SCID patients were monitored for T-cell development in ATOs for 8 weeks. As controls, both UCB and mPB performed similarly, with UCB differentiation slightly outperforming that of mPB as measured by a higher percentage of CD8+ T cells after 8 weeks in the ATO (Figure 3). Since the patients’ cells had been cultured in the presence of interleukin 3 (IL-3) for the first day, this may affect the results with regard to the differentiation toward T cells. However, preculturing for the whole 3 days with or without IL-3 led to no significant difference in differentiation of mPB and UCB progenitors (not shown); thus, we continued our experiments without IL-3 during preculture.
MND-c.o.RAG1 LV correction (+LV) rescues in vitro T-cell development of HSPCs from RAG1-SCID patients (p1-p3). (A) Flow cytometry of week 8 ATOs. CD7+CD5+ and subsequent T-cell plots are gated on live CD45+CD14–CD19–CD56– cells. (B) Absolute cell number per ATO (week 8) of live CD45+ and subpopulations, as indicated.
MND-c.o.RAG1 LV correction (+LV) rescues in vitro T-cell development of HSPCs from RAG1-SCID patients (p1-p3). (A) Flow cytometry of week 8 ATOs. CD7+CD5+ and subsequent T-cell plots are gated on live CD45+CD14–CD19–CD56– cells. (B) Absolute cell number per ATO (week 8) of live CD45+ and subpopulations, as indicated.
The early development up to the CD7+/CD5+ stage is unaffected in percentage and absolute cell number in noncorrected cells from RAG1-SCID patients when compared to the RAG1-corrected cells. After gating out CD34, CD19, CD14, CD33, and CD56, all samples are >95% CD7+/CD5+. Since RAG1 is required for TCR gene recombination at the time of T-cell commitment prior to reaching the CD4/CD8 DP stage, it is expected that cells do not fully transition into the DP stage. In line with previous reports,4,28 we observed a relatively robust DP population in RAG1-deficient cells, even though they have reduced CD8 expression intensity and reduced total DP cell numbers (Figure 3A-B). As in RAG1-SCID patients, mature CD3+ T cells are (nearly) absent. Prior to gene therapy, patient 2 had no αβ T cells and some γδ T-cell expansion in the context of an active cytomegalovirus infection, but the noncorrected HSPCs from patient 2 yielded no αβ and γδ T cells in ATOs (Figure 3A). All RAG1-corrected HSPCs had ∼30% RAG1 LV transduction and differentiate into αβ and γδ T cells in ATOs comparable to controls, albeit less efficiently than controls.
RAG1-SCID HSPCs progress to the DP stage, but with a different immunophenotype than those differentiated from healthy control or RAG1-corrected HSPCs
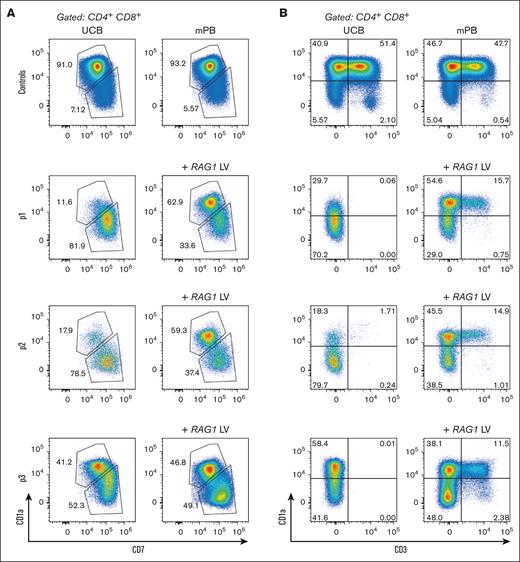
TCR rearrangement occurs in DN and ISP developing thymocytes, but also in the CD3-negative CD4/CD8 DP stage.26 While the T-cell development is arrested with some (CD3-negative) CD4/CD8 DP cells remaining in the absence of RAG1 and thus in the absence of TCR rearrangement,4,28 these DP cells are aberrant in the sense that they have dim CD8 expression when compared to controls. We noticed that CD7 expression of these aberrant RAG1-deficient DP cells remains high. In contrast, the CD4/CD8 DP cells in control and RAG1-corrected cells have dim CD7 and bright CD8 expression at week 8 of the ATO culture (Figure 3A), suggesting that positively selected DP cells are CD7dim. This prompted us to assess CD1a expression in the context of CD7 expression. CD1a expression on immature thymocytes marks T-cell commitment already at the CD4/CD8 DN stage, as these cells have irreversibly adopted the T-cell fate at the initiation of TCR rearrangement.23,24 In ATOs, acquisition of CD1a appears to coincide with CD7 downregulation at the DP stage in UCB and mPB control cells (supplemental Figure 1), as well as in the RAG1-corrected patient cells, and this CD1a+CD7dim population is nearly absent or much reduced in arrested RAG1-SCID cells from 2 of 3 patients (Figure 4A). Even though RAG-deficient cells reach the CD4/CD8 DP stage, most of these do not follow the conventional CD1a+CD7dim path prior to CD3 acquisition (Figure 4B). The third RAG1-deficient sample arrested with a larger CD1a+CD7dim population, indicating that the percentage of cells that progress to the CD1a+CD7dim stage is slightly different between patients. Whether this is due to subtle differences in residual RAG1 activity is unknown. However, all RAG1-deficient samples have in common that they do not generate mature CD3+ T cells (Figures 3 and 4B), consistent with the RAG1-SCID phenotype of the patients (Figure 1A).
RAG1-SCID HSPCs progress to the DP stage, but with a different immunophenotype than those differentiated from healthy control or RAG1-corrected HSPCs. Flow cytometry of week 8 ATOs. CD7×CD1a (A) and CD3×CD1a (B) flow cytometry plots of CD4/CD8 DP controls and patient cells without and with RAG1 (+LV) correction.
RAG1-SCID HSPCs progress to the DP stage, but with a different immunophenotype than those differentiated from healthy control or RAG1-corrected HSPCs. Flow cytometry of week 8 ATOs. CD7×CD1a (A) and CD3×CD1a (B) flow cytometry plots of CD4/CD8 DP controls and patient cells without and with RAG1 (+LV) correction.
RAG1-SCID cells lack TCR αβ rearrangement and have limited TCR γδ rearrangement at the DNA level, which is rescued after RAG1 gene therapy
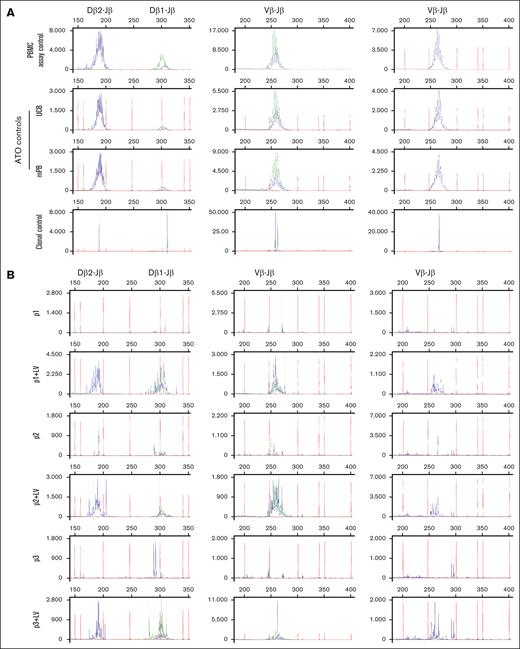
In addition to the phenotypic maturation as measured by surface markers (Figures 3 and 4), we assessed the clonality of TCR-rearranged cells in week 8 ATOs (Figures 5 and 6). GeneScan analysis revealed a polyclonal TRB repertoire in UCB and mPB control samples that is indistinguishable from peripheral blood mononuclear cells (PBMCs) from a healthy donor. This result indicates that the ATO system is capable of supporting development into a polyclonal T-cell repertoire. Our RAG1-corrected patient cells also led to a polyclonal TRB repertoire, even though the total output of CD3 T-cell numbers after 8 weeks is much lower than from controls, in part due to the fact that the starting population contained only ∼30% transduced (corrected) cells. The noncorrected patient cells arrested during development and exhibited no TRB rearrangement, consistent with the flow cytometry data.
In vitro differentiated T cells from healthy control and MND-c.o.RAG1-rescued RAG1-SCID patient HSPCs show comparable TRB diversity to healthy PBMCs. GeneScan visualization of Dβ-Jβ (left column) and Vβ-Jβ (middle and right columns) TCR gene rearrangements using DNA from week 8 ATOs. Primers covering Dβ1, Dβ2, Jβ1.1-1.6 and Jβ2.1-2.6 and all 23 Vβ families were included. The Jβ1 cluster (Jβ1.1-6) is shown in green, the Jβ2 cluster (Jβ2.1-7) in blue. For the Vβ-Jβ rearrangements, the 13 Jβ primers were divided over 2 reactions: the middle column includes the first 9, Jβ1.1-1.6 and Jβ2.2, 2.6, 2.7 and the right column includes the remaining 4 (Jβ2.1, 2.3-2.5). (A) TRB rearrangements in healthy control PBMCs (used as polyclonal assay control), ATOs with differentiated mPB and UCB CD34+ HSPCs and a clonal assay control (cell line40) for comparison. (B) ATOs with differentiated patients’ CD34+ HSPCs, corrected (+LV) and noncorrected.
In vitro differentiated T cells from healthy control and MND-c.o.RAG1-rescued RAG1-SCID patient HSPCs show comparable TRB diversity to healthy PBMCs. GeneScan visualization of Dβ-Jβ (left column) and Vβ-Jβ (middle and right columns) TCR gene rearrangements using DNA from week 8 ATOs. Primers covering Dβ1, Dβ2, Jβ1.1-1.6 and Jβ2.1-2.6 and all 23 Vβ families were included. The Jβ1 cluster (Jβ1.1-6) is shown in green, the Jβ2 cluster (Jβ2.1-7) in blue. For the Vβ-Jβ rearrangements, the 13 Jβ primers were divided over 2 reactions: the middle column includes the first 9, Jβ1.1-1.6 and Jβ2.2, 2.6, 2.7 and the right column includes the remaining 4 (Jβ2.1, 2.3-2.5). (A) TRB rearrangements in healthy control PBMCs (used as polyclonal assay control), ATOs with differentiated mPB and UCB CD34+ HSPCs and a clonal assay control (cell line40) for comparison. (B) ATOs with differentiated patients’ CD34+ HSPCs, corrected (+LV) and noncorrected.
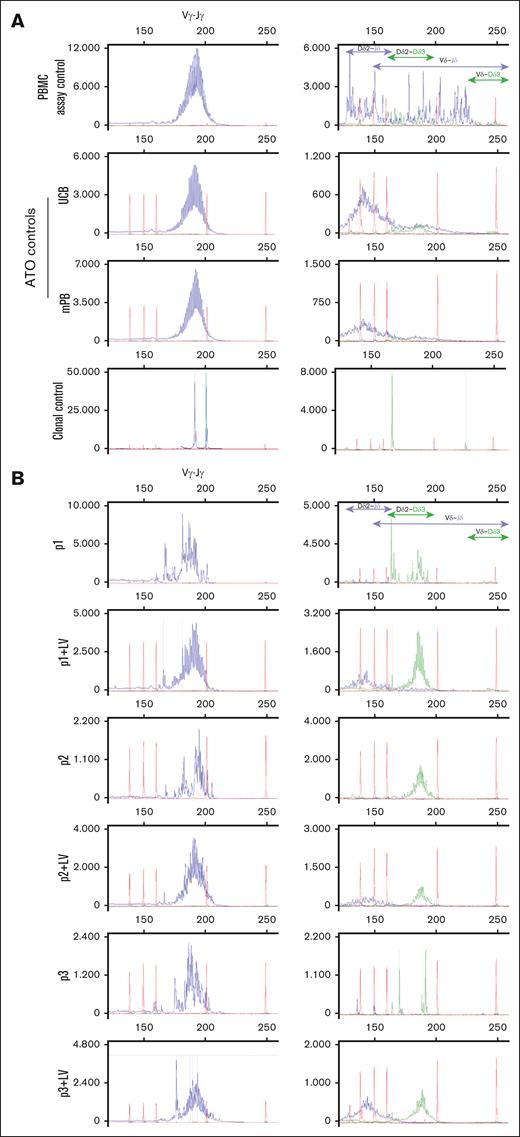
In vitro differentiated γδ T cells from MND-c.o.RAG1-rescued RAG1-SCID patient HSPCs have more immature TRD D-D rearrangements remaining compared to healthy controls. GeneScan visualization of all Vγ-Jγ rearrangements of the TRG (left column). Right column shows different Dδ2-Jδ, Dδ2-Dδ3, Vδ-Jδ and Vδ-Dδ3 rearrangements of TRD. Jδ is labeled blue and Dδ3 is green. (A) TRG and TRD rearrangements in healthy control PBMCs (used as polyclonal assay control), ATOs differentiated from mPB and UCB CD34+ HSPCs and a clonal assay control (cell line40) for comparison. (B) ATOs with differentiated patients’ CD34+ HSPCs, corrected (+LV) and noncorrected.
In vitro differentiated γδ T cells from MND-c.o.RAG1-rescued RAG1-SCID patient HSPCs have more immature TRD D-D rearrangements remaining compared to healthy controls. GeneScan visualization of all Vγ-Jγ rearrangements of the TRG (left column). Right column shows different Dδ2-Jδ, Dδ2-Dδ3, Vδ-Jδ and Vδ-Dδ3 rearrangements of TRD. Jδ is labeled blue and Dδ3 is green. (A) TRG and TRD rearrangements in healthy control PBMCs (used as polyclonal assay control), ATOs differentiated from mPB and UCB CD34+ HSPCs and a clonal assay control (cell line40) for comparison. (B) ATOs with differentiated patients’ CD34+ HSPCs, corrected (+LV) and noncorrected.
Unlike for the absent TRB, the patient cells all had limited, but clearly detectable, TRG and TRD DNA rearrangement (Figure 6), but no significant γδ T cells as observed by flow cytometry (Figure 3). The TRD DNA rearrangements can be subdivided in earliest, temporary Dδ2-Dδ3 (green) and the subsequent Dδ2-Jδ (blue) rearrangements within the TRA locus that are removed upon complete TRA rearrangement, and final variable diversity joining rearrangements (blue) that contribute to the γδ TCR. The former are present in immature, developing cells in the thymus and in the ATO, while the latter are expected in mature circulating T cells as seen in the healthy PBMC control (Figure 6, right column). Dδ2-Dδ3 is the first, but nonfunctional and noncommittal TCR rearrangement after which cells can still be diverted to other lineages.24,46 Accordingly, the UCB and mPB controls from the ATOs have more immature Dδ2-Dδ3 and early Dδ2-Jδ rearrangements than the PBMC assay control, that also has Vδ-Jδ and Vδ-Dδ3 rearrangements, indicative of the mixture of immature and mature developing cells from HSPC to T cells in the ATOs. Even more immature Dδ2-Dδ3 rearrangements are observed in the RAG1-corrected developing cells, the presence of which indicates that they have not been removed by subsequent TRA rearrangements that would succeed TRB rearrangement. Indeed, TRB rearrangement is lagging behind quantitatively in developing RAG1-corrected cells, at least in part explained by the abovementioned fact that only ∼30% of developing HSPCs had been transduced with the RAG1 LV vector.
Discussion
Here, we have characterized the T-cell development of HSPCs from RAG1-SCID patients in the ATO model system, which we cannot investigate in the patients directly. In addition to the noncorrected HSPCs, we also use the ATO system to report that lentivirally corrected RAG1-SCID HSPCs can develop into αβ and γδ T cells with a polyclonal TCR-rearranged repertoire. Noncorrected patient cells do not recombine in the absence of functional RAG1, and do not generate CD3+ T cells in vivo and in the ATOs. While in human thymocytes it is thought that recombination is initiated prior to the CD4/CD8 DP stage, we still observed DP cells in the absence of RAG1 in the ATO cultures. However, RAG1-deficient cells do not gain CD3 and TCR surface marker expression at this stage. These findings are in line with previous ATO studies on RAG-SCID patient cells that revealed DP cell development,4 while the same RAG2-SCID patient cells did not yield DP cells in the modified OP9-ATO system of a companion paper.30 Moreover, prior to the appearance of the CD3/TCR complex, CD1a is a marker for the commitment of developing cells to the T-lineage while having lost the ability to become myeloid, NK or B cells,23,25,46 which, at least in vitro, accompanies CD7 downregulation. Notably, we show that in ATOs this CD1a+CD7dim population arises at the CD4/CD8 DP stage, while ex vivo the first CD1a positive population arises within human CD34+ CD4/CD8 DN thymocytes.24 Most RAG1-deficient cells that show an arrest with remaining aberrant CD3–, CD4+/CD8dim DP cells that lack this CD1a upregulation and CD7 downregulation, in line with the RAG1 requirement for TCR gene recombination that defines T-cell commitment. However, some RAG1-SCID cells did reach the CD1a+ stage, as seen especially in the third patient’s sample. The observed differences between the samples could be an indication that different RAG1 mutations with a near complete absence of T cells can lead to slightly different phenotypes. Alternatively, and in line with our GeneScan data, the very low remaining recombinase activity in these patients’ cells may be sufficient for some cells to have limited TRG/TRD recombination and progress to the CD3 DP stage. In this light, it would be interesting to investigate the phenotypic arrest of true RAG1-null cells, making use of knockout induced pluripotent stem cells.47 In conclusion, it appears that T-cell commitment at the phenotype (CD1a+) and genotype level (RAG-mediated recombination) do not always correlate in RAG1-deficient cells and surface marker expression is not reliable to indicate developmental stages in mutant cells.
GeneScan uses multiplex PCR assays, developed in a BIOMED-2 collaborative study.40,41 It has been standardized and clinically validated for reliable detection of clonally rearranged TCRs at the DNA level. Here, we not only report TRB gene rearrangements, but also include TRG and TRD DNA rearrangement analysis, something unprecedented in ATOs for which only TRB analysis has been reported.28,33,34,48,49 While the absence of TRB rearrangement in the 3 patients matches the absence of developing αβ T cells in ATOs, we observe a discrepancy for γδ T cells; while ATOs still do not produce γδ T cells, clear, albeit limited, TRG and TRD DNA rearrangements are detectable in the developing cells. Admittedly, GeneScan is a bulk PCR-based assay that does not reveal the percentage of recombined cells, but likely indicates the amplification of a small percentage of all cells from the ATO. Nonetheless, the fact that limited TRG/TRD rearrangement occurs in RAG1-SCID patients’ cells during their development toward T cells suggests a lower RAG dependence in the recombination of certain TRG (Vγ-Jγ) and TRD (Dδ2-Dδ3) gene rearrangements and “spontaneous” recombination potential. The earliest Dδ2-Dδ3 and the subsequent Dδ2-Jδ rearrangements are deleted when the TRA locus recombines, and can thus be seen as representative of immature, developing cells that do not have any TCR. Dδ2-Dδ3 is the first, but nonfunctional and noncommittal TCR rearrangement after which cells can still be diverted to other lineages.24,46 Notably, the other TRD gene recombinations do not occur in noncorrected developing RAG1-SCID cells and the T cell committing Dδ2-Jδ recombination is rescued after RAG1 gene correction; therefore, this functional TRD recombination event is dependent on (more) RAG activity. This explains the absence of γδ T cells in noncorrected developing RAG1-SCID cells, even when limited TRG (Vγ-Jγ) gene rearrangement takes place. TRD gene recombinations involving the V gene (Vδ-Dδ3 and Vδ-Jδ) are not detected in noncorrected and corrected patient cells, but are also barely seen in UCB and mPB-derived T cells from ATOs. Overall, the healthy control PBMCs only contain mature cells with a mature TRD rearrangement pattern that is distinct from ATO-derived γδ T cells.
The reliability of ATOs to support the development of a polyclonal T-cell repertoire from various progenitors highlights their potential as a versatile in vitro model for studying T-cell development from different HSPCs derived from healthy individuals. In addition, the ATO system allows for precise characterization of T-cell developmental blocks in patients with various forms of inborn errors of immunity, such as RAG1-SCID but also other forms of (hypomorphic) RAG1 deficiency, and provides a platform to assess the intrinsic capacity of patient-derived hematopoietic cells to undergo T-cell differentiation.4,28,29,50 This is particularly important for patients with severe T-cell lymphopenia without a known genetic cause for whom clinicians need to decide whether hematopoietic stem cell transplantation would be a curative treatment or not.50
Beyond disease modeling, ATOs have emerged as a promising preclinical tool for evaluating gene therapy strategies. Of note, the cell product for RAG-SCID patient 1 had a VCN of 0.35 and was initially used in ATOs due to excess leftover material. We subsequently transduced all patient cells in the laboratory (resulting in a higher VCN of ∼4) for equal comparison of the 3 patient samples. The ATO results between cells from patient 1 with VCNs 0.35 and 4.3 (with transduction percentages of 15% and 33%, respectively) were very similar regarding the output in percentages of αβ and γδ T cells. This indicates that a much lower VCN is sufficient to generate similar T-cell output in ATOs. Recently, some studies have used ATOs to test different CRISPR-Cas9 gene editing33,48,49 and base editing34 approaches for different SCID forms. However, the analysis of both αβ and γδ T cells and the LV gene addition as we report here has not been evaluated previously using this system. Here, we have shown that LV gene addition of RAG1 in RAG1-SCID HSPCs can be tested in ATOs and results in correction of the developmental block and a polyclonal T-cell repertoire.
Acknowledgments
The authors are grateful to the technical staff of the Laboratory Medical Immunology, Immunology, Erasmus Medical Center (MC), for running TR gene rearrangement assays. The authors acknowledge the flow cytometry core facility of the Leiden University Medical Center (https://www.lumc.nl/research/facilities/fcf), coordinated by T. Tak and M. Hameetman, that facilitated the use of flow cytometers.
X.M. was financially supported by the China Scholarship Council. This work is supported, in part, by European Union H2020 grant RECOMB (755170–2) and has received funding from reNEW, the Novo Nordisk Foundation for Stem Cell Research (NNF21CC0073729).
Authorship
Contribution: X.M., J.E.M., R.v.d.H., B.d.M., S.V., M.v.E., A.W.L., and S.d.K. performed research, and analyzed and interpreted data; D.B. and A.C.L. provided patient samples and lead the ongoing clinical trial NCT04797260; K.P.-O. and F.J.T.S. developed the recombination activating gene 1 lentiviral gene therapy and are responsible for the generation of the gene therapy products in the ongoing trial; F.J.T.S. funded the study; L.M.O.d.B. and K.C.-B. designed and supervised the study and wrote the manuscript; and all authors reviewed and approved the manuscript.
Conflict-of-interest disclosure: The authors declare no competing financial interests.
Correspondence: Kirsten Canté-Barrett, Department of Immunology, Leiden University Medical Center, Albinusdreef 2, 2333 ZA Leiden, The Netherlands; email: k.cante@lumc.nl; and Lisa M. Ott de Bruin, Department of Pediatrics, Stem Cell Transplantation Program and Laboratory for Pediatric Immunology, Willem-Alexander Children's Hospital, Leiden University Medical Center, Albinusdreef 2, 2333 ZA Leiden, The Netherlands; email: L.M.Ott_de_Bruin@lumc.nl.
References
Author notes
L.M.O.d.B. and K.C.-B. are joint last authors.
Original data are available on request from the corresponding author, Kirsten Canté-Barrett (k.cante@lumc.nl).
The full-text version of this article contains a data supplement.

