Key Points
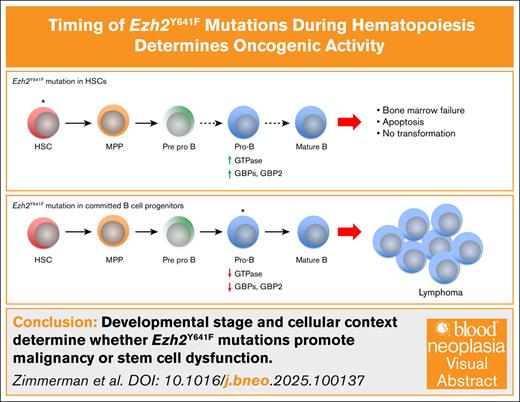
The oncogenic potential of Ezh2Y641F is determined by the timing of expression and cellular context.
Early or broad Ezh2Y641F expression disrupts hematopoiesis, causing bone marrow failure and GBP2-mediated multilineage defects.
Visual Abstract
Mutations in the histone methyltransferase enhancer of zeste homolog 2 (EZH2), particularly the neomorphic Y641F hot spot mutation, are implicated in hematologic malignancies. However, how developmental timing and cellular context influence their oncogenic potential remains poorly understood. Here, we used a conditional Ezh2Y641F allele with multiple tissue-specific Cre drivers to investigate the effects of these mutations across hematopoietic development. We found that ubiquitous or early expression of Ezh2Y641F led to bone marrow failure and reduced survival with no evidence of transformation. In contrast, expression in committed B cells using CD19-Cre consistently induced B-cell lymphomas, underscoring a context- and stage-specific requirement for transformation. Transcriptomic analysis of B-cell progenitors revealed distinct gene expression changes between Cre models, including interferon signaling and upregulation of guanylate-binding proteins (GBPs) in Mx1-Cre Ezh2Y641F mutants. We identified a redistribution of histone 3 lysine 27 trimethylation at the GBP locus and showed that GBP2 overexpression impairs multilineage hematopoiesis by promoting apoptosis and skewing differentiation. These findings demonstrate that the oncogenic potential of Ezh2Y641F is highly dependent on the cellular environment in which it is expressed and that the timing of mutation acquisition critically shapes the impact of EZH2 on hematopoiesis and disease outcome.
Introduction
Mutations in the enhancer of zeste homolog 2 (EZH2) gene, a key regulator of chromatin structure and gene expression, play crucial roles in development and malignancy. As the enzymatic subunit of the Polycomb repressive complex 2 (PRC2), EZH2 mediates the methylation of lysine 27 on histone 3 (H3K27), promoting chromatin compaction and transcriptional repression. The role of EZH2 in cancer is context dependent, acting as a tumor suppressor in some leukemias1-5 and as an oncogene in many solid tumors, including breast, lung, prostate, and melanoma.6-10
A recurrent point mutation, EZH2Y641F (or Y646, depending on isoform), in the catalytic SET domain occurs in 15% to 20% of follicular lymphoma and diffuse large B-cell lymphoma.11,12 Mouse models have shown that Ezh2 is required for germinal center (GC) formation, and the Ezh2Y641F mutant promotes GC hyperplasia and lymphomagenesis.6,8,13-15 Molecularly, Ezh2Y641 was initially thought to be a loss-of-function mutation11; however, subsequent studies showed that it exhibits neomorphic activity, preferentially methylating monomethylated or dimethylated H3K27 but requiring the presence of wild-type EZH2 for initial monomethylation.16,17 These observations are consistent with the fact that all EZH2Y641 mutations identified to date in human patients are heterozygous.12 Globally, these mutations alter the distribution of H3K27 trimethylation (H3K27me3), with increased deposition in some regions, decreased in others, and spreading of H3K27me3 past canonical boundaries.6,14,18 These findings suggest that EZH2Y641F mutations are not purely gain-of-function mutations but likely neomorphic.
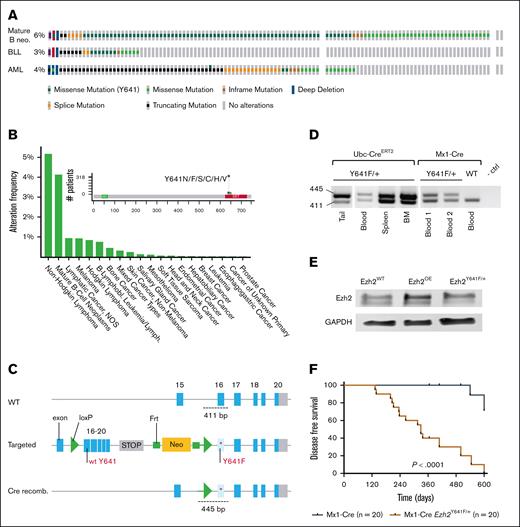
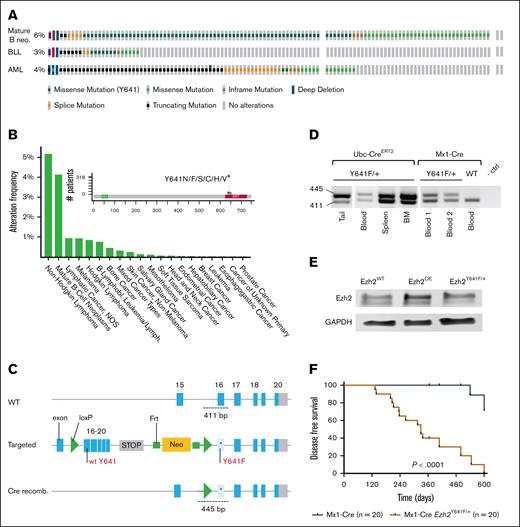
Ezh2Y641F mutations are most frequent and well studied in mature B-cell lymphoma; however, the mutations also appear in B-cell lymphoblastic leukemias, acute myeloid leukemia (AML), and solid tumors, such as melanoma, bone, breast, mesothelioma, and endometrial cancers (Figure 1A-B). Although Ezh2 also plays a critical role in hematopoietic stem cell functions,19-21 it is surprising that these mutations are infrequent in non–B-cell malignancies (Figure 1A-B), suggesting that developmental timing and cellular origin influence its oncogenic potential. Somatic EZH2 mutations within the SET domains also appear in Weaver syndrome, a developmental disorder characterized by accelerated skeletal maturation, intellectual disability, and increased cancer susceptibility.22-25
Expression of Ezh2Y641F in hematopoietic stem cells shortens overall survival. (A) Genetic alterations in EZH2 across mature B-cell neos, BLL, and acute myeloid leukemia (AML), analyzed using The Cancer Genome Atlas data from the Genomics Evidence Neoplasia Information Exchange (GENIE) cohort (version 16.1) on cBioPortal (B-cell neos, n = 6444; BLL, n = 911; AML, n = 3859). (B) Frequency of EZH2Y641F mutations across various cancer types, based on GENIE cohort (v16.1) data analyzed via cBioPortal. (C) Schematic of Cre-lox strategy to induce Ezh2Y641F expression from the mouse endogenous locus. (D) PCR confirmation of Ezh2 recombination in specific tissues by each Cre allele. (E) Western blot for Ezh2 protein expression in the indicated genotypes. (F) Disease-free survival curves for Mx1-Cre Ezh2Y641F compared to Cre-only ctrls (log-rank test P < .0001); median survival for Mx1-Cre Ezh2Y641F mice is 329 days. BLL, B Lymphoblastic Leukemia; BM, bone marrow; ctrl, control; GAPDH, Glyceraldehyde-3-phosphate Dehydrogenase; Lymph, lymphoma; neo, neoplasm; NOS, not otherwise specified; OE, overexpression; recomb., recombination; WT, wild-type.
Expression of Ezh2Y641F in hematopoietic stem cells shortens overall survival. (A) Genetic alterations in EZH2 across mature B-cell neos, BLL, and acute myeloid leukemia (AML), analyzed using The Cancer Genome Atlas data from the Genomics Evidence Neoplasia Information Exchange (GENIE) cohort (version 16.1) on cBioPortal (B-cell neos, n = 6444; BLL, n = 911; AML, n = 3859). (B) Frequency of EZH2Y641F mutations across various cancer types, based on GENIE cohort (v16.1) data analyzed via cBioPortal. (C) Schematic of Cre-lox strategy to induce Ezh2Y641F expression from the mouse endogenous locus. (D) PCR confirmation of Ezh2 recombination in specific tissues by each Cre allele. (E) Western blot for Ezh2 protein expression in the indicated genotypes. (F) Disease-free survival curves for Mx1-Cre Ezh2Y641F compared to Cre-only ctrls (log-rank test P < .0001); median survival for Mx1-Cre Ezh2Y641F mice is 329 days. BLL, B Lymphoblastic Leukemia; BM, bone marrow; ctrl, control; GAPDH, Glyceraldehyde-3-phosphate Dehydrogenase; Lymph, lymphoma; neo, neoplasm; NOS, not otherwise specified; OE, overexpression; recomb., recombination; WT, wild-type.
Mechanistically, Ezh2Y641 mutations have been associated with disrupted differentiation,8 Myc signaling,6,26 p53-mediated mTORC1 signaling,27 Bcl2 and Bcl6 functions,6,8,13 and immune modulation in melanoma.6,28-30 These findings underscore the context-dependent effects of EZH2Y641F, which vary significantly based on cell type and developmental stage.
To address the gaps in understanding how developmental stage and cell of origin influence the phenotypic and oncogenic outcomes of Ezh2Y641F mutations, we investigated the effects of this mutation in a range of contexts using tissue- and cell type–specific Cre driver alleles. By focusing on phenotypic and molecular differences across stages of hematopoietic development and tumorigenesis, this study explores how the timing and context of EZH2Y641F mutations shape their downstream effects, offering novel insights into their role in hematopoiesis and cancer.
Materials and methods
Mice
All mice were backcrossed to C57Bl/6 and housed in an Association for Assessment and Accreditation of Laboratory Animal Care–accredited facility and treated in accordance with protocols approved by the Institutional Animal Care and Use Committees for animal research at The University of North Carolina at Chapel Hill and Washington University in St. Louis. Both male and female mice were included in all experiments.
Genotyping and induction of Ezh2Y641F allele recombination
Tail genomic DNA was used for genotyping Cre and Ezh2Y641F alleles using polymerase chain reaction (PCR). Mx-Cre expression was induced by intraperitoneal injection of polyinosinic-polycytidylic acid (poly(I:C); Sigma P0913), 3 injections every other day at 300 μg per dose. Induction of the Ubc-CreERT2 allele was induced by intraperitoneal injections of tamoxifen dissolved in corn oil at 75-mg tamoxifen per kg body weight, 2 and 4 days after birth. Tissue-specific CD19- and Prx1-Cre alleles are constitutive. Recombination of the Ezh2Y641F allele was confirmed by PCR (primer sequences in supplemental Table 2).
Competitive bone marrow transplantation assays
Donor bone marrow was collected from the femora and tibiae. Lethally irradiated recipient mice (10.5 Gy; split dose) received an IV mixture of CD45.2 donor and CD45.1 wild-type competitor bone marrow (500 000 cells each). Both male and female mice aged 8 weeks were used as transplant recipients. For guanylate-binding protein 2 (GBP2) overexpression, human GBP2 was cloned into MSCV-IRES-GFP retroviral vector. ckit+ cells were magnetically sorted from donor mice, transfected with the MSCV-GBP2-IRES-GFP virus (via Polyethylenimine [PEI] and Polybrene), cultured for 24 hours, and 50 000 cells were injected per recipient animal.
Flow cytometry
Peripheral blood was collected in potassium-EDTA tubes, and complete blood cell counts were performed using a Hemavet (Drew Scientific). Flow cytometry analysis was performed on LSRII (BD), Dako Cyan (Beckman Coulter), and Attune (Thermo Fisher Scientific) using antibodies listed in supplemental Table 1. Data were analyzed using FlowJo software (TreeStar Inc). Hematopoietic progenitor cells were identified by negative staining for lineage markers (B220, CD19, CD3, CD4, CD8, Mac1, Gr1, and Ter119) and positive for ckit and Sca1. Common lymphoid progenitors were identified as lineage negative, interleukin-7Rα positive (IL-7Rα+), ckit+, and Sca1+. Myeloid progenitors were identified as lineage negative, IL-7Rα–, ckit+, and Sca1–.
Histology
Tissues were fixed in 10% formalin, paraffin embedded (Histowiz), sectioned (4-5 μm), and stained with hematoxylin and eosin. Femurs were fixed in 10% formalin (24 hours), decalcified in 10% EDTA (pH 7.2; 5 days), and transferred to 70% ethanol. Cre immunohistochemistry (IHC; 1:100; Cell Signaling Technology; catalog no. 15036) was quantified using QuPath. Approximately 14 000 cells were analyzed per section (including cortical bone, marrow, and trabecular bone) across 2 replicates per genotype, with Cre+ cells classified by location and morphology (eg, bone marrow, osteocytes, and osteoblasts).
RNA sequencing and analysis
Pro- and pre–pro-B cells were sorted from bone marrow by Fluorescence-Activated Cell Sorting (FACS) and processed for RNA extraction using Qiagen RNeasy Micro kit (Qiagen 74004). Libraries were prepared and sequenced on an Illumina NovaSeq 6000 platform. Gene expression analysis was performed using EdgeR and Limma to determine differences between genotypes/Cres, and results were filtered for genes with Benjamini-Hochberg false discovery rate–adjusted P values ≤.05. Global perturbations in known gene ontology, Molecular Signatures Database (MSigDb), and Kyoto Encyclopedia of Genes and Genomes (KEGG) pathways were detected using generally applicable gene-set enrichment (GAGE) and weighted gene correlation network analysis.
Cell culture and generation of GBP2 overexpression cell lines
Cells were grown in RPMI 1640 (Gibco) with 10% fetal bovine serum (Millipore Sigma) and 1% penicillin-streptomycin (Genesee Scientific). GBP2 lentiviral vector (Vector Builder ID VB900000-0734xke) was packaged in 293T cells using PEI transfection.
Statistical analysis
Statistical analysis was performed using GraphPad Prism. Bar graphs represent mean ± standard deviation or standard error of the mean (as noted). Sample sizes were determined based on pilot studies and a power analysis (2-tailed, α = 0.05; power = 0.8), under the assumption of normal distribution. Differences between groups were determined using the Student t test, unless otherwise indicated.
Results
Heterozygous expression of Ezh2Y641F during early embryonic development results in developmental and hematopoietic defects and decreased survival
To investigate the oncogenic potential of Ezh2Y641F, we used a conditional allele6 crossed to 4 tissue-specific Cre drivers: tamoxifen-inducible Ubc-CreERT2,31 limb bud–specific Prx1-Cre,32 hematopoietic-specific Mx1-Cre,33 and B-cell–specific CD19-Cre (Figure 1C; supplemental Figure 1A). Ubc-CreERT2 was induced at birth (post natal day 2 and 4 [P2 and P4]), whereas the Prx1-Cre is induced around embryonic day 9.5. Mx1-Cre is active in hematopoietic stem cells (HSCs), whereas CD19-Cre begins at the pro–B-cell stage (B220mid, Immunoglobulin M [IgM]–, CD43+, and CD19+). Because germ line deletion of Ezh2 in the mouse is lethal and Ezh2Y641F mutations are heterozygous in patients, we maintained these animals as heterozygous and confirmed allele recombination in target tissues (Figure 1D).
All crosses showed reduced survival, with bone marrow failure evident in Ubc-CreERT2, Prx1-Cre, and Mx1-Cre models, whereas the CD19-Cre uniquely developed B-cell malignancies (supplemental Figure 1B), consistent with previous findings.6 Prx1-Cre mice exhibited lower body weight and joint defects (supplemental Figure 1C-D), and Ubc-CreERT2 and Prx1-Cre mice shared hematopoietic defects with the Mx1-Cre group, including anemia, enlarged spleens, and reduced peripheral B-cell output (supplemental Figure 1E-G). None of these models developed B-cell lymphoma or other malignancies, and most succumbed to bone marrow failure by 6 months (not shown). Bone marrow failure and decreased survival limited further observation of Ubc-CreERT2 and Prx1-Cre groups for other potential malignancies requiring longer latency periods.
Given these outcomes, we focused on the 2 hematopoietic-specific Cre drivers, Mx1-Cre and CD19-Cre, and hypothesized that mutation cell of origin during hematopoiesis determines the oncogenic potential of Ezh2Y641F.
Expression of Ezh2Y641F in HSCs impairs B-cell development and peripheral output
In young Mx1-Cre Ezh2Y641F mice (aged 4-10 weeks), flow cytometric analysis of peripheral blood revealed no defects. With age, these mice exhibited increased mortality (median survival, 329 days), compared to Mx1-Cre Ezh2WT controls (Figure 1F). In addition, older animals (aged 8-12 months) exhibited progressive anemia, thrombocytopenia, and lymphopenia (Figure 2A-B). Flow cytometry revealed reduced peripheral B cells and a proportional increase in myeloid cells (Figure 2C-E). To determine whether defects in B-cell differentiation contributed to this phenotype, we analyzed B-cell progenitor populations in the bone marrow of young animals (aged 3-4 months). We identified a partial block in B-cell development at the pre–pro– to pro–B-cell transition (Figure 2F-G; pre–pro-B cells [B220mid, IgM–, CD43+, and CD19–], pro-B cells [B220mid, IgM–, CD43+, and CD19+], and pre-B cells [B220mid, IgM–, CD43–, and CD19+]). These findings suggest that Mx1-Cre Ezh2Y641F disrupts early B-cell development, leading to reduced B-cell output.
Partial block in B-cell development in Mx1-Cre Ezh2Y641F mice. (A) Complete peripheral blood cell counts (CBCs) showing WBCs, NEs, LYs, RBCs, and platelets in peripheral blood from Mx1-Cre Ezh2Y641F and Mx1-Cre control mice (n > 5 per group). (B) Platelet counts from CBC analysis. (C) Flow cytometry analysis of peripheral blood in Mx1-Cre Ezh2Y641F and Mx1-Cre–only control mice (n > 5). (D) Calculated absolute numbers of B cells, T cells, and myeloid cells in the peripheral of Mx1-Cre Ezh2Y641F and Mx1-Cre control from flow cytometry in panel A and CBC in panel C. (E) Representative flow plots of data in panel C. (F) Representative flow cytometry of bone marrow B-cell progenitor populations in Mx1-Cre Ezh2Y641F and Mx1-Cre–only control mice; black box indicates pre–pro-B cells. (G) Quantification of bone marrow B-cell populations in Mx1-Cre Ezh2Y641F and Mx1-Cre control mice (n > 5). Error bars indicate standard deviation. ∗P < .01; ∗∗P < .001. LY, lymphocyte; NE, neutrophil; RBC, red blood cell; WBC, white blood cell.
Partial block in B-cell development in Mx1-Cre Ezh2Y641F mice. (A) Complete peripheral blood cell counts (CBCs) showing WBCs, NEs, LYs, RBCs, and platelets in peripheral blood from Mx1-Cre Ezh2Y641F and Mx1-Cre control mice (n > 5 per group). (B) Platelet counts from CBC analysis. (C) Flow cytometry analysis of peripheral blood in Mx1-Cre Ezh2Y641F and Mx1-Cre–only control mice (n > 5). (D) Calculated absolute numbers of B cells, T cells, and myeloid cells in the peripheral of Mx1-Cre Ezh2Y641F and Mx1-Cre control from flow cytometry in panel A and CBC in panel C. (E) Representative flow plots of data in panel C. (F) Representative flow cytometry of bone marrow B-cell progenitor populations in Mx1-Cre Ezh2Y641F and Mx1-Cre–only control mice; black box indicates pre–pro-B cells. (G) Quantification of bone marrow B-cell populations in Mx1-Cre Ezh2Y641F and Mx1-Cre control mice (n > 5). Error bars indicate standard deviation. ∗P < .01; ∗∗P < .001. LY, lymphocyte; NE, neutrophil; RBC, red blood cell; WBC, white blood cell.
Expression of Ezh2Y641F in HSCs results in skewed hematopoietic progenitor populations, high bone mass, and bone marrow failure
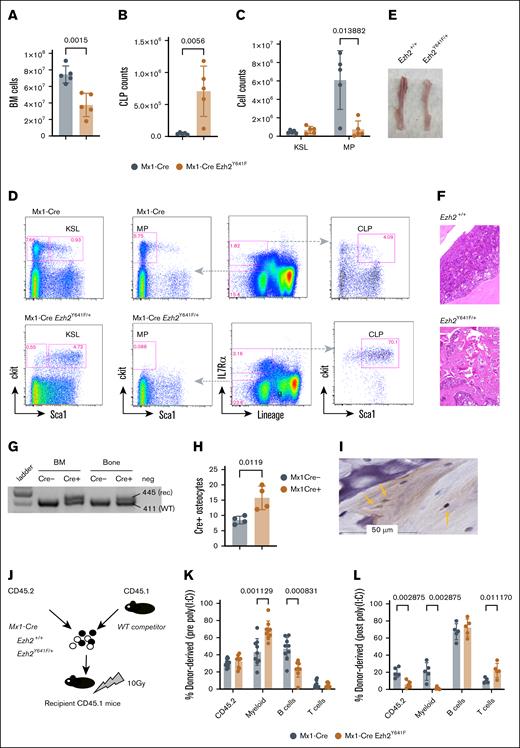
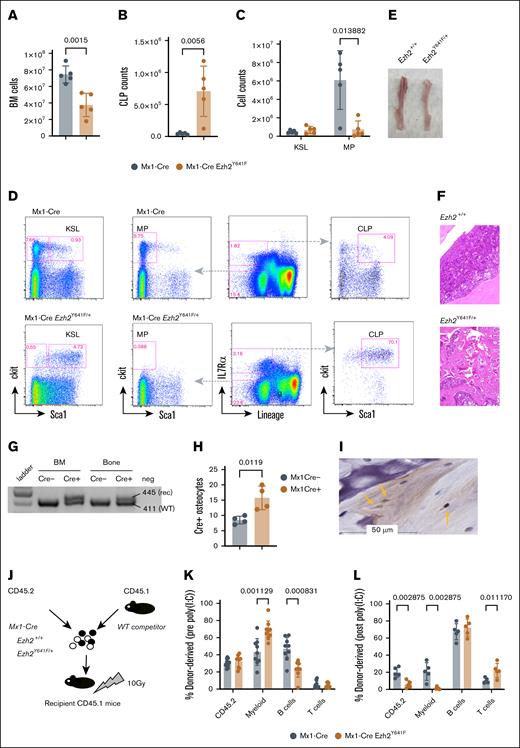
Given the oncogenic role of Ezh2Y641F mutations in lymphoma, we hypothesized that the observed phenotypes in Mx1-Cre Ezh2Y641F mice might be driven by an underlying hematopoietic malignancy. We first analyzed hematopoietic progenitor populations in the bone marrow of young mice (aged 2-3 months) and did not find any significant differences between Mx1-Cre Ezh2WT and Mx1-Cre Ezh2Y641F (data not shown). However, by 6 months, Ezh2Y641F mice exhibited decreased bone marrow cellularity (Figure 3A) and skewing of hematopoietic progenitors more toward lymphoid progenitors and less toward myeloid progenitors (Figure 3B-D). The bones of Ezh2Y641F mice were pale, consistent with anemia (Figure 3E), and histology revealed increased trabecular bone mass and decreased bone marrow cellularity, suggesting altered bone remodeling (Figure 3F).
Defective cell-intrinsic hematopoietic stem cell function after induced expression of Ezh2Y641F. (A) Total BM cellularity in Mx1-Cre Ezh2Y641F mice and Mx1-Cre control mice (n = 5 per group). (B) CLP counts in BM of Mx1-Cre Ezh2Y641F and Mx1-Cre–only control mice (n = 5). (C) Analysis of KSL and MP populations. (D) Representative flow cytometry plots of BM hematopoietic progenitor populations. (E) Image of tibiae from a Mx1-Cre Ezh2Y641F mouse (right) and control (left). (F) Hematoxylin and eosin (H&E)–stained bone sections from Mx1-Cre Ezh2Y641F (bottom) and Mx1-Cre control mice (top). (G) Target allele recombination from DNA isolated from the bone and BM of the indicated genotypes. (H) Number of Cre+ osteocytes in bone sections from Mx1-Cre– and Mx1-Cre+ mice (n = 4). (I) Representative IHC image for Cre protein in Mx1-Cre+ bone sections. Yellow arrows indicate Cre+ osteocytes. (J) Workflow for competitive BM transplant assay with the indicated genotypes. (K-L) Donor cell contribution to peripheral blood chimerism before (K) and after induction (L) of Ezh2Y641F expression by poly(I:C) (n = 8 mice per group). Error bars represent standard deviation. P values as indicated, multiparameter t test. BM, bone marrow; CLP, common lymphoid progenitor; KSL, ckit+ Sca1+ lineage-negative; MP, myeloid progenitor; rec, recombination; WT, wild-type.
Defective cell-intrinsic hematopoietic stem cell function after induced expression of Ezh2Y641F. (A) Total BM cellularity in Mx1-Cre Ezh2Y641F mice and Mx1-Cre control mice (n = 5 per group). (B) CLP counts in BM of Mx1-Cre Ezh2Y641F and Mx1-Cre–only control mice (n = 5). (C) Analysis of KSL and MP populations. (D) Representative flow cytometry plots of BM hematopoietic progenitor populations. (E) Image of tibiae from a Mx1-Cre Ezh2Y641F mouse (right) and control (left). (F) Hematoxylin and eosin (H&E)–stained bone sections from Mx1-Cre Ezh2Y641F (bottom) and Mx1-Cre control mice (top). (G) Target allele recombination from DNA isolated from the bone and BM of the indicated genotypes. (H) Number of Cre+ osteocytes in bone sections from Mx1-Cre– and Mx1-Cre+ mice (n = 4). (I) Representative IHC image for Cre protein in Mx1-Cre+ bone sections. Yellow arrows indicate Cre+ osteocytes. (J) Workflow for competitive BM transplant assay with the indicated genotypes. (K-L) Donor cell contribution to peripheral blood chimerism before (K) and after induction (L) of Ezh2Y641F expression by poly(I:C) (n = 8 mice per group). Error bars represent standard deviation. P values as indicated, multiparameter t test. BM, bone marrow; CLP, common lymphoid progenitor; KSL, ckit+ Sca1+ lineage-negative; MP, myeloid progenitor; rec, recombination; WT, wild-type.
Although Mx1-Cre is largely hematopoietic specific, it can be active in osteoclasts, which are derived from myeloid precursors.34 To test whether Ezh2Y641F may be expressed in osteoclasts or osteoblasts, we isolated DNA from decalcified bones of Mx1-Cre controls and Mx1-Cre Ezh2Y641F mutant mice. We confirmed recombination of the targeted Ezh2 allele in decalcified bones (Figure 3G) and Cre expression in osteocytes by IHC (Figure 3H-I). Thus, Ezh2Y641F expression in osteocytes may affect bone resorption, contributing to increased bone mass and secondary bone marrow failure.
Expression of Ezh2Y641F in HSCs disrupts cell-intrinsic stem cell functions
Despite persistent B-cell expression of Ezh2Y641F, Mx1-Cre mice did not develop lymphoma, unlike CD19-Cre Ezh2Y641F mice, which developed B-cell neoplasia before the onset of bone marrow failure in Mx1-Cre mice.6 One explanation is that early bone marrow defects impair B-cell expansion, limiting the chance for additional oncogenic mutations that could facilitate transformation.
To test cell-intrinsic defects, we performed bone marrow transplantation assays using hematopoietic stem and progenitor cells isolated from young (8-week-old) Mx1-Cre Ezh2Y641F and Mx1-Cre control mice, before any detectable defects in progenitors or cellularity. Equal numbers of test donor (CD45.2) and competitor (CD45.1) bone marrow cells (500 000 each) were transplanted into lethally irradiated recipient mice (CD45.1; Figure 3H). Four weeks after transplantation, we induced Cre expression via poly(I:C) and analyzed peripheral blood chimerism 2 weeks after the last dose. Before Cre induction, lineage output was similar (Figure 3I). However, after Cre induction, recipient mice receiving Mx1-Cre Ezh2Y641F HSCs exhibited a marked decline in peripheral blood chimerism and impaired myeloid differentiation (Figure 3J), indicating a loss of self-renewal and differentiation capacity. No recipient mice developed malignancy.
Extramedullary hematopoiesis in the spleens of Mx1-Cre Ezh2Y641F mice
Splenomegaly was a consistent phenotype in Mx1-Cre Ezh2Y641F mice (Figure 4A-B). To determine whether this reflected malignancy, we analyzed splenocytes by flow cytometry and spleens by IHC. We found that Mx1-Cre Ezh2Y641F spleens had reduced numbers of B cells and increased Ter119+ erythrocytes (Figure 4D). IHC revealed disorganized architecture and ectopic hematopoietic features consistent with extramedullary hematopoiesis (Figure 4C). Flow cytometry analysis confirmed an expansion of hematopoietic progenitors in the spleens (Figure 4E).
Extramedullary hematopoiesis in Mx1-Cre Ezh2Y641F mice. (A) Spleen weight comparison in Mx1-Cre Ezh2Y641F vs Mx1-Cre–only control mice (n = 5 per group). (B) Representative images of spleen size (top) and cells in Hanks Balanced Salt Solution (HBSS) suspension (bottom). (C) H&E-stained spleen sections showing extramedullary hematopoiesis in Mx1-Cre Ezh2Y641F and Mx1-Cre control mice. (D) Flow cytometry of blood lineage markers (B220, CD4, CD8, Mac1, and Ter119) in spleen cells from Mx1-Cre Ezh2Y641F and Mx1-Cre mice (n = 4-6). (E) Flow cytometry analysis of hematopoietic progenitor populations in spleens from Mx1-Cre Ezh2Y641F and Mx1-Cre control mice; representative of 3 independent experiments. Error bars represent standard deviation. ∗P < .01; ∗∗ P <.001.
Extramedullary hematopoiesis in Mx1-Cre Ezh2Y641F mice. (A) Spleen weight comparison in Mx1-Cre Ezh2Y641F vs Mx1-Cre–only control mice (n = 5 per group). (B) Representative images of spleen size (top) and cells in Hanks Balanced Salt Solution (HBSS) suspension (bottom). (C) H&E-stained spleen sections showing extramedullary hematopoiesis in Mx1-Cre Ezh2Y641F and Mx1-Cre control mice. (D) Flow cytometry of blood lineage markers (B220, CD4, CD8, Mac1, and Ter119) in spleen cells from Mx1-Cre Ezh2Y641F and Mx1-Cre mice (n = 4-6). (E) Flow cytometry analysis of hematopoietic progenitor populations in spleens from Mx1-Cre Ezh2Y641F and Mx1-Cre control mice; representative of 3 independent experiments. Error bars represent standard deviation. ∗P < .01; ∗∗ P <.001.
Distinct transcriptional programs in B-cell progenitors isolated from Mx1-Cre and CD19-Cre Ezh2Y641F
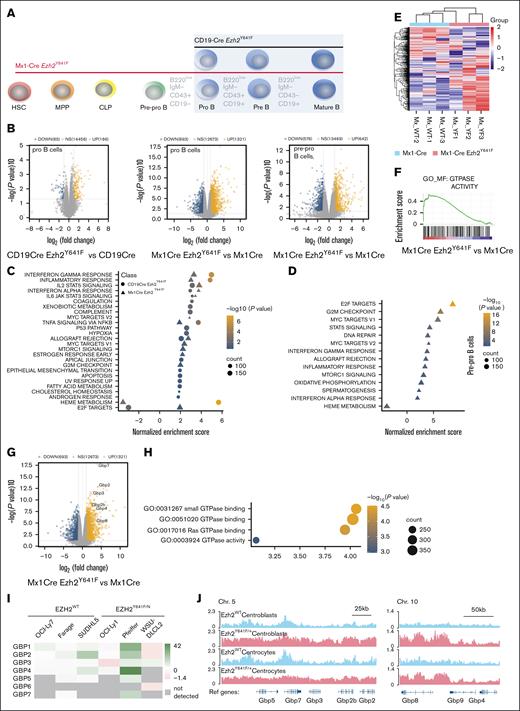
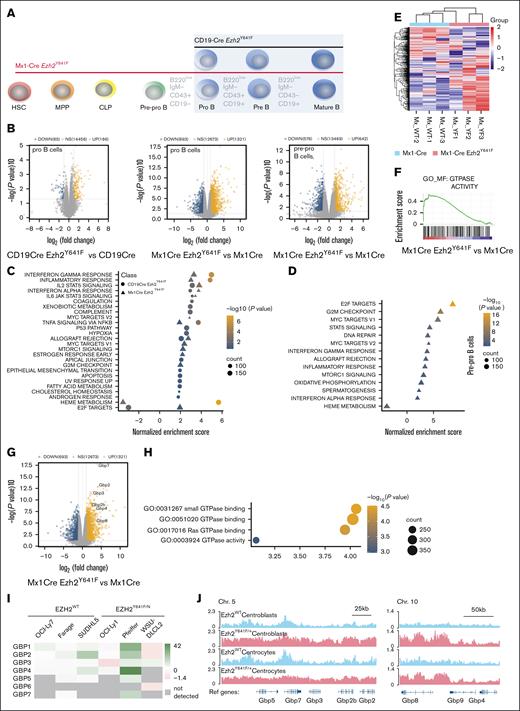
Our findings so far suggest that B-cell progenitors in Mx1-Cre Ezh2Y641F mice are intrinsically different compared to CD19-Cre Ezh2Y641F mice. To understand the underlying mechanisms that drive these phenotypic differences, we performed RNA sequencing on FACS-sorted pro-B and pre–pro-B cells (Figure 5A). To reduce variability, Mx1-Cre and CD19-Cre littermates were generated in parallel from a shared Ezh2Y641F/Y641F Cre– male. Mx1-Cre mice were treated with poly(I:C) at 12 weeks, and cells were isolated at 16 to 18 weeks, when neither genotype exhibits any hematopoietic phenotypes.
Effect of Ezh2Y641F expression timing on gene expression programs in pro- and pre–pro-B cells. (A) Experimental schematic: RNA sequencing was performed on pre–pro- and pro-B cells sorted from bone marrow of Ezh2WT and Ezh2Y641F from Mx1-Cre and CD19-Cre models. (B) Volcano plots of Differentially expressed genes (DEGs) in Ezh2Y641F vs Ezh2WT CD19-Cre pro-B (left), Ezh2Y641F vs Ezh2WT Mx1-Cre pro-B (center), and Ezh2Y641F vs Ezh2WT Mx1-Cre B pre–pro-B cells (right). (C-D). Gene set enrichment analysis of hallmark signatures in CD19-Cre (circles) and Mx1-Cre (triangles) Ezh2Y641F pro- (C) and pre–pro-B cells (D). (E) Heat map of GTPase activity genes, enriched in Mx1-Cre Ezh2Y641F pro-B cells compared to Mx1-Cre Ezh2WT control. (F) Enrichment plot for GO GTPase activity signature. (G) Volcano plot highlighting upregulated GBP genes in Mx1-Cre Ezh2Y641F vs Mx1-Cre Ezh2WT control pro-B cells. (H) GTPase-related GO terms in enriched in Mx1-Cre Ezh2Y641F vs Mx1-Cre Ezh2WT control pro-B cells. (I) GBP expression fold change after EZH2 inhibition with GSK343 in human lymphoma cell lines (data from GSE459828,14). (J) H3K27me3 ChIP-seq tracks in Ezh2WT or Ezh2Y641F mouse centroblasts and centrocytes at Gbp loci on Chrs 5 and 10 (data from GSE13803626). Chr, chromosome; GO, gene ontology; MPP, multipotent progenitors; NS, not significant; Ref, reference genome.
Effect of Ezh2Y641F expression timing on gene expression programs in pro- and pre–pro-B cells. (A) Experimental schematic: RNA sequencing was performed on pre–pro- and pro-B cells sorted from bone marrow of Ezh2WT and Ezh2Y641F from Mx1-Cre and CD19-Cre models. (B) Volcano plots of Differentially expressed genes (DEGs) in Ezh2Y641F vs Ezh2WT CD19-Cre pro-B (left), Ezh2Y641F vs Ezh2WT Mx1-Cre pro-B (center), and Ezh2Y641F vs Ezh2WT Mx1-Cre B pre–pro-B cells (right). (C-D). Gene set enrichment analysis of hallmark signatures in CD19-Cre (circles) and Mx1-Cre (triangles) Ezh2Y641F pro- (C) and pre–pro-B cells (D). (E) Heat map of GTPase activity genes, enriched in Mx1-Cre Ezh2Y641F pro-B cells compared to Mx1-Cre Ezh2WT control. (F) Enrichment plot for GO GTPase activity signature. (G) Volcano plot highlighting upregulated GBP genes in Mx1-Cre Ezh2Y641F vs Mx1-Cre Ezh2WT control pro-B cells. (H) GTPase-related GO terms in enriched in Mx1-Cre Ezh2Y641F vs Mx1-Cre Ezh2WT control pro-B cells. (I) GBP expression fold change after EZH2 inhibition with GSK343 in human lymphoma cell lines (data from GSE459828,14). (J) H3K27me3 ChIP-seq tracks in Ezh2WT or Ezh2Y641F mouse centroblasts and centrocytes at Gbp loci on Chrs 5 and 10 (data from GSE13803626). Chr, chromosome; GO, gene ontology; MPP, multipotent progenitors; NS, not significant; Ref, reference genome.
Analysis of gene expression data revealed both shared and distinct gene expression patterns between pro- and pre–pro-B cells from the 2 Cre lines. Principal component analysis showed separation between pro- and pre–pro-B cells (PC1) and distinguished Ezh2WT from Ezh2Y641F along PC3, which was stronger with Mx1-Cre mice (supplemental Figure 2A). There was only 10% overlap of differentially expressed genes between Cre models (P < .04, top 1000 genes), and the Mx1-Cre mice had more differentially expressed genes overall (Figure 5B; supplemental Figure 2B). Despite these differences, both Cre models shared enrichment for type I and II interferon (IFN) signaling, IL-2–STAT5 signaling, tumor necrosis factor α signaling (Figure 5C-D; supplemental Figure 2C-D), and KEGG signatures linked to EZH2 activity and targets, consistent with previous studies.35
Distinct signatures included Bone Morphogenesis Protein 2 (BMP2) targets (Mx1-Cre) and HOXA9-MEIS targets (CD19-Cre) (supplemental Figure 2E-G), both implicated in B-cell differentiation and transformation. Interestingly, some hallmark pathways were regulated in opposite directions; for example, E2F-targets were up in Mx1-Cre but down in CD19-Cre, whereas heme metabolism showed the reverse (Figure 5C), suggesting differential effects of Ezh2Y641F depending on developmental stage.
Transcriptomic changes in Mx1-Cre Ezh2Y641F B cells begin earlier in development
To determine whether transcriptional changes in Mx1-Cre Ezh2Y641F precede the pro-B stage, we analyzed gene expression changes in pre–pro-B cells. Pre–pro- and pro-B cells showed highly similar gene expression profiles, including enrichment for E2F and MYC targets, IFN-γ response, and depletion of heme metabolism (Figure 5D). These results suggest that early-stage expression of Ezh2Y641F shapes downstream molecular outcomes and likely contributes to the observed developmental defects.
GBPs are upregulated in Mx1-Cre Ezh2Y641F pro-B cells
Gene ontology analysis highlighted enrichment for GTPase-related genes in Mx1-Cre Ezh2Y641F pro-B cells (Figure 5E-F), including the GBP family (Figure 5G-H). GBPs are mostly associated with immune response to infections.36,37 In hematopoiesis, GBPs induce apoptosis in leukemia cells via interactions with MCL-1 and are associated with better prognosis.38 GBP3, GBP4, and GBP7 combined are overexpressed or amplified in 14% of patients with AML (supplemental Figure 3A), and high GBP protein expression overall, particularly GBP2, is associated with lower overall survival (The Cancer Genome Atlas [TCGA]; supplemental Figure 3B). GBP expression is also correlated with expression of major IFN regulators, such as STAT1 and IRF1 (supplemental Figure 3C-D), and inversely correlated with EZH2 (supplemental Figure 3E).
To determine whether EZH2 activity correlates with GBP expression in B-cell malignancies, we analyzed GBP expression in human lymphoma cell lines and found that several GBP genes are significantly upregulated after pharmacological EZH2 inhibition (Figure 5I). Chromatin Immunoprecipitation followed by sequencing (ChIP-seq) data from mouse splenic centrocytes and centroblasts26 showed increased H3K27me3 deposition across the Gbp locus in Ezh2Y641F mutants compared to Ezh2WT (Figure 5J), suggesting direct regulation.
GBP2 overexpression in vivo disrupts hematopoiesis and promotes apoptosis in B lineage cells
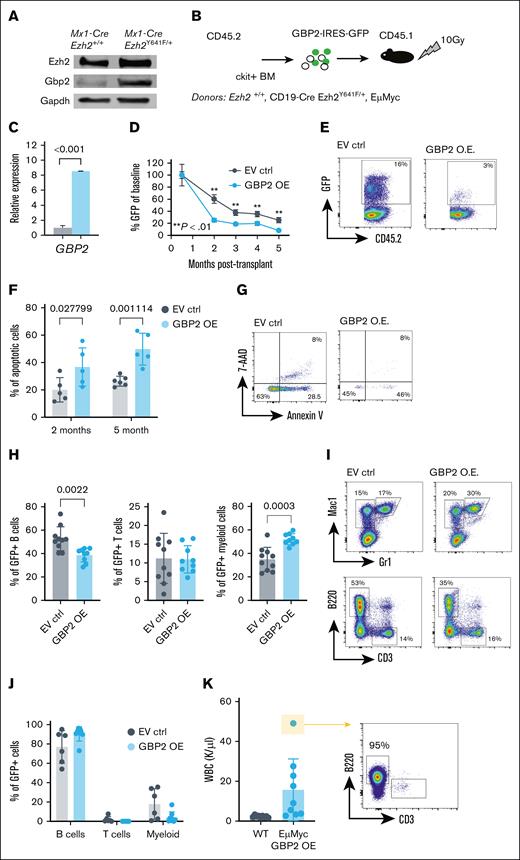
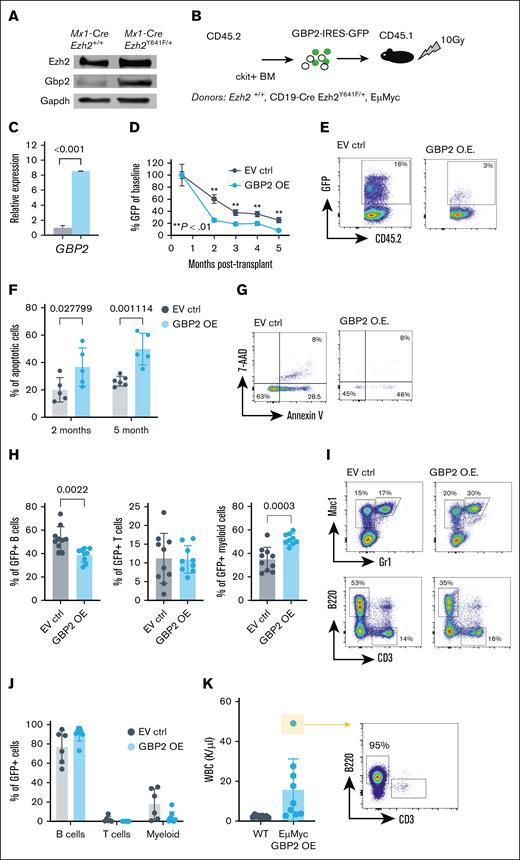
Given the upregulation of Gbp2 in Mx1-Cre Ezh2Y641F pro-B cells (Figure 5G) and its EZH2-dependent regulation (Figure 5I-J), we further investigated its function. We first validated that Gbp2 protein was upregulated at the protein level and found at least 10-fold higher expression in Ezh2Y641F mutant B cells than in Ezh2WT controls (Figure 6A). To test whether GBP overexpression affects hematopoietic development, differentiation, or survival, we overexpressed human GPB2 in mouse hematopoietic stem and progenitor cells isolated from Ezh2WT and CD19-Cre Ezh2Y641F/+ mice and transplanted them into lethally irradiated recipients (Figure 6B). We verified increased GBP2 expression in donor cells by quantitative PCR (Figure 6C) and monitored donor-derived cells using green fluorescent protein (GFP). We found that GBP2-overexpressing cells contributed less to hematopoiesis in recipient mice compared to controls (Figure 6D-E) and showed increased apoptosis across all lineages, both early and long term (Figure 6F-G). Within the GFP-positive fraction, we observed a skewing more toward myeloid cells and less toward B cells (Figure 6H-I), suggesting differentiation lineage bias. We did not observe any signs of disease in the control or the GBP2-overexpressing group within the timeline of this experiment.
Effect of GBP2 OE on hematopoiesis in vivo. (A) Western blot analysis of mouse Gbp2 protein expression in Mx1-Cre and Mx1-Cre Ezh2Y641F CD19+ B-cell progenitors from the BM. (B) Experimental design of in vivo GBP2 OE. (C) GBP2 expression levels by qPCR in ckit+ hematopoietic progenitors 24 hours after transfection (n = 3). (D) Level of GBP2-GFP+ cells in peripheral blood cells of transplant recipient mice over 5 months (EV ctrl, n = 5; GBP2 OE, n = 6; ∗∗P < .01 as indicated). (E) Representative flow cytometry plots of GFP expression at the 3-month time point from panel D. (F) Level of apoptosis measured by flow cytometry for annexin V and 7-AAD at different time points after transplantation (n = 5-6). (G) Representative flow cytometry plots for analysis of panel F at the 5-month time point. (H) Lineage distribution within the GFP+ fraction of Mx1-Cre Ezh2Y641F transduced cells (n = 8-9). (I) Representative flow cytometry plots of panel H. (J) Lineage analysis by flow cytometry of peripheral blood from transplant recipients (EμMyc donor group; n = 9). (K) WBC counts and expansion of B cells in mice from panel J. For panels A-K, a multiple parameter unpaired t test was performed. 7-AAD, 7-Aminoactinomycin D; EV ctrl, empty vector control; Gapdh, Glyceraldehyde-3-phosphate Dehydrogenase; OE, overexpression; WBC, white blood cells.
Effect of GBP2 OE on hematopoiesis in vivo. (A) Western blot analysis of mouse Gbp2 protein expression in Mx1-Cre and Mx1-Cre Ezh2Y641F CD19+ B-cell progenitors from the BM. (B) Experimental design of in vivo GBP2 OE. (C) GBP2 expression levels by qPCR in ckit+ hematopoietic progenitors 24 hours after transfection (n = 3). (D) Level of GBP2-GFP+ cells in peripheral blood cells of transplant recipient mice over 5 months (EV ctrl, n = 5; GBP2 OE, n = 6; ∗∗P < .01 as indicated). (E) Representative flow cytometry plots of GFP expression at the 3-month time point from panel D. (F) Level of apoptosis measured by flow cytometry for annexin V and 7-AAD at different time points after transplantation (n = 5-6). (G) Representative flow cytometry plots for analysis of panel F at the 5-month time point. (H) Lineage distribution within the GFP+ fraction of Mx1-Cre Ezh2Y641F transduced cells (n = 8-9). (I) Representative flow cytometry plots of panel H. (J) Lineage analysis by flow cytometry of peripheral blood from transplant recipients (EμMyc donor group; n = 9). (K) WBC counts and expansion of B cells in mice from panel J. For panels A-K, a multiple parameter unpaired t test was performed. 7-AAD, 7-Aminoactinomycin D; EV ctrl, empty vector control; Gapdh, Glyceraldehyde-3-phosphate Dehydrogenase; OE, overexpression; WBC, white blood cells.
To determine whether GBP2 overexpression affects the progression of an aggressive B-cell malignancy, we overexpressed GBP2 in hematopoietic progenitors isolated from 2-month-old mice that express the Myc oncogene in the B-cell lineage (EμMyc model39). We found that GBP2 overexpression did not alter transformation kinetics or leukemia development of EμMyc mice (Figure 6J-K). Finally, to assess the effect of enforced GBP2 expression in already established leukemia and lymphoma cell lines, we overexpressed GBP2 in 2 B-cell progenitor leukemia cell lines, 5 diffuse large B-cell lymphoma lines, and 1 AML cell line and assayed rates of growth and apoptosis (supplemental Figure 4). We observed modest changes in growth rates and apoptosis in vitro. Combined, these results suggest that GBP2 primarily affects early stages of hematopoietic differentiation and transformation potential, rather than altering progression of established malignancies.
Discussion
In this study, we provide novel insights into the complex role of EZH2Y641F mutations across various stages of hematopoietic development and different cancer types. Using a conditional Ezh2Y641F allele with tissue-specific Cre drivers, we demonstrated that the phenotypic and oncogenic consequences of Ezh2Y641F are strongly influenced by developmental timing and cellular context at the time of expression. These findings extend prior studies, which primarily focused on the mutation’s role in mature B-cell lymphomas and provide insights into its broader effect during hematopoiesis and malignant transformation.
Consistent with prior studies, CD19-Cre Ezh2Y641F mice developed B-cell lymphoma, whereas Mx1-Cre, Ubc-CreERT2, and Prx1-Cre models exhibited significant hematopoietic defects without malignancy. These differences highlight that Ezh2Y641F requires a permissive cellular context to drive transformation, one that may only exist in committed B cells. The absence of malignancy in Mx1-Cre mice despite persistent Ezh2Y641F expression in B-cell progenitors supports the idea that early disruptions to the bone marrow microenvironment may preclude the acquisition of secondary mutations necessary for transformation.
Hematopoietic defects such as bone marrow failure, extramedullary hematopoiesis, and blocks in B-cell differentiation at the pre–B-cell stage were consistent across all Cre drivers (Ubc-CreERT2, Prx1-Cre, and Mx1-Cre models). These results point to a critical developmental window during hematopoietic development in which Ezh2Y641F mutations alter stem and progenitor function. This aligns with the higher frequency of Ezh2Y641 mutations in hematopoietic malignancies than solid tumors.
Bone marrow failure was a shared phenotype across most Cre crosses, particularly Mx1-Cre, Prx1-Cre, and Ubc-CreERT2, with associated splenomegaly and extramedullary hematopoiesis. These findings suggest that Ezh2Y641F may disrupt hematopoietic homeostasis by impairing HSC self-renewal and differentiation, also supported by the competitive bone marrow transplantation results, which directly test hematopoietic stem cell–intrinsic properties. At the same time, we observed an increase in trabecular bone mass and reduced marrow, which implicates altered bone remodeling, likely due to disrupted osteoclast function. Prior studies have shown that Ezh2 represses transcription factors that inhibit osteoclastogenesis,40-42 suggesting that Ezh2Y641F expression in osteoclasts may interfere with normal bone resorption. This phenotype underscores the role of Ezh2Y641F in shaping the microenvironment and influencing disease progression and may have implications for understanding bone marrow failure syndromes and the interplay between hematopoietic cells and the microenvironment.
Interestingly, the hematopoietic stem cell defects we observed are at odds with the presence of Ezh2Y641F mutations in patients with AML. This raises questions about the role of Ezh2 and Ezh2Y641F mutations in AML, which is thought to develop from the accumulation of genetic mutations in HSCs. Ezh2Y641 mutations in AML are very infrequent and typically of low clonality (<5%), suggesting that they are not dominant oncogenic drivers and outcompeted by other more potent clones. Our data suggest that Ezh2Y641F mutation alone impairs stem cell fitness and cannot drive AML, unless combined with other oncogenic mutations or within a specific context that we have not yet identified.
RNA sequencing of pro- and pre–pro-B cells revealed both shared and distinct transcriptional responses to Ezh2Y641F in the from Mx1-Cre and CD19-Cre models. Shared enrichment of IFN signaling, IL-2–STAT5, and tumor necrosis factor α signaling suggests regulation of common downstream pathways that are independent of the timing of the mutation. However, we also identified Cre-specific signatures, such as BMP2 targets in Mx1-Cre and HOXA9-MEIS targets in CD19-Cre, that may explain divergent outcomes. These differences may depend on the preexisting epigenetic state of the cell at the time of Ezh2Y641F expression, influencing how Ezh2Y641F reshapes gene expression.
Our results are consistent with and extend prior studies investigating Ezh2Y641F in B-cell malignancies. Earlier work showed that Ezh2Y641F promotes GC hyperplasia and lymphomagenesis through repression of differentiation genes, enhancement of Myc-driven transcriptional programs, and cooperation with oncogenic partners such as Bcl6 and Bcl2.6,13,43 More recently, Ezh2Y641F was shown to reprogram the immune microenvironment and suppress antigen presentation.26 Although our CD19-Cre results align with these findings, our study uniquely addresses how developmental timing and cellular context alter the downstream effects of Ezh2Y641F. Specifically, we show that early expression in hematopoietic stem and progenitor cells leads to bone marrow failure and impairs lineage commitment, with no evidence of transformation. Furthermore, transcriptomic comparisons across Cre lines reveal divergent pathway activation, highlighting that the molecular consequences of Ezh2Y641F are highly context dependent. These differences may underlie the limited prevalence of Ezh2Y641F mutations outside of mature B-cell neoplasms.
One of the most notable findings was the upregulation of GBPs in Mx1-Cre Ezh2Y641F pro-B cells. GBPs, IFN-regulated GTPases, are implicated in immune responses and cancer prognosis, yet their role in hematopoietic malignancies is poorly understood. High GBP expression correlates with poor outcomes in AML, and our functional analysis suggests that GBP2 may influence differentiation and apoptosis in a lineage-specific manner. Although we focused on 1 gene, Gbp2, several other Gbp genes are also upregulated in the context of Ezh2Y641F expression. Gbp2 may thus be part of a broader response, not the only driver. These findings point to potential roles for GBPs as biomarkers or therapeutic targets in hematopoietic malignancies.
The absence of malignancy in certain models may not negate the mutation's oncogenic potential in other tissues or under different conditions. Future studies should explore additional hematopoietic-specific Cre drivers, combinations with other oncogenic mutations, and longer monitoring periods to assess the full scope of the effects of Ezh2Y641F mutations. Investigating chromatin and histone modifications after Ezh2Y641F expression could provide valuable insights into the mutation's impact on epigenetic landscapes and reveal mechanisms underlying its context-dependent behavior.
In summary, our findings provide new insights into the context-dependent effects of Ezh2Y641F and illustrate the importance of developmental stage and cellular context in determining whether this mutation promotes malignancy or stem cell dysfunction. GBP upregulation emerges as a novel molecular signature of early Ezh2Y641F expression and may mediate lineage bias, apoptosis, or both. These insights will be valuable for understanding EZH2 function in hematopoiesis and may guide future efforts to target epigenetic vulnerabilities in blood cancers.
Acknowledgments
The authors thank the Siteman Flow Cytometry Core and the McDonnell Genome Institute/Genome Technology Access Center at Washington University for flow cytometry services and genome analysis respectively, and the Department of Comparative Medicine for animal maintenance and expertise. The authors also thank all members of the Souroullas Lab for insightful discussions and critical input on data analysis and presentation.
This work was supported by the US National Cancer Institute grants (K22-CA229612-01 [G.P.S.] and T32 CA113275-10 [S.M.Z.]); the Cancer Research Foundation, Chicago, Illinois (G.P.S.), and the Leukemia Research Foundation (G.P.S.).
Ochre Bio (Taipei, Taiwan) had no role in the gathering, analyzing, or interpreting the data.
Authorship
Contribution: S.M.Z., S.J.P., S.R.S, J.-Y.L., C.T., and G.P.S. performed experiments and analyzed data; J.-Y.L. performed experiments; S.M.Z. and G.P.S. wrote the manuscript; and G.P.S. conceptualized and supervised the project.
Conflict-of-interest disclosure: The authors declare no competing financial interests.
The current affiliation for J.-Y.L. is Ochre Bio, Taipei, Taiwan.
Correspondence: George P. Souroullas, Department of Medicine, Division of Oncology, Washington University School of Medicine, 660 S. Euclid Ave, Campus Box 8069, St. Louis, MO 63110; email: george.souroullas@wustl.edu.
References
Author notes
Gene expression data are available at the Gene Expression Omnibus database (accession number GSE270480).
The full-text version of this article contains a data supplement.

