Abstract
In mice, interleukin-7 (IL-7) hastens T-cell reconstitution and might cause autoimmune diseases, lymphoma, and osteoporosis. We assessed the effect of IL-7 on T-cell reconstitution and toxicity in baboons that underwent total body irradiation followed by autologous transplantation of marrow CD34 cells. Three baboons received placebo and 3 baboons received recombinant human IL-7 (rhIL-7, 75 μg/kg twice a day subcutaneously) between 6 and 10 weeks after transplantation. The mean increase in blood absolute CD4 T-cell counts was 0.9-fold in the placebo-treated animals versus 9.0-fold in those treated with IL-7 (P = .02). The increase observed in the IL-7–treated animals appeared attributable to peripheral expansion rather than de novo generation. The IL-7–treated animals had greater mean increases in the volumes of the spleen (2.0-fold with placebo versus 4.5-fold with IL-7, P = .02) and lymph nodes (1.8-fold with placebo versus 4.1-fold with IL-7,P = .10) but not the thymus (3.4-fold with placebo versus 1.1-fold with IL-7, P = .18). Side effects of IL-7 included thrombocytopenia and possibly neutropenia and hemolytic anemia. One IL-7–treated animal failed to thrive due to a disease resembling graft-versus-host disease. No animals developed lymphoma. Bone density was not decreased. In conclusion, IL-7 raises CD4 T-cell counts in irradiated primates. It remains to be determined whether this is associated with clinical benefit.
Introduction
A reduction in the number of T cells results in a homeostatic attempt to increase the T-cell number.1-9 This occurs either through the differentiation of marrow-derived progenitors into T cells in the thymus (de novo generation) or through the proliferation of existing T cells (peripheral expansion).10-12 In mice, interleukin 7 (IL-7) is a potent stimulator of both de novo generation and peripheral expansion.13 Peripheral expansion appears stimulated through stimulation of proliferation and inhibition of cell death.14-16 In patients with HIV or chemotherapy-induced lymphocytopenia, there is an inverse correlation between CD4 T-cell counts and IL-7 levels.17 18 Thus, IL-7 may play a significant role in T-cell homeostasis.
After hematopoietic cell transplantation, patients have frequent infections for at least 1 year. This is in part because CD4 T-cell reconstitution proceeds slowly (over months to years; for reviews, see Storek and Witherspoon3 and Parkman and Weinberg19). Peripheral expansion may be limited because T cells from transplant recipients are prone to apoptosis.20De novo generation may be reduced from conditioning-induced damage to thymic stromal cells, which secrete IL-7.21 IL-7 levels after transplantation are only mildly elevated (∼ 2-fold22) possibly due to the damage to thymic stroma. Administration of IL-7 to mice after transplantation improved both de novo generation and peripheral expansion of CD4 T cells.23-25 These appeared to be of clinical benefit because the mortality rate after pulmonary infection with influenza virus in mice receiving IL-7 was 44% versus more than 90% in mice not receiving IL-7.24
B-cell reconstitution was also hastened in IL-7–treated mice receiving transplants.23 This could be of added benefit because B lymphocytopenia appears to contribute to the development of infections in transplant recipients.26
Before starting human trials we wished to evaluate IL-7 in nonhuman primates, for 3 reasons. First, the function of IL-7 in rodents and primates may be different.27-30 It is conceivable that IL-7 could hasten T- or B-cell reconstitution in rodents but not in primates. Second, in nonhuman primates one can assess T and B cells not only from blood but also from tissues. The tissue lymphocytes constitute the vast majority of total body lymphocytes and may differ from circulating lymphocytes; changes in their quantity are not always reflected by parallel changes in their blood count.8,31-35 Third, we wished to determine the side effects of IL-7 in nonhuman primates, which should significantly influence the enthusiasm for and the design of clinical trials. In this study, the following potential side effects were evaluated particularly carefully: (1) lymphoma/thymoma because IL-7–transgenic mice developed lymphomas and thymomas36,37; (2) autoimmunity because IL-7–transgenic mice developed ulcerative colitis or dermal T-cell infiltrate with alopecia, hyperkeratosis, and exfoliation37,38; and (3) osteoporosis because healthy female mice treated with IL-7 for 20 days developed osteoporosis of the same degree as estrogen-deficient (oophorectomized) mice, due to increased osteoclastic resorption.39
Materials and methods
Study design and animals
To economize and to attempt quantitation of T cells of stem cell origin, the effect of IL-7 was studied in animals used also for a study of gene transfer into hematopoietic stem cells. Juvenile baboons (Papio cynocephalus-anubis) were irradiated and received transplants with marker gene–transduced autologous CD34 cells. In a “pilot experiment,” recombinant human IL-7 (rhIL-7) at 25 μg/kg twice a day was given to 2 animals—J99202 between 12 and 16 weeks after transplantation and A00066 between 14 and 18 weeks after transplantation. Only moderate increases in CD4 T-cell counts were achieved. This may have been due to using a low dose of rhIL-7 or the fact that the animals had near-normal CD4 T-cell counts at the time of starting rhIL-7. Therefore in the subsequent “main experiment,” rhIL-7 at 75 μg/kg twice a day (dose similar to the dose that stimulated both de novo generation and peripheral expansion of T cells in mice13) or placebo was administered between 6 and 10 weeks after transplantation. Only data from the main experiment are presented here unless otherwise specified. In the main experiment, 3 animals received rhIL-7 (M99149, M99267, and K99307) and 3 animals received placebo (F99074, A00074, and F99310). The animals were of similar age at the time of transplantation (2.4, 2.1, and 2.1 years, respectively, for the IL-7–treated animals, and 2.3, 3.1, and 2.0 years, respectively, for the placebo-treated animals). The animals were seronegative for Babesia and simian T-lymphotropic virus (STLV-I) and were negative on tuberculin testing before transplantation. They were housed and cared for at the University of Washington National Primate Research Center under conditions approved by the American Association for the Accreditation of Laboratory Animal Care. The study was approved by the University of Washington Animal Care and Use Committee and the FHCRC Institutional Review Board.
Transplantation and posttransplantation treatment
Filgrastim (granulocyte colony-stimulating factor [G-CSF]), 100 μg/kg daily, and stem cell factor (SCF), 50 μg/kg daily, were given subcutaneously from day −8 to day −4 to increase the number of CD34 cells in the marrow. On day −3, bone marrow was harvested into preservative-free heparin from both humeri and femora. CD34 cells were immunomagnetically enriched, using antibody 12.8 and goat-antimouse IgM-coated microbeads (Miltenyi, Auburn, CA). Transduction of CD34 cells with yellow fluorescent protein (YFP) gene was done as described.40 41 Briefly, the cells were cultured in Iscove medium with 10% fetal bovine serum and 100 ng/mL each of SCF, filgrastim (G-CSF), megakaryocyte growth and differentiation factor (MGDF), IL-3, IL-6, and Flt3 ligand (the latter 3 cytokines were omitted in case of A00066) for 48 hours. All the cytokines were kindly donated by G. Molineux (Amgen, Thousand Oaks, CA). Transduction was performed over the subsequent 48 hours using a medium containing Phoenix GALV-pseudotype oncoretrovirus carrying the YFP transgene in flasks coated by CH-296 (RetroNectin, generously provided by Takara Bio, Shiga, Japan). After total body irradiation (10.2 Gy in 2 fractions at 0.07 Gy/min), the cells were reinfused on day 0. Supportive care after transplantation included whole blood transfusions for thrombocytopenia less than 20 × 109/L, filgrastim for neutropenia less than 0.5 × 10⁹/L, and prophylactic antibiotics (acyclovir until day 100, ceftazidime plus gentamicin plus vancomycin until sustained absolute neutrophil count of > 0.2 × 10⁹/L, and fluconazole until day 50).
Escherichia coli–produced rhIL-7 (kindly provided by Dr Michel Morre, Cytheris, Vanves, France) was administered subcutaneously for 28 days. The IL-7 was diluted in 20 mM sodium citrate buffer, pH 6.2. The same buffer was used as placebo.
Enumeration of MNC subsets
Mononuclear cells (MNCs) were separated from EDTA (ethylenediaminetetraacetic acid)–-anticoagulated blood using density gradient (Ficoll, density 1.073 kg/L) centrifugation. The cells, suspended in flow buffer (phosphate-buffered saline [PBS] with 1% bovine serum albumin and 0.1% sodium azide) were stained with fluorochrome-conjugated monoclonal antibodies and analyzed by 3-color flow cytometry. The following antibodies were used: CD3 from Biosource (clone FN18; Camarillo, CA), CD4 from BD Biosciences (clone SK3; San Jose, CA), CD8 from Beckman-Coulter (clone B9.11; Miami, FL), CD11a from Beckman-Coulter (clone 25.3.1), CD14 from Beckman-Coulter (clone RMO52), CD16 from Beckman-Coulter (clone 3G8), CD20 from BD Biosciences (clone L27), CD45RA from Beckman-Coulter (clone ALB11), and CD56 from Beckman-Coulter (clone N901). Residual red blood cells were lysed in hemolytic buffer (8.3% ammonium chloride plus 1% potassium bicarbonate plus 0.4% EDTA). No fixation was done. Cells were resuspended in flow buffer and kept on ice until flow cytometry, which occurred within 12 hours from blood drawing. To identify apoptotic cells, cells were stained not only with the fluorochrome-labeled antibodies against surface antigens, but also with either fluorochrome-labeled annexin V (using 2.5 mM CaCl2in 140 mM NaCl/10 mM HEPES [N-2-hydroxyethylpiperazine-N′-2-ethanesulfonic acid]/NaOH, pH 7.4) or 7-actinomycin D (7-AAD, 20 mg/L; Sigma, St Louis, MO).
FACSCalibur (BD Biosciences) flow cytometer was used for data acquisition. List-mode data were analyzed using WinList software (Verity Software House, Topsham, ME). The forward scatter × side scatter (FSc × SSc) gate was set to encompass MNCs. B cells were defined as CD20+ MNCs. CD4 T cells were defined as CD3+CD4+ MNCs, and CD8 T cells were defined as CD3+CD8+ MNCs. Natural killer (NK) cells were defined as MNCs expressing CD16 or CD56 and not expressing CD3 or CD14. Monocytes were defined as CD14+ MNCs. Each absolute MNC subset count was calculated as the absolute MNC count multiplied by the percent of the MNC subset divided by 100. The absolute MNC count represented the sum of absolute lymphocyte count and absolute monocyte count determined by our clinical hematology laboratory, using Sysmex XE2100 cell counter and Giemsa-stained blood smears.
Lymph nodes (LNs) were obtained at 6 weeks (before starting IL-7, the largest LN from the right axilla), 10 weeks (approximately 12 hours after the last injection of IL-7 or placebo, the largest LN from the left axilla), and approximately 6 months after transplantation (the largest LN from the right axilla). Axillary LNs were chosen because they were distant from the IL-7/placebo injection sites (thighs). The LNs were teased in RPMI with 10% fetal calf serum. The resulting cell suspension was filtered through a 70-μm nylon cell strainer. Percentages of cell subsets were determined by flow cytometry as in the blood.
TREC assay
First, we determined the nucleotide sequence of the signal joint of baboon αδ Τ-cell receptor excision circle (TREC). In rhesus macaques and sooty mangabeys the signal joint sequence was found to be approximately 96% homologous to that in humans.35 Thus, we hypothesized that the baboon sequence would also be similar. Polymerase chain reaction (PCR) amplification of the putative signal joint from baboon blood MNC DNA, using primers for regions 100% homologous among humans, macaques, and mangabeys (forward primer, 5′-CACATCCCTTTCAACCATGCT-3′; reverse primer, 5′-TTGCTCCGTGGTCTGTGCTGGCATC-3′), yielded a product of the expected length (281 bp). Sequencing of the product showed that baboon and human signal joint regions are 94.4% homologous (GenBank accession no.AF541878). The 281-bp PCR product represented a TREC because it was detected in DNA extracted from fluorescence-activated cell-sorted (FACS) normal baboon CD45RAhigh CD4 T cells but not CD45RA− CD4 T cells or B cells.
TREC levels were determined by real-time PCR, analogous to Douek et al.42 FACS CD4 or CD8 T cells were lysed in 100 μg/mL proteinase K at 107 cells/mL. The 5′-nuclease (TaqMan) assay was performed on 5 μL cell lysate (total volume of the lysate of 50 000 cells was 40 μL; thus 5 μL lysate contained TRECs from 6250 cells), using forward primer, 5′-CACATCCCTTTCAACCATGCT-3′; reverse primer, 5′-GCCAGCTGCAGGGTTTAGG-3′; and probe FAM-ACGCATTTGGTTTTTGTAAAGGTGCTCACT-TAMRA (MegaBases, Chicago, IL). PCR reactions contained 0.5 U Taq polymerase, 3.5 mM MgCl2, 0.2 mM dNTPs, 400 nM each primer, 200 nM probe, and Blue-636 reference (MegaBases). The reactions were run at 95°C for 5 minutes, then 95°C for 30 seconds and 60°C for 1 minute for 40 cycles, using ABI7700 system (PE Biosystems, Norwalk, CT). Samples were analyzed in quadruplicates. Plasmids containing the baboon signal joint region were used as standards. A standard curve was plotted and the TREC level (the number of TREC copies per 6250 CD4 or CD8 T cells) was calculated using the ABI7700 software. TREC levels reflect not only the de novo generation of T cells but also the expansion of thymocytes or T cells after rearrangement. For example, TREC levels drop when peripheral T cells proliferate as a result of an infection. In contrast, the absolute count of TREC-containing (TREC+) T cells (per unit blood volume) is not influenced by rearrangement after proliferation and thus serves as a better indicator of the quantity of T cells generated de novo. We calculated the absolute count of TREC+ CD4 (CD8) T cells (per microliter) as the TREC level (per 6250 cells) multiplied by the absolute CD4 (CD8) T-cell count (per microliter) and divided by 6250.
CT
For oral contrast, 0.8% barium sulfate was used (E-Z-CAT, E-Z-EM, Westbury, NY). The scanning was done on GE Lightspeed QX/I computed tomography (CT) scanner, using the following conditions: abdominal protocol, 120 kV, 130 mA, 1.25-mm slice thickness, 21.3-cm diameter of field of view, and 102-cm table height. After scanning without intravenous contrast, 68% ioversol (Optiray 320, Mallinckrodt, St Louis, MO) was injected intravenously from a power injector (1 mL/s, total of 48 mL). Using the same conditions as for the nonintravenous contrast scanning, scanning with intravenous contrast was started 1 minute after finishing the intravenous injection. On analysis, the area of the thymus was determined on each slice (mm2), using intravenous contrast images and GE Pathspeed software (GE Medical Systems, Milwaukee, WI). The area was multiplied by the slice thickness (1.25 mm) to get the volume at that slice level (mm3). Thymic volume was calculated as the sum of the volumes at each slice level. Splenic and LN volumes were determined analogously. The sum of the volumes of one right axillary LN, one left axillary LN, one pelvic LN, one right inguinal LN, and one left inguinal LN was used as an index of the size of all lymph nodes. In each LN region, the largest LN at week 6 that was also identifiable at weeks 10 and 14 was measured.
Bone density was measured using a calibration phantom (Image Analysis, Columbia, KY) placed under the lumbar area of the animal at the time of scanning. Nonintravenous contrast images and GE PathSpeed software were used for analysis. On each slice of interest, the mean Hounsfield unit (HU) of the vertebral body cancellous bone and the mean HU of each of the 4 density standards were determined. Density of the vertebral body cancellous bone was calculated by linear regression. This was done at 3 levels of vertebra L3 (1.25 mm above the basivertebral canal, at the basivertebral canal, and 1.25 mm below the basivertebral canal), 3 analogous levels of vertebra L4, and 3 analogous levels of vertebra L5. For each vertebra, the mean density of the 3 levels was calculated. The mean density of the mean densities of L3, L4, and L5 (“L3-5 density”) was used as the index of overall cancellous bone density. We focused on cancellous bone because in states of increased osteoclastic resorption the density of cancellous bone is decreased to a greater degree than the density of solid bone. For quality control, a torso phantom (Image Analysis) was used with each scanning. Its calculated density ranged from 96.1 to 105.9 mg/cm3, suggesting adequate reproducibility.
Histology
Using standard techniques, buffered formalin-fixed, paraffin-embedded and, in the case of bone marrow, decalcified tissue sections were stained with hematoxylin and eosin (H and E) or immunostained with CD3 (rabbit-antihuman CD3 polyclonal antibody, Dako, Carpinteria, CA), CD4 (clone 1F6, Novocastra, Newcastle upon Tyne, United Kingdom), or CD20 (clone L26, Dako). Snap-frozen tissues were immunostained with CD8 (clone G10.1, kind gift from Dr Bing Hu, University of Washington, Seattle). Slides were analyzed by one pathologist (R.C.H.) blinded to IL-7 versus placebo treatment. Dermal perivascular T-cell infiltrates were given a score from 0 to 3. Bone marrow cellularity was estimated from the sections stained with H and E and expressed as the percentage of nonfat cells among fat plus nonfat cells. Percentage of T or B cells among bone marrow hematopoietic cells was estimated from the immunostained sections.
IL-7 levels and neutralizing antibodies
Serum concentration of IL-7 was determined by enzyme-linked immunosorbent assay (ELISA) using the kit for human IL-7 (R & D Systems, Minneapolis, MN). In case of values exceeding the concentration of the highest standard, diluted serum was used.
For the detection of IL-7–neutralizing antibodies, IL-7–dependent cells (PB1, from DSMZ [German Tissue Culture Collection]) were grown in 85% McCoy 5A medium supplemented with 15% fetal bovine serum (Hyclone, Logan, UT), 50 ng/mL human IL-7 (Cytheris, Vanves, France), 0.4 × minimum essential medium (MEM) vitamins (Sigma), 1 × MEM nonessential amino acids (Sigma), 0.5 × essential amino acids (Sigma), 1 mM sodium pyruvate, 0.12% sodium bicarbonate, 2 mM l-glutamine, and 50 μM β-mercaptoethanol. Subsequently, the cells were starved of IL-7 for 24 hours (cultured in the same media but without IL-7). The starved cells were transferred to a 96-well plate (100 000 cells/well) and cultured at 37°C in a humidified 5% CO2 atmosphere for 44 hours in the same media, except for containing various concentrations of IL-7 and 15% baboon serum instead of fetal bovine serum. A neutralizing mouse-antihuman IL-7 monoclonal antibody (R & D Systems clone 7417.111) was added to some wells at 2.5 μg/mL (positive control for inhibition). After 44 hours the cultured cells were exposed to3H-thymidine (1 μCi/well; 0.037 MBq/well) for 4 hours. The cells were lysed with water and DNA was harvested on a filter (Packard-96 GF/C; Meriden, CT) using a semiautomated harvester (Micromate 196; Packard). Counts per minute (CPMs) were determined in a β-scintillation counter (Top Count; Packard). Median CPMs of triplicate wells were plotted, resulting in log10 CPM over log10 IL-7 concentration dose-response curves. A neutralizing antibody in week 10 serum was considered present if the inflection point of the week 10 curve was to the right from the week 6 (pre–IL-7) curve, at least one half of the distance between the inflection points of the week 6 curve (negative control) and the week 6 with neutralizing monoclonal antibody curve (positive control).
Statistics
Increases in MNC subset counts were calculated as week 10 count/week 6 count. The t test was used to test differences in the increases between the IL-7 and the placebo-treated animals (SigmaStat software, SPSS, San Rafael, CA). Two-tailed Pvalues are given.
Results
Baboon and human IL-7 are similar
The mRNA from the thymus of a normal baboon was extracted and reverse transcribed. The cDNA was PCR amplified, using primers for the flanking regions of the human IL-7 open reading frame (forward, ATGTTCCATGTTTCTTTTAGGTA; reverse, TGATGGGCACTAAAGAACACTGA), and sequenced. The resulting baboon IL-7 open reading frame (GenBank accession no. AF541946) was found to have 98.1% nucleotide sequence homology and 96.6% amino acid sequence homology with human IL-7.43 Given the high degree of homology between baboon and human IL-7 and because human IL-7 has been shown to stimulate T-cell reconstitution in mice,23-25 whose IL-7 amino acid sequence is only about 80% homologous with that of humans,43 44 we hypothesized that human IL-7 should have biologic activity in baboons.
Effect of IL-7 on CD4 T cells
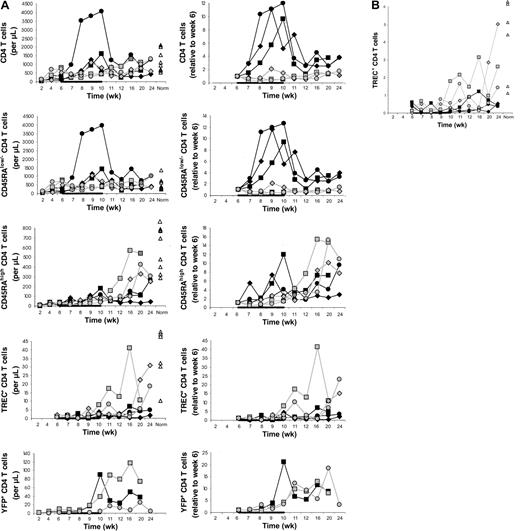
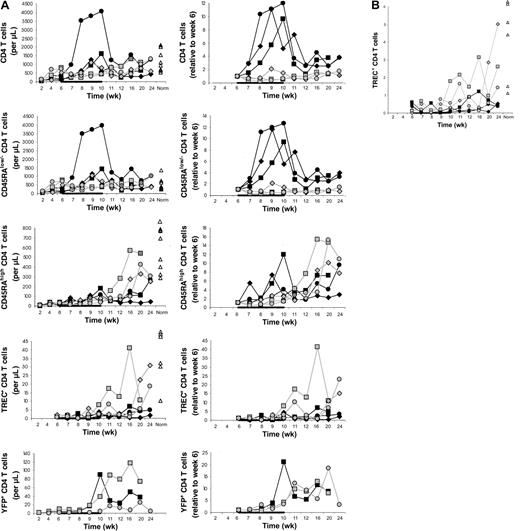
In the main experiment involving 3 IL-7–treated and 3 placebo-treated animals, CD4 T-cell counts in the blood increased from week 6 to week 10 on average 9.0-fold in the IL-7–treated compared to 0.9-fold in the placebo-treated animals (P = .02; Figure1A). CD4 T-cell counts also increased in the 2 animals in the pilot experiment (J99202, 5.7-fold; A00066, 1.9-fold).
CD4 T-cell counts
. (A) Counts of circulating CD4 T cells and CD4 T-cell subsets (left) and their increases relative to week 6 (right) in IL-7–treated animals (filled symbols) and placebo-treated animals (open symbols), showing that CD4 T-cell counts increased more in IL-7–treated than placebo-treated animals and that this was primarily, if not entirely, due to peripheral expansion. The animals were treated with IL-7 or placebo between 6 and 10 weeks after transplantation, as indicated in each graph by the horizontal black bar. “Norm” shows the counts determined in normal animals of similar age as the animals that received transplants. (B) Percent TREC-containing CD4 T cells among total CD4 T cells in IL-7–treated animals (filled symbols) and placebo-treated animals (open symbols). For other symbols, refer to panel A.
The differences between IL-7– and placebo-treated animals at week 10 appeared to be greater for memory/effector (CD45RAlow/−) than naive (CD45RAhigh) CD4 T cells (Figure 1A). Thus, IL-7 may have stimulated peripheral expansion, whereas de novo generation may have been stimulated to a lesser degree or not at all. TREC results were consistent with no stimulation of de novo generation because there was no difference in the increases of the counts of TREC+CD4 T cells between IL-7 and placebo-treated animals (Figure 1A). When the TREC content was expressed as percent TREC+ CD4 T cells among total CD4 T cells, the result also did not suggest that IL-7 induced de novo generation (Figure 2B). In LNs, the percent TREC+ CD4 T cells (among total CD4 T cells) decreased in 3 of 3 IL-7–treated animals and increased in 2 of 2 placebo-treated animals studied (data not shown). This argues against the possibility that even though circulating TREC+ CD4 T cells were not increased, IL-7 stimulated de novo generation, but the newly generated T cells became sequestered in LNs. Three animals (1 IL-7 treated and 2 placebo treated) had successful (persistent) YFP gene marking of hematopoietic stem cells, which gave us information about T cells generated from stem cells after transplantation. YFP+ CD4 T-cell counts increased to a greater degree in the IL-7–treated animal compared with the 2 placebo-treated animals (Figure 1A). In light of the TREC results, the increase in the YFP+ CD4 T-cell counts in the IL-7–treated animal likely resulted from the expansion of the few T cells generated de novo after transplantation rather than from increased de novo generation. In agreement with that, thymic volume did not increase more in IL-7–treated animals (mean 1.1-fold increase in IL-7–treated animals versus 3.4-fold increase in placebo-treated animals,P = .18), whereas splenic and LN volumes increased more in IL-7– than placebo-treated animals (mean 4.5- versus 2.0-fold increase for spleen, P = .02, and 4.1- versus 1.8-fold increase for LNs, P = .10; Figure 2). Collectively, these results indicate that IL-7 stimulated peripheral expansion and not de novo generation of CD4 T cells.
Thymus, spleen, and LN volumes.
Shown are volumes of thymus (left panel), spleen (middle panel), and LNs (right panel) in IL-7–treated (filled symbols) and placebo-treated (open symbols) animals at 6, 10, and 14 weeks after transplantation. Each LN volume represents the sum of volumes of one right axillary LN, one left axillary lymph node, one pelvic LN, one right inguinal LN, and one left inguinal lymph node, as explained in “Materials and methods.” The animals were treated with IL-7 or placebo between 6 and 10 weeks after transplantation, as indicated in each graph by the horizontal black bar.
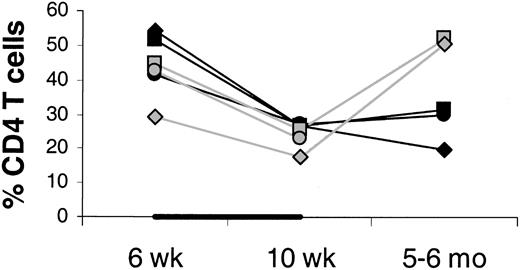
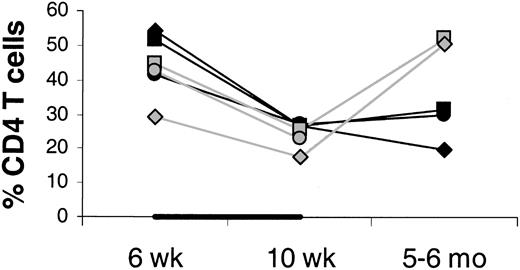
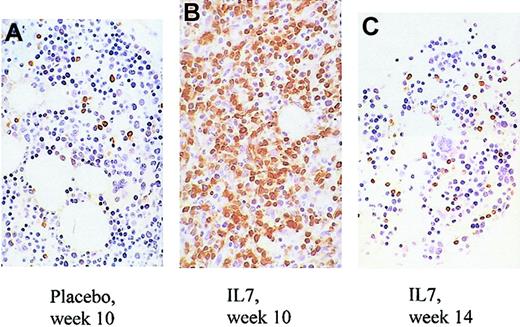
It is unlikely that the increase in circulating CD4 T-cell counts is due to an IL-7–stimulated shift of CD4 T cells from tissues to blood. On the contrary, there was evidence of increased T-cell counts in tissues sampled (LNs, bone marrow, and skin). Between week 6 and 10, LN volumes increased more in the IL-7– than placebo-treated animals (mean 4.2- versus 1.8-fold increase; Figure 2), whereas the changes in the percentages of CD4 T cells among LN cells were similar (mean 0.6- versus 0.6-fold increase; Figure 3), indicating that total LN CD4 T cells increased more in IL-7– than placebo-treated animals. Marrow at week 10 tended to be more cellular in IL-7– than placebo-treated animals (mean 99% versus 88%,P = .18) and was heavily infiltrated with T cells (mean 75% versus 9% T cells among hematopoietic cells,P < .001; Figure 4). Likewise, the skin on week 10 tended to contain more T cells in IL-7– than placebo-treated animals, particularly around dermal capillaries, both at the IL-7/placebo injection site (thigh, mean perivascular T-cell score 2.7 versus 2.0, P = .12) as well as at the noninjection site (arm, mean perivascular T-cell score 2.7 versus 1.5,P = .12). Collectively, these results suggest that IL-7 treatment resulted in increased total body CD4 T-cell counts.
Percent CD4 T cells in axillary LNs at 6 and 10 weeks and 5 to 6 months after transplantation.
Percents of total lymph node cells (100%) are shown. The animals were treated with IL-7 (filled symbols) or placebo (open symbols) between 6 and 10 weeks after transplantation, as indicated by the horizontal black bar. In one placebo-treated animal, LN sampling at 5 to 6 months after transplantation was not done.
Changes in bone marrow of treated and placebo animals.
Increased overall cellularity, increased percentage of T cells, and decreased number of megakaryocytes in the marrow of an IL-7–treated animal (B) compared with a placebo-treated animal (A) at the end of treatment (week 10). By week 14, the abnormalities observed in the same IL-7–treated animal at week 10 have abated (C). CD3 immunostain is shown in brown. CD4 and CD8 immunostains could not be performed due to a technical problem. Original magnification, × 80.
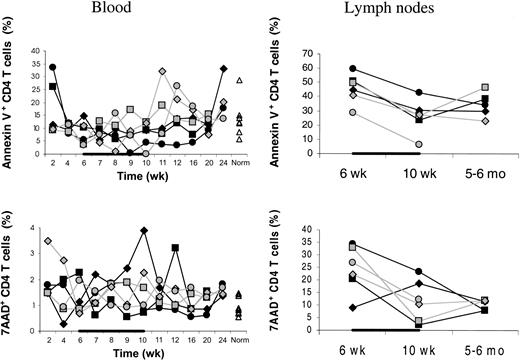
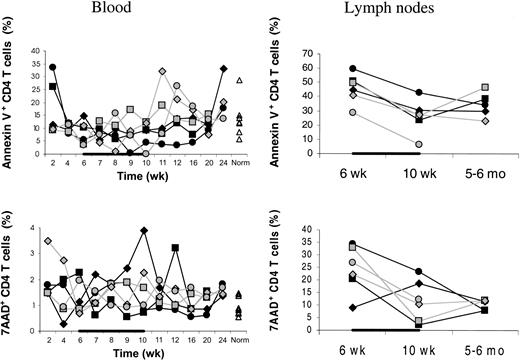
The IL-7–stimulated peripheral expansion leading to the increased total body CD4 T cells could result from increased proliferation or decreased death rate or both. IL-7– and placebo-treated animals had similar week 6 to 10 changes in the percentages of annexin V+ or 7-AAD+ CD4 T cells (Figure5). This suggests increased proliferation as the mechanism of the IL-7–stimulated peripheral expansion of CD4 T cells. However, a direct determination of the proliferation (eg, using Ki67) is needed to confirm this hypothesis.
Percentages of annexin V+ or 7-AAD+ cells.
Percentages of dying/dead (annexin V+) as well as dead (7-AAD+) CD4 T cells were not decreased in IL-7–treated (filled symbols) compared to placebo-treated (open symbols) animals. This applied to both blood (left panels) and axillary LNs (right panels). Percentages of annexin V+ or 7-AAD+ cells among total CD4 T cells are shown. “Norm” denotes the percentages determined in normal animals of similar age as the animals receiving transplants. In one placebo-treated animal, LN sampling at 5 to 6 months after transplantation was not done. Both in IL-7– and placebo-treated animals, the percentage of dying or dead CD4 T cells was always greater in LNs than in blood. The animals were treated with IL-7 or placebo between 6 and 10 weeks after transplantation as indicated by the horizontal black bars.
Effect of IL-7 on CD8 T cells, B cells, NK cells, and monocytes
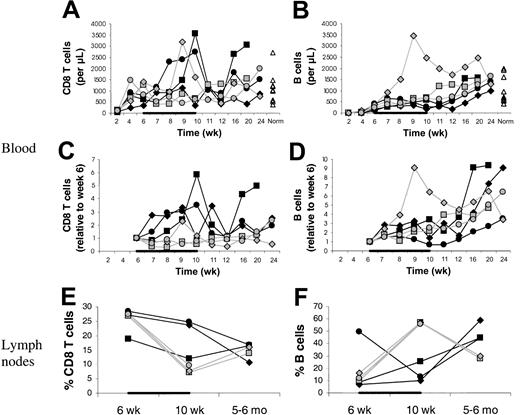
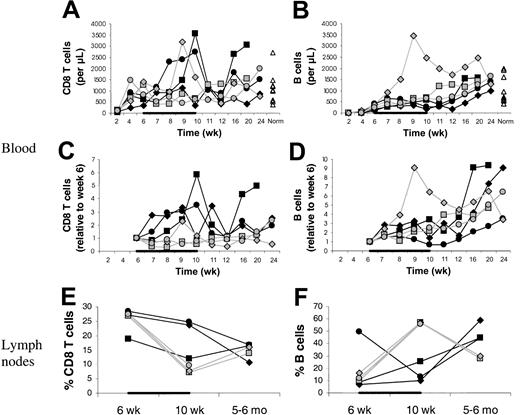
Compared with CD4 T cells, other MNCs were affected by IL-7 to a lesser degree or not at all. IL-7 treatment seemed to be associated with a mild increase in CD8 T cells (Figure6). This was also consistent with peripheral expansion rather than de novo generation because CD11ahigh (memory/effector) CD8 T cells and not CD11alow (naive) or TREC+ CD8 T cells increased more in the IL-7– than placebo-treated animals (data not shown). IL-7 did not increase counts of B cells in blood or LNs; on the contrary, IL-7 may have mildly delayed B-cell reconstitution (Figure 6). Consistent with this, marrow and skin B cells were undetectable or barely detectable at week 10 in both IL-7– and placebo-treated animals. Monocyte and NK cell counts were unaffected (data not shown).
CD8 T- and B-cell counts in blood and LNs.
Counts of CD8 T cells (A,C) and B cells (B,D) in blood and percent CD8 T cells (E) and B cells (F) in axillary LNs. Animals were treated with IL-7 (filled symbols) or placebo (open symbols) between 6 and 10 weeks after transplantation (indicated by the black horizontal bar). “Norm” shows values determined in normal animals of similar age as the animals receiving transplants. In one placebo-treated animal, LN sampling at 5 to 6 months after transplantation was not done. For the LNs, percents of total LN cells are given.
Potential toxicity of IL-7
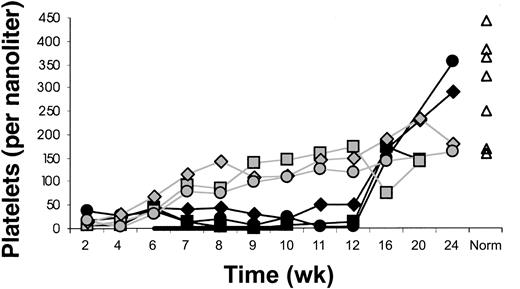
Platelet counts were lower in IL-7–treated than placebo-treated animals (Figure 7). This may have resulted from decreased marrow production because megakaryocytes at week 10 appeared to be decreased in IL-7 compared with placebo-treated animals (Figure 4). Decreasing platelet counts during IL-7 treatment from more than 100 to less than 40 × 109/L were also noted in J99202 and A00066 (the pilot experiment animals that received IL-7 after 3 months after transplantation).
Delayed platelet count recovery.
Delayed recovery of platelet counts in IL-7–treated (filled symbols) compared with placebo-treated (open symbols) animals. Animals were treated with IL-7 or placebo between 6 and 10 weeks after transplantation (indicated by the black horizontal bar). The differences in platelet counts were significant (mean 23 versus 99 × 109/L at week 8, P = .03; 17 versus 121 × 109/L at week 10, P = .002; and 23 versus 148 × 109/L at week 12, P = .004). “Norm” shows values determined in normal animals of similar age as the animals receiving transplants.
Severe neutropenia (≤ 0.2 × 10⁹/L) developed after week 6 in 2 of 3 IL-7–treated and 0 of 3 placebo-treated animals. Severe neutropenia did not develop in J99202 or A00066 animals.
Hemolytic anemia developed in 2 of 3 IL-7–treated animals (K99307 and M99267) and 0 of 3 placebo-treated animals. In both cases, nadir hemoglobin levels were below 7 mg/dL, peak reticulocyte counts above 140 × 109/L (above 10%), and nadir haptoglobin levels below the detection limit. Blood smears were negative for intraerythrocytic parasites. Direct antiglobulin (Coombs) test was weakly positive for complement in K99307 and negative in M99267; however, a negative test does not rule out autoimmune etiology because the antihuman antibody used in the assay (kit purchased from Ortho Clinical Diagnostics, Raritan, NJ) may not cross-react with baboon antigens. In K99307 the anemia was diagnosed on day 62, was associated with a cold agglutinin, and recovered by day 125, possibly due to the discontinuation of IL-7 on day 69 or warming the animal with a heat lamp. In animal M99267 the anemia was diagnosed on day 153, was not associated with a cold agglutinin, and responded to prednisone. Decreasing hemoglobin levels during IL-7 treatment were also noted in A00066 and J99202; tests to distinguish increased destruction versus decreased production were not done.
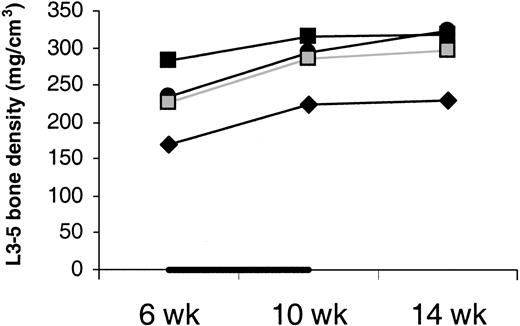
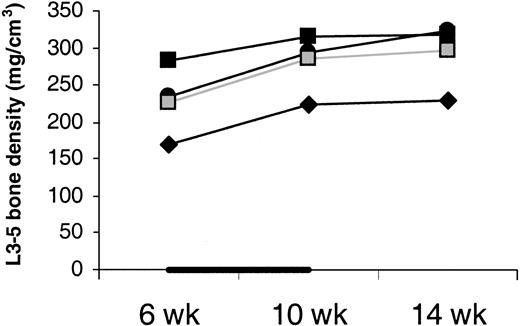
Bone density did not drop between week 6 and 10 in IL-7–treated animals (Figure 8). This argues against IL-7 causing osteoporosis. Moreover, bone biopsy was taken from J99202 before and at the end of IL-7 treatment and stained for osteoclasts.45 No increase in osteoclasts was observed.
Density of cancellous bone.
Average density of the cancellous bone of vertebral bodies L3, L4, and L5 shows no decrease with IL-7 treatment. Animals were treated with IL-7 (filled symbols) or placebo (open symbols) between week 6 and 10 (indicated by the black horizontal bar). Bone density was measured in only one placebo-treated animal.
Lymphoma had not developed by 5 to 6 months after transplantation. In the 3 animals treated with IL-7 from the main experiment, this was documented by the absence of a mass on autopsies of M99149 and K99307 at 6 months and a CT scan of M99267 at 5 months after transplantation. Autopsies of J99202 and A00066 (5 and 6 months after transplantation) were also negative for a mass.
Loss of fat or increased density of fatty tissue on CT was noted in 3 of 3 IL-7– and 0 of 3 placebo-treated animals (Figure9). This was improved on the scans at week 14. It was not associated with weight loss or clinical problems. This could conceivably be due to T-cell infiltration of fatty tissue because in one week 10 skin biopsy from an IL-7–treated animal that happened to be deep enough to contain subcutaneous fat, the fat was markedly infiltrated with T cells.
Loss of fat or increased density of fatty tissue in an IL-7–treated male animal at week 10.
This is particularly notable in the area between symphysis pubis and urethra (arrows) and laterally from the rectum (arrowheads). The circular area underneath the rectum represents the tail. For orientation, femoral vessels are marked by stars. All 3 pictures have windows set at 260/0 HU.
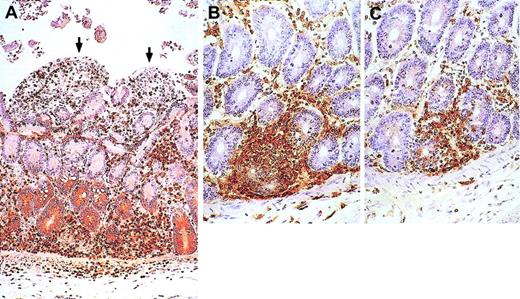
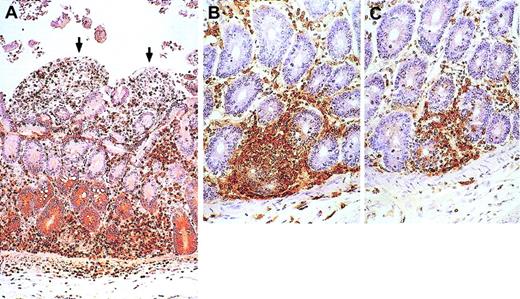
Two additional problems, possibly related to IL-7, were noted—asymptomatic myocarditis in J99202 and symptomatic graft-versus-host disease (GVHD)–like disorder in A00066. Autopsy of J99202 at 6 months after transplantation (2 months after finishing IL-7) was notable for thick and mushy walls of the heart ventricles. Microscopically, there was T-cell infiltration of the myocardium with areas of degenerating cardiomyocytes (granular cytoplasm, indistinct cellular borders). No inclusions or syncytia were noted, suggesting autoimmune rather than viral etiology. A00066 developed diarrhea during the first week of IL-7 administration. Diarrhea continued through the rest of the 1-month period of IL-7 treatment and thereafter until the animal was humanely killed at 5 months after transplantation (1 month after finishing IL-7). Despite normal or increased oral intake, weight dropped from 5.4 kg at the start of IL-7 to 4.8 kg at the end of IL-7 treatment and 4.0 kg at death. The weight loss was associated with hypoalbuminemia, hypocalcemia, and hypoglycemia, suggesting malabsorption. Autopsy showed a GVHD-like disease (Figure10). Of the 6 animals in the main experiment, 2 IL-7–treated and 2 placebo-treated animals were subjected to autopsy at 6 months after transplantation. In these 4 animals, neither myocarditis nor GVHD-like disease was noted.
Animal with GVHD-like disease.
Small bowel from the animal that developed GVHD-like disease shows enterocyte denudation (arrows) and T cells (brown) infiltrating the lamina propria. (A) CD3 immunostain. (B-C) Close-up views immunostained for CD4 (B) and CD8 (C) show damage to basal crypts. Macroscopically, small bowel mucosa showed flat villi. All other organs sampled were infiltrated with T cells (both CD4 and CD8), including colon, kidneys, heart, skin, lungs, pancreas, and liver. In the liver, T cells infiltrated more the portal spaces than the parenchyma. In agreement with that, during IL-7 administration alkaline phosphatase peaked at 26 times above baseline, γ-glutamyltransferase 12 times above baseline, alanine aminotransferase 2 times above baseline, and bilirubin 3 times above baseline. The thymus was small, barely visible, at autopsy and microscopically contained few CD3+ cells (both CD4+ and CD8+); the corticomedullary junction was indistinct. Spleen and mesenteric LNs were moderately enlarged, whereas axillary and inguinal LNs were of normal size. No germinal centers were present; most cells in the spleen (both in the white and red pulp) and in the LNs were T cells (both CD4+ and CD8+); B cells (CD20+) were markedly decreased. Viral inclusions or syncytia were not seen in any of the organs sampled. Original magnifications, × 30 (A) and × 50 (B-C).
IL-7–neutralizing antibodies and IL-7 levels
Neutralizing antibodies developed by week 10 in M99267, did not develop in M99149 (the best responder by CD4 counts—filled circles in Figure 1A), and were indeterminate in K99307 due to the presence of an inhibitor of the growth of the IL-7–dependent cell line in all serum samples, including those from before transplantation and from 6 weeks after transplantation. Neutralizing antibodies also developed in J99202 and not in A00066.
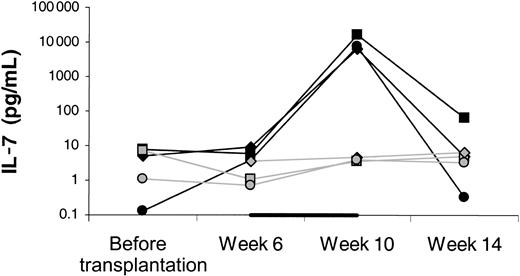
Serum IL-7 levels increased approximately 1000-fold in the IL-7–treated animals by the end of treatment, whereas the levels remained stable in the placebo-treated animals (Figure11).
Serum levels of IL-7 determined by ELISA.
Week 6 levels were determined immediately before starting IL-7 or placebo and week 10 levels approximately 12 hours after the last injection of IL-7 or placebo. Filled symbols indicate IL-7–treated animals; open symbols, placebo-treated animals. The black horizontal bar indicates the fact that treatment with IL-7 or placebo was given between 6 and 10 weeks after transplantation.
Discussion
Here IL-7 was shown to increase CD4 T-cell counts in primates after hematopoietic cell transplantation. At the same time, potential side effects were noted, in particular, thrombocytopenia and a GVHD-like disease. The increase in CD4 T-cell counts occurred through the stimulation of peripheral expansion. Disappointingly, stimulation of de novo generation, which might broaden T-cell repertoire, was not observed. Nevertheless, stimulation of peripheral expansion alone might be of benefit. In mice, infections as well as tumors regressed as a result of IL-7–induced expansion of T cells.46-49 These results suggest that clinical trials are warranted, to test whether antiviral or antitumor activity of endogenous or infused T cells can be enhanced by IL-7. Our results suggest that patients participating in such trials should be carefully observed for hematologic toxicity and autoimmunity/GVHD. Patients with preexisting autoimmunity/GVHD should be excluded from such trials.
The reason that IL-7 stimulated de novo generation in mouse models13,24,50 but not in the monkeys is unclear. The following possibilities exist: (1) A molecule other than IL-7 may be the homeostatic regulator of T-cell counts in primates. As T cells in the IL-7–treated baboons expanded, this putative regulator may have caused decreased T-cell generation de novo. (2) Neutralizing antibodies may have prevented the binding of IL-7 to IL-7 receptors on thymocytes. However, this is unlikely because there was no significant increase in TRECs in the animals that did not develop neutralizing antibodies (M99267 and A00066). (3) In bone marrow, IL-7 or the T cells infiltrating the marrow may have inhibited the production of thymocyte precursors or thymic dendritic cell precursors. (4) Filgrastim (G-CSF) given during the neutropenia associated with IL-7 treatment may have inhibited the generation of T cells.51 Interestingly, the animals that did not receive G-CSF during IL-7 treatment had higher increases in circulating TREC+ CD4 T cells (4.3-fold in K99307 and 5.2-fold in J99202) than the animals that during IL-7 treatment received G-CSF (1.4-fold, 2.3-fold, and no increase, respectively, in M99267, M99149, and A00066). Contrary to the original hypothesis, de novo generation may have been inhibited by IL-7, as suggested by lower TREC+ CD4 T-cell counts at 5 to 6 months after transplantation (Figure 1A) and lower thymic volume at 10 to 14 weeks after transplantation (Figure 2) in IL-7– versus placebo-treated animals. This is consistent with a recent observation that in normal macaques TREC+ T-cell counts declined during and after IL-7 treatment.52
B-cell counts were not increased by IL-7 in our monkeys. Whereas rodent B lymphopoiesis is critically dependent on IL-7, our results as well as those of other investigators suggest that primate B lymphopoiesis is not significantly influenced by IL-7.52-55 In vitro production of B cells from marrow precursors requires IL-7 in mice but not in humans.53 IL-7, IL-7Rα or Jak3 (intracellular molecule involved in the IL-7 signaling pathway) knock-out mice have greatly reduced B lymphopoiesis, whereas humans lacking IL-7Rγ or Jak3 have intact generation of B cells in the marow.54 Moreover, in nonobese/severe combined immunodeficiency (NOD/SCID) mouse-human hematopoietic cell chimeras, human IL-7 did not stimulate human B lymphopoiesis.55Collectively, these data suggest that IL-7 treatment of patients will not hasten B lymphopoiesis nor stimulate uncontrolled B-cell lymphoproliferation.
Toxicities, possibly attributable to IL-7, included a GVHD-like disease and cytopenias. A GVHD-like disease occurs in about 20% of patients receiving grafts with autologous CD34 cells.56 In humans typically the disease develops within the first 2 months after transplantation and is self-limited,56 whereas in our baboon it developed at 3.5 months after transplantation (within 1 week after starting IL-7) and was life-threatening. We have not observed a GVHD-like disease developing at more than 2 months after transplantation in more than 30 baboons receiving transplants of CD34 cells at our center over the last 10 years (without using IL-7). This and the time of onset of the GVHD-like disease in the affected baboon suggest that IL-7 may have caused the disease. Late cytopenias (≥ 2 months after transplantation) of presumed or documented autoimmune etiology have been reported after human autografting.57 To determine whether late cytopenias occur after baboon autografting, we reviewed the records of baboons receiving transplants at our center in a similar way as the baboons in the present study (using 10.2 Gy total body irradiation and gene-transduced autologous CD34 cells) but without using IL-7. Of 24 baboons surviving more than 56 days with at least one complete blood count performed after day 56, we noted 3 baboons with severe thrombocytopenia (≤ 20 × 109/L), zero baboons with severe neutropenia (≤ 0.2 × 10⁹/L), and 1 baboon with severe anemia (hemoglobin ≤ 7 g/dL) after day 56. The anemia was probably hemolytic because it was associated with macrocytosis (suggesting reticulocytosis) and undetectable haptoglobin; intraerythrocytic parasites were not noted. Thus, severe cytopenias can occur late after transplantation in baboons not treated with IL-7, but the frequency may be higher in those treated with IL-7. A 50% or more decrease in platelet counts occurred in 5 of 5 baboons treated with IL-7. The mechanism (decreased marrow production, increased peripheral destruction, or splenic pooling of platelets) remains to be determined. The trend toward lower numbers of megakaryocytes in the marrows of the IL-7–treated compared with the placebo-treated baboons suggests decreased marrow production as the likely cause. In agreement with that, in mice IL-7 treatment was associated with decreased numbers of granulocyte-erythrocyte-macrophage-megakaryocyte colony-forming units (CFU-GEMMs) in the marrow.58 Interestingly, in the same study IL-7 treatment was associated with increased numbers of CFU-GEMMs in the spleen. This could explain why in mice treated with IL-7, cytopenias have not been described. Concerning the pooling of platelets in the baboon spleen, it may have occurred because the spleen enlarged more with IL-7 than placebo treatment. However, splenic pooling could not be the only cause of the thrombocytopenia because the difference between IL-7– and placebo-treated baboons in the platelet count was large (mean 17 versus 121 × 109/L at week 10; Figure 7), whereas the difference in the splenic volume was relatively small (mean 56 650 versus 31 529 mm3 at week 10; Figure 2). The observed toxicities deserve further work because they might not be observed with optimal dose, dosing frequency, and time of administration after transplantation. It is also possible that a lower dose might stimulate T-cell generation de novo.59
Twelve hours after the last dose of IL-7, IL-7 levels were around 10 ng/mL (3-4 logs above normal). Although we have not performed a formal pharmacokinetic study, this result suggests that in clinical trials IL-7 may need to be given only once a day or even less frequently, or that a lower dose may be effective. The optimal dose for human studies will need to be determined in phase 1 dose-escalation studies. IL-7 levels were very high (> 10 ng/mL 12 hours after the last dose of IL-7 treatment) even in the animals that developed IL-7–neutralizing antibody (M99267 and J99202). This suggests that the ELISA and the functional neutralization assay detected different IL-7 epitopes and that antigen-antibody complexes may have not been effectively cleared in animals treated with IL-7.
In conclusion, several important differences in IL-7 effects between mice and primates have been identified. Similar to mice, IL-7 appears to hasten CD4 T-cell reconstitution in primates. Whereas both de novo generation and peripheral expansion are stimulated in mice, only the latter appears to be stimulated in primates. B lymphopoiesis is stimulated in mice but not primates. Autoimmune disorders were observed in our baboons but not in IL-7–treated mice (they were observed in IL-7 transgenic mice). Loss of fat or increased x-ray density of fat was observed in our baboons but not in mice. Osteoporosis developed in mice but not in baboons. Hematologic toxicity was significant in baboons but not in mice. These findings have important implications for the design of trials testing IL-7 in humans.
This work could not be done without the dedication of the staff of the University of Washington Regional Primate Research Center, in particular, Leslie Falch, Bruce Brown, Ed Novak, Mac Durning, Peggy Smith, Dr Judy Johnson, Dr David Anderson, Dr Steven Kelley, and Dr Maggie Gillen. The dedication and help of the computer tomogram staff was also essential, namely, Olivia Hicks, Mario Ramos, and Pat Manion. We also thank Dr Susan M. Ott for bone histology. We also thank Dr Michel Morre of Cytheris (Vanves, France) for providing the IL-7.
Prepublished online as Blood First Edition Paper, January 23, 2003; DOI 10.1182/blood-2002-08-2671.
Supported by National Institutes of Health grants HL69710, AI46108, CA18221, NCRR00166, DK56465, and DK47754, and a Fred Hutchinson Cancer Research Center (FHCRC) institutional pilot grant (funded by Bristol-Meyers-Squibb, New York, NY).
The publication costs of this article were defrayed in part by page charge payment. Therefore, and solely to indicate this fact, this article is hereby marked “advertisement” in accordance with 18 U.S.C. section 1734.
References
Author notes
Jan Storek, FHCRC, D1-100, 1100 Fairview Ave N, Seattle, WA 98109; e-mail: jstorek@fhcrc.org.

