Abstract
Liver becomes the predominant site of hematopoiesis by 11.5 dpc (days after coitus) in the mouse and 15 gestational weeks in humans and stays so until the end of gestation. The reason the liver is the major hematopoietic site during fetal life is not clear. In this work, we tried to define which of the fetal liver microenvironmental cell populations would be associated with the development of hematopoiesis and found that a population of cells with mixed endodermal and mesodermal features corresponded to hematopoietic-supportive fetal liver stroma. Stromal cells generated from primary cultures or stromal lines from mouse or human fetal liver in the hematopoietic florid phase expressed both mesenchymal markers (vimentin, osteopontin, collagen I, α smooth muscle actin, thrombospondin-1, EDa fibronectin, calponin, Stro-1 antigens, myocyte-enhancer factor 2C) and epithelial (α-fetoprotein, cytokeratins 8 and 18, albumin, E-cadherin, hepatocyte nuclear factor 3 α) markers. Such a cell population fits with the description of cells in epithelial-to-mesenchymal transition (EMT), often observed during development, including that of the liver. The hematopoietic supportive capacity of EMT cells was lost after hepatocytic maturation, induced by oncostatin M in the cell line AFT024. EMT cells were observed in the fetal liver microenvironment during the hematopoietic phase but not in nonhematopoietic liver by the end of gestation and in the adult. EMT cells represent a novel stromal cell type that may be generated from hepatic endodermal or mesenchymal stem cells or even from circulating hematopoietic stem cells (HSCs) seeding the liver rudiment.
Introduction
In adult mammals, hematopoietic stem cells (HSCs) reside in the bone marrow. During ontogenesis HSCs are detected at other sites.1 In the embryo a transitional primitive population of HSCs is found in the yolk sac, while HSCs responsible for definitive hematopoiesis are found in the embryo proper, within the aorta-gonad-mesonephros (AGM) region. HSCs then migrate to the fetal liver, which remains the major site of hematopoiesis until the end of gestation. Bone marrow takes over after birth.
Hematopoiesis in the liver is first detected by 10.5 dpc (days after coitus) in the mouse and by 5 gestational weeks (gw) in humans. The liver becomes the predominant hematopoietic site by 11.5 dpc and 15 gw and stays so until the end of gestation. HSCs in the fetal liver present functional and phenotypic properties distinctive from those of adult bone marrow. They are highly proliferative, and between 13 and 15 dpc there is considerable increase in HSCs numbers.2 Fetal liver HSCs, compared with marrow HSCs, express the membrane glycoproteins AA4.1 and Mac-1.2,3 Fetal liver hematopoietic progenitor cells appear to follow the same differentiation hierarchy as marrow progenitors.4 However, fetal liver progenitors are less strictly lineage restricted,4 and erythroid progenitors are more readily obtained from precursors5 and show a specific pattern of response to cytokines.6 Remarkably, progenitors from fetal liver show a proliferative capacity in culture superior to that of progenitors obtained later in development, from the cord blood or from the bone marrow.7
In the mouse, liver development begins by 8.5 dpc.8Although it has been proposed that the liver parenchyma may derive from the septum transversum mesenchyme, lineage tracing studies and tissue explant coculture experiments strongly support that hepatocytes descend directly from the endoderm.8,9 The precardiac and the septum transversum mesenchymes are necessary for hepatic specification, inducing the ventral foregut endoderm to proliferate and subsequently adopt a hepatic fate, forming the liver bud.8,10 A number of cytokines are critical for hepatic differentiation and maturation. Liver is induced in the endoderm by convergent fibroblast growth factor (FGF) and bone morphogenetic protein (BMP) signaling from cardiac mesoderm and septum transversum mesenchyme.11 Hepatic differentiation from embryonic stem cells also involves FGF at an early stage of culture, while hepatocyte growth factor (HGF), oncostatin M (OSM), glucocorticoids, and insulin are involved in subsequent maturation.12
Cells resulting from the early hepatic differentiation of endoderm (hepatoblasts) are bipotent cells able to give rise to mature hepatocytes and bile duct epithelial cells, both of which morphologically differentiate during the second half of fetal development and during the first few postnatal days in the mouse.13 Hepatoblasts, contrary to hepatocytes, are round, nonpolarized cells and express weakly, or not at all, some membrane antigens expressed by hepatocytes.14 In addition, hepatoblasts express α-fetoprotein (AFP), insulin-like growth factor-2 (IGF), IGF-binding proteins, and some ribosomal proteins not expressed by hepatocytes.15 Hepatocytic maturation is marked by the expression of a number of genes, proteases (eg, cathepsin L), acute phase proteins (eg, orosomucoid), enzymes involved in the metabolism of nucleotide intermediates (eg, nicotinamide methyl-transferase), of glucids (eg, glucose-6-phosphatase), and of amino acids (eg, tyrosine-aminotransferase) characteristic of the different liver metabolic functions.15,16 Finally, many proteins, such as cytokeratins 8 and 18 and albumin, expressed by hepatoblasts continue to be expressed by hepatocytes.13 15
In many respects, hepatoblasts appear similar to oval cells proliferating in response to liver damage.17 Oval cells are thought to be related to liver stem cells.13 Liver stem cells express HSC markers such as Thy-1 and c-kit18,19 and would produce not only hepatocytes and bile epithelial cells belonging to the adult liver but also generate pancreas and even intestine.20-22 However, larger differentiation potential may be the consequence of stem cell plasticity, unrelated to hepatic stem cells as such. Recent data indicate that HSCs may give rise to hepatocytes.23,24Reconstitution of the liver would therefore result from 3 cell types, depending on the nature and the anatomic site of the injury: hepatocytes,25 intrahepatic periportal/periductular stem cells/progenitors (oval cells), and extrahepatic stem cells.26-30 The reason the liver is the major hematopoietic site during fetal life is not clear. That the bone marrow is not yet mature at this period and that fetal HSCs present specific characteristics do not explain the specific HSC homing to the fetal liver tissue. In this work we tried to define which of the microenvironmental cell populations within the fetal liver would be associated with the development of hematopoiesis and found that a population of cells with mixed endodermal (epithelial) and mesodermal features corresponds to the hematopoietic-supportive fetal liver stroma. Such a cell population fits with the description of cells in epithelial-to-mesenchymal transition (EMT), often observed during development,31,32 including that of liver.33 34 This population disappears by the end of gestation, being replaced by hepatocytes.
Materials and methods
Cell cultures
Human embryonic and fetal tissues were obtained from voluntary or therapeutic abortions performed in compliance with the French legislation. Developmental stages, indicated in weeks after conception, were estimated from the menstrual history and confirmed on anatomic criteria.
C57BL/6 mice were mated overnight, and noon of the day of the vaginal plug was defined as 0.5 dpc. At specified times (11.5, 12.5, 14.5, and 18 dpc), mice were killed by cervical dislocation, and the uteri were removed from the peritoneum and washed with several changes of Iscove modified Dulbecco medium (IMDM). Livers were removed from embryos by microdissection.
Human or murine fetal liver cells were dispersed in Hanks balanced salt solution containing 5% (vol/vol) fetal calf serum (FCS) by flushing through needles of graded sizes. Single-cell suspensions were obtained by treatment with 250 IU collagenase type I (Sigma, St Louis, MO) for 30 minutes at 37°C and vigorous pipetting. Trypan blue–negative cells (2 × 10⁶/mL) were then cultured in flasks or onto 8-chamber Permanox slides in the long-term culture medium consisting of 50% (vol/vol) Myelocult (StemCell Technologies, Vancouver, BC, Canada), 35% (vol/vol) α-MEM (α–minimum essential medium), and 15% (vol/vol) FCS with 10−6 M hydrocortisone.
Fetal liver stromal cell lines used in this study (AFT024, 2018, and BFC012) were established by culturing stromal cell clones from 14-dpc fetal liver35 and were provided by Kateri Moore (Princeton University, NJ). Cells were cultured in Dulbecco modified Eagle medium (DMEM) supplemented with 20% FCS and 50 μM β-mercaptoethanol. The MS-5 bone marrow stromal cell line was cultured in α-MEM supplemented with 20% FCS. In specified cases, 10 ng/mL oncostatin M (OSM; R&D, Paisley, United Kingdom) was added to the culture medium, and the medium was renewed every other day.
Antibodies
Antibodies directed against epithelial antigens were monoclonal mouse anti–cytokeratin 8 (anti–CK-8) (35βH11 provided by Allen Gown, PhenoPath, Seattle, WA), anti–CK-18 (clone Ks 18.18, Progen, Heidelberg, Germany), anti–CK-19 (clone RCK108, Dako, Glostrup, Denmark), and anti–E-cadherin (clone 67A4, Coulter Clone, Marseille, France) and affinity-purified polyclonal goat anti-AFP (Santa Cruz Laboratory, Le Perray en Yvelines, France) and antialbumin (Santa Cruz). Antibodies directed against mesenchymal antigens were monoclonal mouse antivimentin (clone Vim 13.2, Sigma), anti-ASMA (anti–α smooth muscle actin; clone 1A4, Sigma), antiosteopontin (clone MPIIIB10, Iowa Hybridoma Bank, IA), anticalponin (clone hCp, Sigma), anti–thrombospondin-1 (polyclonal, kindly provided by C. Legrand, Hopital St Louis, Paris, France), anticollagen I (polyclonal, Southern Biology, CA), anti-EDa fibronectin (clone EDa fibronectin [FN3E2], Sigma), and anti–Stro-1 (Iowa Hybridoma Bank, Iowa City, IA). Monoclonal mouse anti–β-actin was from clone AC-15 (Sigma). Goat antimouse immunoglobulin (Ig), mouse antigoat IgG, and goat antirat IgG coupled to Alexa 488 fluorochrome or to fluorescein or to peroxidase were used as secondary antibodies (Molecular Probes, Leiden, Netherlands, and Sigma).
Morphologic analyses of stromal cells
Immunofluorescence.
Cells from human or murine fetal liver or cells from the stromal lines were seeded onto chamber slides (5000 to 10 000 cells per chamber). Adherent layers were examined at optimal confluency (after 5 to 10 days). For detection of cytoskeletal elements, cells were permeabilized and fixed with methanol. For cell surface molecule detection, cells were fixed with 4% (vol/vol) paraformaldehyde and 0.1% (vol/vol) glutaraldehyde. All incubations were performed at 4°C for 30 minutes.
Flow cytometry.
For analysis of membrane antigens, stromal cells grown in flasks were treated with trypsin. Cells in suspension were then stained sequentially with primary antibodies and fluorescein-conjugated secondary antibodies. Cells were also stained with 4 μg/mL propidium iodide in phosphate-buffered saline (PBS) before being passed through a FACSCalibur (Becton Dickinson, Mountain View, CA) flow cytometer. For each analysis, 5000 events were recorded. Appropriate gating was performed using the forward scatter (FSC) versus side scatter (SSC) dot plot and gating out propidium iodide–positive dead cells. The histogram for each antibody was compared with that of the relevant control. For intracellular antigens, cells were first permeabilized with orthopermeaFIX (Ortho Diagnostic System) at room temperature for 45 minutes.
Western blotting.
Adherent layers from stromal lines, grown in flasks, were detached with cold phosphate-buffered saline (PBS) containing 10 mM EDTA (ethylenediaminetetraacetic acid) and then lysed by sonication in a buffer containing PBS, 10 mM EDTA, and 10 μg/mL protease inhibitors (Boehringer Mannheim, Germany). An aliquot of each lysate was removed for protein concentration using the BCA assay (Pierce, Rockville, IL). For sodium dodecyl sulfate–polyacrylamide gel electrophoresis (SDS-PAGE), samples were resuspended in Laemmli buffer (10% [vol/vol] glycerol, 100 mM dithiothreitol [DTT], 2% [wt/vol] SDS, 50 mM Tris (tris(hydroxymethyl)aminomethane)–HCl [pH 6.8], and 0.002% [wt/vol] bromophenol blue), boiled for 5 minutes, and separated on a 10% (wt/vol) polyacrylamide gel. Each lane contained 50 μg proteins. Prestained molecular weight standards were run in parallel. After electrophoresis, proteins were transferred onto nitrocellulose membrane in buffer containing 25 mM Tris-HCl, 192 mM glycine, 20% (vol/vol) methanol, and 0.01% SDS. Nonspecific protein binding sites were blocked by incubation for 2 hours at room temperature in TBST buffer (20 mM Tris-HCl [pH 7.6], 137 mM NaCl, 0.5% [vol/vol] Tween 20) containing 5% (wt/vol) nonfat dry milk. The membrane was then incubated overnight with the primary antibody. After washing with TBST buffer, the membrane was incubated with the secondary antibody for 30 minutes. Proteins were visualized using the ECL detection reagent from Amersham (Little Chalfont, United Kingdom).
RT-PCR.
Total RNA was prepared from cultured AFT024 cells using Trizol (Life Technologies, Rockville, MD.) following the manufacturer's instructions. RNA was converted to cDNA using oligo-dT primer and Superscript II reverse transcriptase (Invitrogen, San Diego, CA). For polymerase chain reactions (PCRs), 100 ng of the cDNA pool was amplified. PCR cycles were optimized for each set of primers. Primer sequences were as follows: MEF2C (myocyte-enhancer factor 2C), forward (fwd): 5′-CCATTGGACTCACCAGACCT-3′, reverse (rev): 5′-AGCACACACACACACTGCAA-3′; HNF3α, fwd: 5′-CCCCTTTCTCCCTTTCACTC-3′, rev: 5′-TGGGCCTAACAACAACAACA-3′.
Cobblestone area–forming cell (CAFC) assays
Depletion of lineage-positive cells.
Six to 10 C57BL/6 female 4- to 8-week-old mice were killed. Bone marrow cells were repeatedly flushed from femurs and tibias using PBS with 10% FCS. Aggregates were dissociated by passing cells through 23-gauge needles. The single-cell suspension (total of 108 cells per mL) was then incubated for 20 minutes at 4°C with a mixture of monoclonal rat antibodies (Becton Dickinson) directed against membrane antigens specific for red cells (Ter119), B lymphocytes (B220, clone RA3-6B2), T lymphocytes (CD4, clone GK1.5; and CD8, clone 53-6.5), granulocytes (Gr-1, clone RB6-8C5), and myelomonocytic cells (Mac-1, clone M1/70). Cells were then incubated with magnetic beads coated with goat antirat IgG (Miltenyi, Cologne, Germany) for 15 minutes at 4°C and passaged through a magnetic column to enrich for lineage-negative cells (lin−) not expressing lineage antigens.
Progenitor cell assays.
A total of 500 to 1000 lin− cells were plated in 35-mm dishes containing 1% (wt/vol) methylcellulose supplemented with 20% FCS, 2% (wt/vol) bovine serum albumin, 10−4 M 2 β-mercaptoethanol, 10 ng/mL recombinant murine (rmu) interleukin-3, 50 ng/mL rmu stem cell factor, 2 U/mL recombinant human (rhu) erythropoietin, and 10 ng/mL rhu thrombopoietin (all cytokines from AbCys, Paris, France). Cultures were incubated at 37°C in a 5% CO2 humidified atmosphere, and colonies were enumerated after 10 to 14 days.
CAFCs.
Stromal cells from the different lines were subcultured in 96-well plates precoated with 0.1% (wt/vol) gelatin and grown to confluence. Confluent plates were irradiated at 20 Gy and maintained at 37°C.
Sorted lin− cells were seeded at limiting dilution on the pre-established irradiated adherent layers treated or not with OSM (10 ng/mL) in the long-term culture medium. Dilutions ranged from 2000 to 1 lin− cells per well. Eight to 32 replicate wells were tested for each cell dilution. Cultures were incubated for 5 weeks at 37°C, 5% CO2 with weekly half-medium change. Wells with hematopoietic colonies were scored every week. CAFC frequency was estimated by plotting the proportion of negative wells versus the number of cells per well. Poisson distribution of the clonogenic cells was checked (linear regression, no intercept with the y- or x-axis), and the frequency measured using the value obtained for 37% negative wells.
Transmission electron microscopy studies
Livers collected from embryos and fetuses were fixed at 4°C in 2.5% (vol/vol) glutaraldehyde in PBS for 90 minutes, washed twice in PBS, postfixed in 2% (wt/vol) osmium tetroxide, dehydrated in graded ethanol, and embedded in epoxy resin. Thin sections (76 nm) were cut and examined with a JEOL 100C electron microscope after uranyl acetate and lead citrate staining.
Immunofluorescence studies of mouse liver biopsies
Livers collected from embryo, fetus, and adult mice as indicated above were fixed in 4% (vol/vol) paraformaldehyde in PBS for 12 hours at 4°C, rinsed in PBS, and then twice in 15% (wt/vol) sucrose in 0.12 M phosphate buffer for at least 24 hours. The tissue was then embedded in 15% (wt/vol) sucrose, 7.5% (wt/vol) gelatin in 0.12 M phosphate buffer and frozen in isopentane at the temperature of liquid nitrogen and then stored at −20°C. Five-micron–thick frozen sections were thawed, hydrated in PBS, and treated with acetone at −20°C for 15 minutes. Sections were sequentially incubated for 1 hour each at room temperature with monoclonal rat Ter119 or mouse 35βH11 and then with goat antirat or goat antimouse antibodies coupled to Alexa 488. The 1A4 monoclonal mouse antibody directly coupled to cyanin-3 (Cy3) was then added. For negative controls, the primary antibodies were omitted or replaced by unrelated isotype-matched immunoglobulins. Slides were mounted in Mowiol (Calbiochem, La Jolla, CA) and examined and photographed under a DMR HC fluorescence microscope (Leica, Vienna, Austria) using a planapo oil immersion objective (25 × or 63 ×).
Statistical analysis
Results are given as mean ± standard error (m ± sem). Comparisons between means were made using the Studentt test and Mann-Whitney nonparametric U test.
Results
Stroma from hematopoietic fetal liver consists of a cell population with both epithelial and mesenchymal features
To characterize the phenotype of cells making up the fetal liver microenvironment, we generated long-term cultures of liver cells from 14-gw human and 14.5-dpc murine fetuses. The adherent cell layer was examined after 5 to 10 days in culture. As shown in Figure 1, double immunofluorescence using the anti-ASMA 1A4 monoclonal antibody coupled to Cy-3 and the 35βH11 anti–cytokeratin-8 (anti–CK-8) monoclonal antibody labeled with Alexa 488 revealed a population that coexpressed the mesenchymal marker ASMA and the epithelial marker CK-8. ASMA was localized in microfilaments forming stress fibers in human cells (Figure 1A) or a cortical network in murine cells (Figure 1B), while CK-8 formed perinuclear intermediate filaments in both human and murine cells (Figure 1A-B). We confirmed this phenotype on the clonal stromal cell lines derived from 14-dpc murine fetal liver, AFT024 and 2018. Most cells from these lines coexpress ASMA and CK-8 (Figure 1C-D). ASMA was present in stress fibers and in filopodia in AFT024 cells (Figure 1C) and in stress fibers and a cortical network in 2018 cells (Figure 1D), while CK-8 was detected in perinuclear intermediate filaments in cells from both lines (Figure 1C-D). This phenotype is reminiscent of an epithelial-to-mesenchymal transition (EMT) as described by others using vimentin33 or desmin and ASMA34 as mesenchymal markers and cytokeratins as epithelial marker.
Immunofluorescence of stromal cells from hematopoietic fetal liver.
(A) A 14-gw human fetal liver; (B) 14.5-dpc murine fetal liver; (C) AFT024 cell line from 14-dpc liver; and (D) 2018 cell line from 14-dpc liver. Fetal liver cells were obtained and cultured for 10 days in long-term culture medium; cells were then fixed and double-immunostained with Cy3-conjugated mouse anti-ASMA (red) and mouse anti–CK-8 (green; fluorescent secondary antibody was fluorescein isothiocyanate [FITC]–conjugated goat antimouse immunoglobulin). Panels show an overlay of the fluorescence signal from the 2 channels (red and green) to visualize a coexpression of the epithelial and mesenchymal marker. Expression of ASMA in cell lines is so intense that the signal appears yellow instead of red. Scale bar = 10 μm.
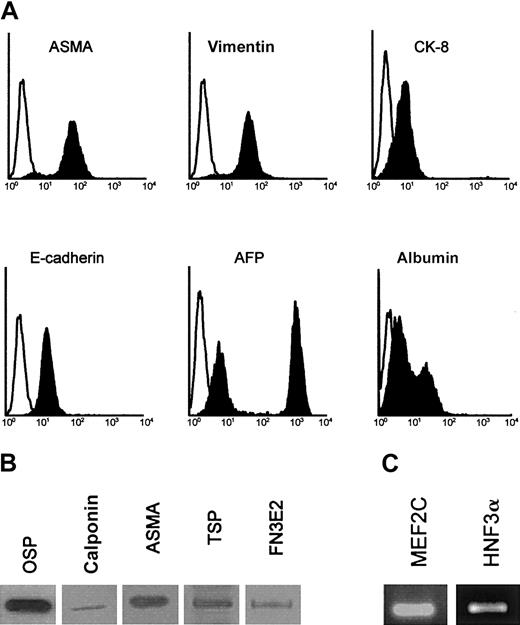
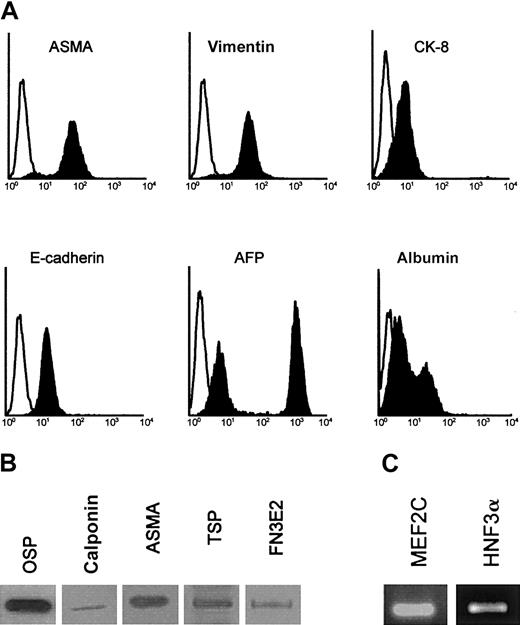
To further characterize this EMT, permeabilized AFT024 cells and 2018 cells (not shown) were analyzed by flow cytometry (Figure2A), Western blotting (Figure 2B), and reverse transcriptase (RT)–PCR (Figure 2C). AFT024 cells not only expressed CK-8 and ASMA but also expressed the following mesenchymal markers previously used for stromal cell characterization36,37: vimentin, osteopontin, and collagen I (osteogenic differentiation), calponin, thrombospondin-1, and the fibronectin isoform comprising the alternatively spliced EDa domain (EDa FN) (vascular smooth muscle differentiation). We also found that AFT024 cells expressed the myogenic transcription factor MEF2C38 that plays a role for smooth muscle recruitment in early development and the membrane antigen Stro-1, which is found positive in vascular smooth muscle cells and pericytes.39 The following epithelial markers were also expressed: α-fetoprotein (AFP), albumin, and the liver-specific transcription factor HNF3α (hepatocyte nuclear factor 3 α). In fluorescence-activated cell sorter (FACS) studies, 2 peaks were observed for AFP and albumin, identifying 2 subpopulations of cells, one with high expression and the other with low expression of the markers.
Phenotypic analysis of AFT024 cells.
(A) AFT024 cells were cultured for 5 days and permeabilized before staining of intracellular components and FACS analysis. Specific stainings are indicated by blackened histogram, and isotype control is shown as open histogram. (B) Western blots for mesenchymal markers: osteopontin (OSP), calponin (calp), ASMA, thrombospondin-1 (TSP), and EDa fibronectin (FN3E2) in AFT024 cells. (C) RT-PCR analysis of the myocyte-enhancer factor (MEF2C) and hepatocyte nuclear factor (HNF3α) in AFT024 cells.
These data indicate that stromal cells with both epithelial (CK-8+, AFP+, E-cadherin+, albumin+, and HNF3α+) and mesenchymal (vimentin+, osteopontin [OSP+], collagen I+, ASMA+, calponin+, thrombospondin-1 [TSP-1+], EDa FN+, Stro-1+, and MEF2C+) features are generated from hematopoietic fetal liver, whether of human or murine origin. In the AFT024 cell line, cells with epithelial features range from cells poorly differentiated toward the hepatocytic lineage (high AFP and low albumin expression) to cells that appear more mature in this pathway (low AFP and high albumin expression).
The population of EMT cells is no longer detected in late gestation fetal liver
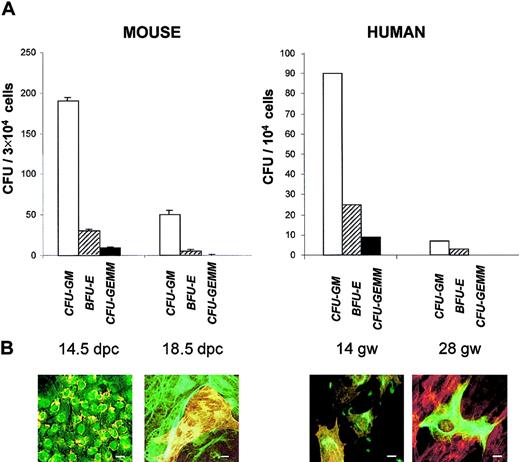
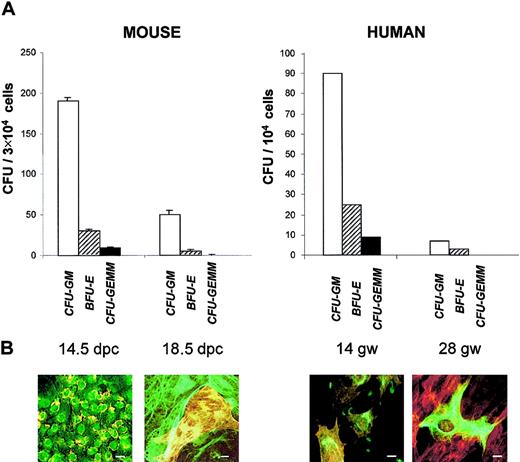
Hematopoiesis in fetal liver is known to peak by 12.5 to 14.5 dpc in the mouse and by 12 to 20 gw in humans and to decrease by the end of gestation. We looked for this decline in hematopoietic capacity by assessing clonogenic progenitors on nonadherent cells from the long-term cultures. Liver cells were cultured for 10 days in the long-term culture medium and then collected and plated for colony-forming units (CFUs) that were enumerated after 10 days in methylcellulose (Figure 3A). Between 14.5 and 18 dpc, there was a highly significant (P < .02) decrease in granulocyte macrophage CFUs (CFU-GMs) (4-fold), erythroid burst-forming units (BFU-Es) (3-fold), and granulocyte, erythroid, macrophage, megakaryocyte CFUs (CFU-GEMMs) (12.5-fold). Similarly, cultures from human fetal liver revealed a decrease in CFU-GMs (5-fold), BFU-Es (12-fold), and CFU-GEMMs (10-fold) between 14 and 28 gw.
Time course of CFUs and stromal cells' phenotype with gestational maturation of murine and human livers.
(A) Colony-forming cells (assayed in methylcellulose). Results represent the mean ± sem of data from 3 experiments for mouse CFUs and 1 experiment for human CFUs. (B) Immunofluorescence studies (performed after 10 days' culture onto chamber slides, as described in Figure 1). In the mouse at 14.5 dpc, almost all cells are double-labeled with anti–CK-8 (green) and anti-ASMA (yellow, because of the intensity of the labeling). At 18.5 dpc, there is a focus of ASMA+, CK-8− myofibroblasts surrounded by ASMA−, CK-8+ hepatocytes. For human cells at 14 gw, all cells are double-labeled with anti–CK-8 (green) and anti-ASMA (red). At 28 gw, ASMA−, CK-8+hepatocyte is surrounded by ASMA+, CK-8−myofibroblasts. Scale bar = 10 μm. Liver cells were cultured for 10 days in long-term culture medium and then collected for CFU and immunofluorescence studies.
Phenotypic analyses on adherent cells were performed in parallel to clonogenic assays (Figure 3B). By 18 dpc the population expressing both mesenchymal and epithelial markers was no longer detected. Instead, 2 populations were apparent. One population, comprising approximately 70% of the adherent cells, was made of large cells expressing CK-8 in a conspicuous intermediate filament network. The other population consisted of cells expressing ASMA in conspicuous stress fibers. A similar pattern was observed for liver cells from a 28-gw human fetus. These data indicate that, at late gestation time when hematopoiesis has severely declined, EMT cells, characteristic of the hematopoietic florid phase, are replaced by a majority of epithelial cells resembling mature hepatocytes and a minority of mesenchymal cells similar to hepatic Ito cells/myofibroblasts.
Oncostatin M directly affects the stromal cell phenotype, down-regulating EMT and up-regulating hepatocytic differentiation
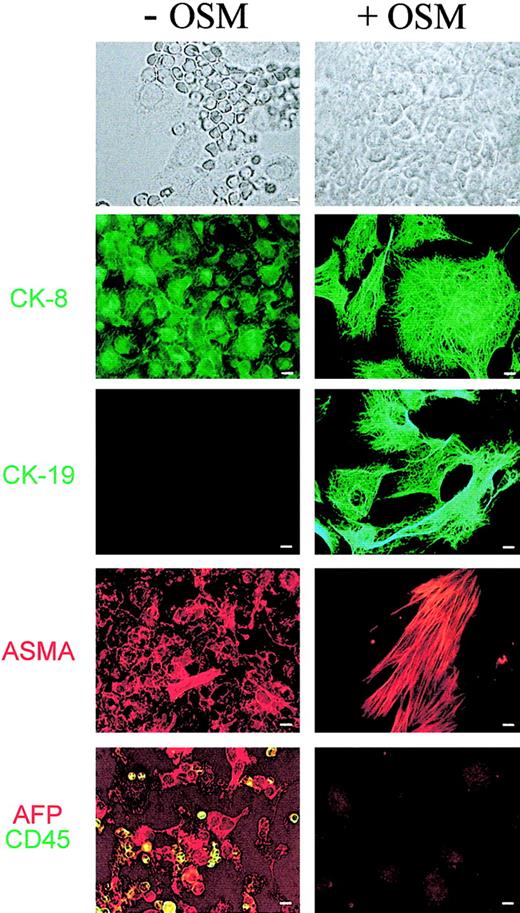
The data above suggest that hematopoiesis in fetal liver is associated with a specific stromal cell population with EMT features. One way to confirm this association was to induce in culture the maturation of fetal hepatocytes and examine whether intrinsic hematopoiesis was consequently affected. Previous studies have established that oncostatin M (OSM) is one factor responsible for this maturation.16,40 41 We added 10 ng/mL recombinant mouse OSM to long-term fetal liver cultures established from 14.5-dpc murine fetus. Morphologic analyses were performed on cultures grown for 10 days with or without OSM. Results are shown in Figure4. In culture without OSM, most of the cells had EMT features: oval, nonrefringent, and expressing CK-8 (but not CK-19), AFP, and ASMA. These cells were surrounded by hematopoietic cells: smaller, round, refringent, and expressing CD45. In OSM-supplemented cultures, hematopoietic cells were no longer apparent. The adherent layer was made of tightly packed polygonal cells with prominent nuclei. Most of these cells showed extended intermediate filaments, containing either CK-8 or CK-19, and expressed low cytoplasmic levels of AFP (and high levels of albumin; not shown). A distinct subpopulation is made of cells with conspicuous ASMA+ stress fibers but lacking expression of CK-8, CK-19, and AFP (also albumin-negative, not shown). These data indicate that the addition of OSM results in the disappearance of hematopoietic cells and the replacement of the EMT population by hepatocytes and myofibroblasts. Addition of OSM mimics, therefore, what is observed during fetal liver development, from the hematopoietic florid period until the end of gestation.
Effect of OSM on murine fetal liver cells from primary cultures.
Fetal hepatic cells derived from 14 dpc fetal liver were cultured for 10 days in long-term culture medium in the absence or presence of 10 ng/mL OSM. Cells were then washed, fixed, and stained with mouse anti–CK-8, –CK-19 (green), and -ASMA (red). Cells were also double-labeled with antibodies to epithelial and hematopoietic cells using goat anti-AFP (red) and rat anti-CD45 (green). Each panel represents a different field. Scale bar = 5 μm.
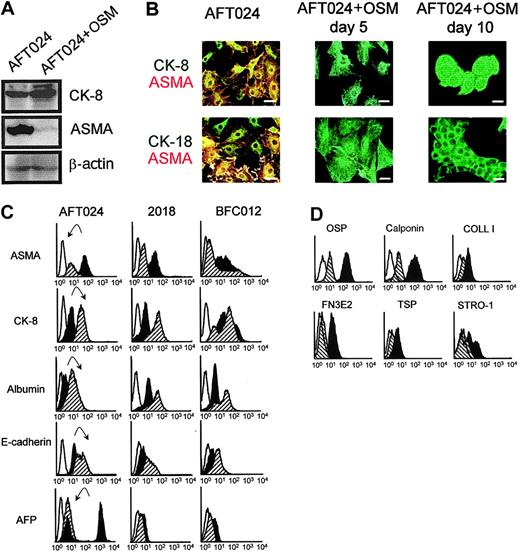
We additionally checked the effect of OSM on the clonal fetal liver line AFT024. Immunoblots, using AFT024 cells treated with or without 10 ng/mL OSM and extracted after 10 days, are shown in Figure5A. Amounts of proteins per lane are similar, as shown by similar band intensity for β-actin. In contrast, in cells treated with OSM, there was an increase in CK-8 and a decrease in ASMA, the band being barely detectable after OSM treatment. Immunofluorescence studies are shown in Figure 5B. In the absence of OSM, most cells coexpressed ASMA (in stress fibers, cortical network, and filopodia) and CK-8 and CK-18 (in perinuclear intermediate filaments). After 5 days' treatment with OSM, ASMA was no longer detected, while the intermediate filament network of CK-8 and CK-18 is more conspicuous. After 10 days' treatment, the cells were packed together, forming cordlike structures. The modulation of several markers after OSM treatment was also evaluated by flow cytometry (Figure 5C). A decrease in ASMA expression (by 2-fold) and an increase in CK-8 (by 3-fold) confirmed results from immunoblots and immunofluorescence studies. In addition, treatment with OSM induced an increase in albumin and E-cadherin expression and the quasi-disappearance of AFP. Moreover, there was a dramatic decrease in all mesenchymal markers tested by flow cytometry after treatment of AFT024 with OSM (Figure 5D): the expression of calponin, osteopontin, EDa fibronectin, thrombospondin-1, and collagen I decreased by 5.5-, 4-, 3-, 2-, and 2-fold, respectively.
Phenotypic analysis of stromal cells from 14 dpc murine fetal liver lines treated or not with OSM.
(A) Western blots for CK-8 and ASMA of AFT024 cells cultured in the absence or in the presence of OSM for 5 days. (B) Immunofluorescence studies of AFT024 cells treated or not with OSM. Cells were permeabilized and double-stained with mouse anti–CK-8 or –CK-18 (green) and mouse anti-ASMA–Cy3 (red). At day 5 and 10 there is no ASMA labeling. Scale bar = 10 μm. (C) FACS analysis of 3 stromal cell lines treated or not with OSM. Cells were analyzed for expression of intracellular components ASMA, CK-8, albumin, and AFP and of the cell surface marker E-cadherin. The histograms compare the levels of each marker in the presence or absence of OSM. Each panel represents an overlay of the fluorescence signal obtained with untreated (dark histogram) or treated cells (hatched histogram). Open histogram represents background staining with appropriate isotype control antibodies. A representative example of 3 experiments is shown. The arrows pointed down indicate down-regulation; arrows pointed up, up-regulation. Fluorescence intensity is indicated on the x-axes (C-D). (D) AFT024 cells treated or not with OSM were analyzed as described in panel C for the expression of other mesenchymal markers: osteopontin (OSP), calponin, collagen I (COLL I), EDa fibronectin (FN3E2), thrombospondin (TSP), and Stro-1 antigens.
Flow cytometry analysis was also performed on clonal lines 2018 and BFC012 (Figure 5C). Compared with AFT024, these lines expressed higher basal levels of CK-8, lower levels of ASMA, and levels of AFP just above background. OSM-induced modifications of the markers were more clear-cut in 2018 cells (decrease in ASMA, increase in albumin and in CK-8) than in BFC012 cells (decrease in ASMA, increase in albumin, but not significant in CK-8).
These data indicate that OSM has a direct effect on fetal stromal cells, because its addition induced a shift in the phenotype of stromal cells, from EMT cells (ASMA+, CK-8+, and AFP++) to hepatocytes (ASMA−, CK-8++, and AFP+/−). The shift is more apparent in cells presenting a marked EMT phenotype before treatment (conspicuous shift with AFT024, less obvious with 2018, and barely detectable in BFC012 cells).
OSM-induced modifications in the stromal cell phenotype are associated to a decrease in the hematopoietic supportive ability
To investigate whether OSM-induced hepatocytic differentiation would affect the hematopoiesis supportive ability of fetal liver stroma, we studied the generation of cobblestone area–forming cells (CAFCs) from lineage-negative marrow precursors cocultured for 5 weeks with the 3 fetal liver cell lines (AFT024, 2018, and BFC012) in the presence or absence of OSM. To make sure that the effect of OSM was specific for fetal liver stroma, a bone marrow stromal cell line (MS-5) was subjected to the same CAFC assay. We confirmed that this cell line did not express epithelial markers and did not undergo morphologic change after treatment with OSM (not shown).
We first verified that OSM had no direct effect on the lin− subset of precursors by assaying CFUs from this population cultured in methylcellulose in the presence or absence of OSM. CFU production in the absence of OSM was 155 ± 6.5 per 1000 cells plated. In the presence of OSM it was 157.5 ± 4 with no difference in size or type of colonies.
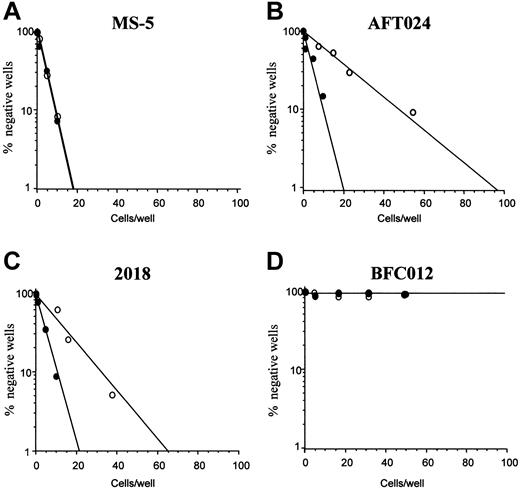
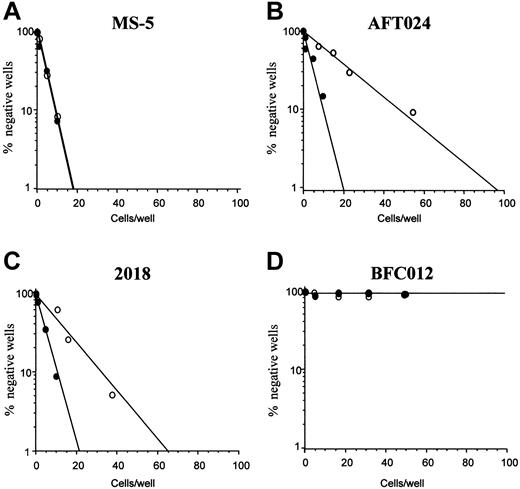
Limiting dilutions for CAFCs generated after 5 weeks from lin− cells cultured on the different stromal feeders (AFT024, 2018, BFC012, and MS-5) in the presence or absence of OSM are shown in Figure 6. CAFC frequency remained the same in the lin− population cultured on MS-5 in the presence or not of OSM (1:9.5 without versus 1:10 with). In contrast, CAFC frequency was significantly (P < .01) reduced after OSM treatment of the stromal lines AFT024 and 2018 (1:18.5 ± 1:5 versus 1:64.5 ± 1:8.2 for AFT024, 1:16 ± 1:5 versus 1:32.5 ± 1:3 for 2018). OSM was most effective on AFT024 where the decrease in CAFC frequency after OSM treatment was 3.5-fold and less effective on 2018 where it was only 2-fold. Finally, for BFC012 cells, the CAFC frequency could be measured only in the first weeks of culture. At week 2, it was 1:36 (± 1:3.5) and not significantly modified after treatment with OSM (1:44 ± 1:3) (not shown). Regardless of OSM, CAFCs were not detected at week 5, confirming the lack of maintenance of immature hematopoietic progenitors this line.35
Effect of OSM on the hematopoietic supportive ability of stromal cell lines.
(A) MS-5 marrow line (negative control); (B) AFT024 fetal liver line; (C) 2018 fetal liver line; (D) BFC012 fetal liver line. Bone marrow lin− cells were seeded at limiting dilution onto the stromal feeders, treated with OSM (○) or not (●). CAFC frequencies (determined at 37% negative wells) were measured at week 5. Data shown are the means of 4 experiments.
These data indicate that, in fetal liver stromal cells, phenotypic modifications are associated with modifications in the hematopoietic supportive ability. Decline in CAFC maintenance appears to correlate with hepatocytic maturation, either from EMT hepatoblasts treated with OSM (in AFT024 and, to a lesser extent, in 2018 cells) or in the absence of OSM treatment (in BFC012 cells).
The in vivo fetal liver microenvironment contains cells similar to EMT hepatoblasts
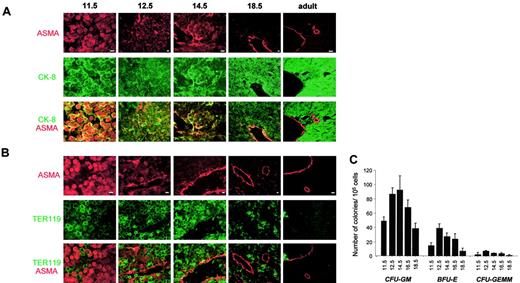
To assess whether cells in EMT are found in fetal liver during the florid hematopoietic phase, we looked for cells expressing both ASMA and CK-8 in biopsies from embryonic, fetal, and adult murine liver. Results are shown in Figure 7A. Most nonhematopoietic cells at 11.5 dpc expressed both ASMA and CK-8. At 12.5 and 14.5 dpc such cells constituted a large subpopulation that tended, at 14.5 dpc, to locate in the vicinity of central veins (although being clearly distinct from pericytes that are more elongated and express only ASMA). At 18.5 dpc and in the adult, the population expressing both ASMA and CK-8 was no longer detectable. Instead, hepatocytes constituting the lobules were CK-8+, while ASMA+ smooth muscle cells and pericytes were observed in the wall of central veins and of portal veins and arteries.
Immunofluorescent studies of mouse liver.
(A) Double immunostaining with Cy3-conjugated anti-ASMA (red) and anti–CK-8 (green). Scale bar = 10 μm. (B) Double immunostaining with Cy3-conjugated anti-ASMA (red) and antierythroblasts, Ter119 (green). Scale bar = 10 μm. (C) Colony-forming units (CFUs). CFU assays were performed on mononuclear cells. Colonies were counted after 10 days. Results (means ± sem) of 3 independent experiments are shown. Stage of development (dpc) is indicated on the x-axis.16,40 41
Biopsies were also stained using anti-ASMA and TER119 (recognizing erythroblasts) antibodies. Results are shown in Figure 7B. In all instances, labeling with TER119 was clearly distinct from that of ASMA. Some erythroblasts are observed at 11.5 dpc. At 12.5 and 14.5 dpc, erythroblasts were very numerous in hepatic lobules and some, circulating, are visible in the central veins. By 18.5 dpc, this population has largely regressed and, in adult liver, erythroblasts were no longer apparent.
The CFU content of embryonic and fetal livers (Figure 7C) was correlated to the number of erythroblasts detected in liver biopsies. There was a maximum at 12.5 to 14.5 dpc and a sharp decline at 18.5 dpc.
All these data were confirmed by a quantitative analysis (Table1) showing the distribution of each cell type throughout the development (11.5 dpc to adulthood): cells expressing CK-8 only (epithelial cells), cells expressing ASMA only (vascular smooth muscle cells and pericytes), cells expressing both markers (EMT cells), and cells expressing Ter119 (erythroid cells). Each percentage represents the number of cells in each category related to the total number of cells. At early stages of development (11.5 dpc) when hematopoietic cells are believed to migrate into the liver and expand, EMT cells were the major nonhematopoietic cell population, comprising 60% (± 3%) of all cells. A dramatic decrease was observed after 11.5 dpc, because at 12.5 dpc the EMT cells were only 18% and at 14.5 dpc 5% (P < .01); moreover, at this time point, these cells were confined to the perivascular spaces. In neonatal and adult stage, this population disappeared while erythroid cells were rare and most parenchymal cells had differentiated along the hepatocytic lineage.
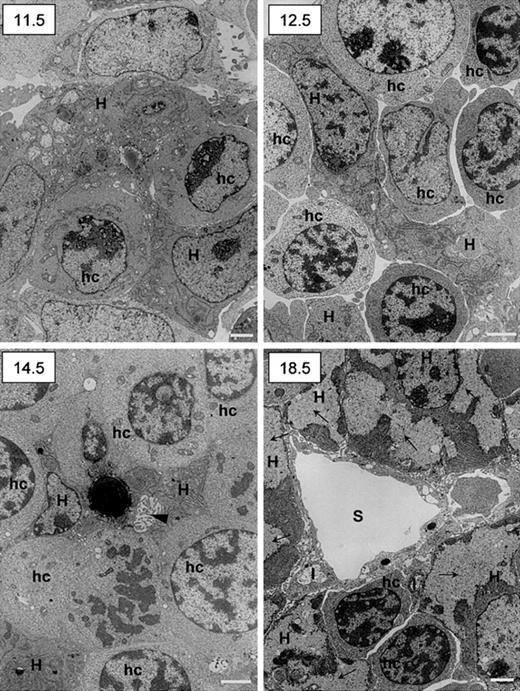
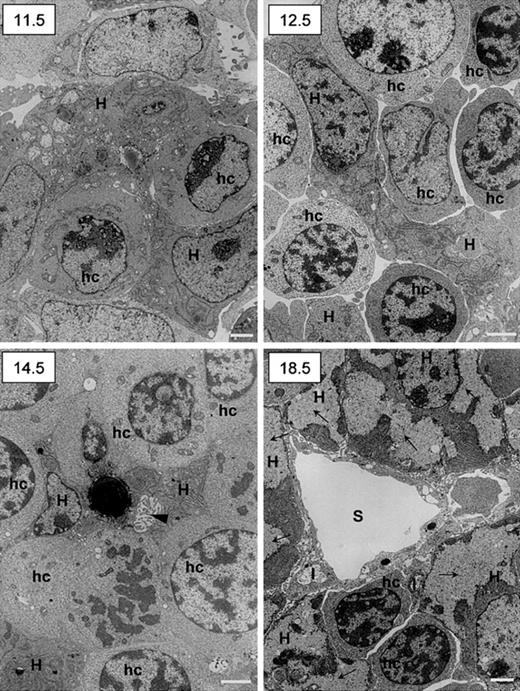
Ultrastructural studies confirmed the intimate relationship between hematopoietic and epithelial cells and showed the maturation along the hepatocytic pathway by the end of gestation. Results are shown in Figure 8. At day 11.5 dpc, few hematopoietic cells not yet clearly differentiated into erythroid lineage were observed among epithelial cells characterized by a clear nucleus with well-delineated nucleoli and the presence in the cytoplasm of numerous large mitochondria and extended rough endoplasmic reticulum. At 12.5 dpc the number of hematopoietic cells with clear-cut erythrocytic features had increased. Remarkably, at 14.5 dpc, bile canaliculi are observed among maturing hepatocytes (one of these contains a large lipid vacuole). At 18.5 dpc, the liver had acquired its definitive adult architecture. Sinusoids were obvious, limited by endothelial cells flanked on their abluminal site by stellate Ito cells. Cells with true hepatocytic features (cytoplasmic glycogen deposits and low nucleus-to-cytoplasm ratio) were numerous.
Ultrastructural studies of murine fetal livers.
The 11.5, 12.5, 14.5, and 18.5 dpc murine livers were fixed and prepared for transmission electron microscopy. Scale bar = 1 μm. H indicates hepatoblasts (11.5, 12.5, and 14.5 dpc) or hepatocytes (18.5 dpc); hc, hematopoietic cells; I, Ito cells; S, sinusoid; arrowhead (14.5), bile canalicule; arrows (18.5), glycogen deposits.
Altogether, these data indicate that EMT stromal cells were observed in the fetal liver microenvironment following a time course parallel to that of hematopoiesis. Such a pattern suggests that this phenotype is related to the development of fetal liver hematopoiesis.
Discussion
Our study suggests that stromal cells (ie, cells with hematopoietic supportive ability) from the fetal liver are cells with epithelial-to-mesenchymal (EMT) features because (1) stromal cells grown (primary cultures or lines) from fetal liver in the hematopoietic florid phase express both mesenchymal (vimentin, osteopontin, collagen I, α smooth muscle actin, calponin, thrombospondin-1, EDa fibronectin, Stro-1 antigens, and MEF2C) and epithelial (α-fetoprotein, cytokeratins 8 and 18, albumin, E-cadherin, and HNF3α) markers; (2) the hematopoietic supportive capacity of EMT cells is lost after hepatocytic maturation, induced in the stromal line AFT024 by oncostatin M (OSM); and (3) EMT stromal cells are observed in the fetal liver microenvironment (in vivo studies on biopsies) during the hematopoietic phase but no longer in nonhematopoietic liver by the end of gestation and in the adult.
Different cell populations that may be responsible for the transient hematopoiesis observed in fetal liver have been described. Epithelial cells (developing hepatocytes) were first considered because of their spatial relationship to hematopoietic cells.42 An epithelial line with hematopoietic support generated from 15-dpc mouse fetal liver.43 Also, c-jun44 and XBP-145 knock-out mice exhibited impairment of both hematopoietic and hepatic lineages. Although the embryonic lethality was due to defective hematopoiesis, HSCs present in these mice were able to reconstitute the entire hematopoietic system in lethally irradiated mice, and embryonic stem cells lacking these genes contributed to all tissues except hepatocytes. Finally, fetal liver epithelial cells were shown to express the CD166 hematopoietic cell adhesion (HCA) molecule operative in the interaction between HSCs and stromal cells.46
Other studies have suggested that fetal liver cells of mesodermal origin were responsible for hematopoietic support: endothelial cells and perivascular cells47 and fibroblasts.48Recently, it has been shown that mice null for the jumonjigene, expressed by both endothelial cells and fibroblasts, showed defect in fetal liver hematopoiesis not due to HSC impairment.49 In earlier studies, we have suggested that vascular smooth muscle–like mesenchymal cells/myofibroblasts would be the fetal liver microenvironmental cell population.35,36Myofibroblasts derived from perisinusoidal stellate cells/Ito cells are commonly found in the liver.50,51 This population apparented to pericytes52 is particularly abundant in rat fetal liver where it is associated to hematopoietic foci.34
Our present study reveals a more complex phenotype because stromal cells express both epithelial and mesenchymal markers, corresponding to EMT cells. EMT appears, therefore, to be another characteristic of the developing hepatic epithelial cell, adding to the numerous distinctive features of this immature cell set. EMT occurs frequently during development, at different times and in distinct organs,31,32 including the liver.33 34
We confirmed the role of OSM on the hepatocytic maturation, as already underlined by the group of Miyajima.16,40,41 In particular, OSM induced a strong decline in AFP expression and the appearance of hepatocytic cords while increasing the expression of CK-8 and albumin. OSM may act in concert with glucocorticoids (contained in the culture medium), other cytokines such as transforming growth factor-β, epidermal growth factor, and hepatocyte growth factor, and adhesion molecules such as fibronectin.53-55
We also confirmed that hepatocytic maturation of fetal liver stroma parallels the decline in hematopoietic supporting ability. OSM decreased, by 4-fold, week 5 CAFCs generated in the presence of AFT024 cells while inducing a clear-cut shift from an EMT to a hepatocytic phenotype in cells from this line. The OSM-induced decrease in week 5 CAFCs was only 2-fold in the presence of 2018 cells where the phenotypic shift was less marked. Finally, week 5 CAFCs were not maintained in the presence of BFC012 cells displaying a more mature hepatocytic phenotype.
Results obtained in cultured cells were confirmed by in vivo observations because EMT cells were present during the hematopoietic phase of liver development (11.5 until 14.5 dpc included). Ultrastructure studies confirmed the close association between epithelial and hematopoietic cells. The existence of cells in rat fetal livers expressing both mesenchymal markers (desmin) and epithelial marker (CK-8) has been suggested but not demonstrated by Kiassov et al.34 In our work, we have not detected desmin-positive cells, perhaps because liver cells from mouse and human origin differ in their expression profile from the rat.
Previous data have demonstrated that OSM is expressed by CD45+ hematopoietic cells in the mouse liver starting from 12 dpc to the neonatal stage and that its receptor, OSM-R, is expressed by hepatic cells starting from 14.5 dpc to adult stage.56Taken together, our data and that of others would fit with a model explaining the transient hematopoiesis in the fetal liver: hematopoietic cells from yolk sac and AGM would migrate into the liver rudiment where they would find the suitable microenvironment of EMT cells. Following expansion and differentiation of hematopoietic cells, by 14 dpc in the mouse, levels of OSM would be enough to induce the hepatocytic maturation of EMT cells; consequently, the liver would lose its ability to support hematopoiesis.
EMT cells were already observed in 11.5-dpc murine liver, which suggests that endodermal (stem?) cells express mesenchymal markers early after specification of the hepatic lineages. Alternatively, liver mesenchymal stem cells57 may acquire endodermal features and then give rise to hepatocytes, following the controversial hypothesis of a mesodermal origin of the liver parenchyma.30 The generation of EMT cells is also compatible with other hypothetical founder cells, a mesendodermal cell (a precursor common to endodermal and mesodermal cells),11,58 or a circulating HSC seeding the liver rudiment.23,24 Another possibility is that fetal liver contains multipotent progenitor cells similar to those recently identified in adult bone marrow (multipotent adult progenitor cells [MAPCs]). These cells are able to generate mesoderm, endoderm, and neuroectoderm cells.59 An interesting hypothesis would be that such cells exist in fetal liver, where they could generate both mesenchymal and epithelial components of the fetal liver microenvironment. Moreover, these cells that may seed the bone marrow together with HSCs by the end of gestation would be resident embryonic stem cells persisting in the adult bone marrow.
We are grateful to Dr Kateri Moore (Department of Molecular Biology, Princeton University, NJ) for kindly providing the 3 fetal liver lines used in this study. We are indebted to Dr K. Moore and Dr B. Péault for their comments and critical revision of the manuscript. We would like to acknowledge F. Noel for his assistance and advice with Western blot experiments and D. Gilges for her assistance with RT-PCR experiments.
Prepublished online as Blood First Edition Paper, December 27, 2002; DOI 10.1182/blood-2002-05-1341.
Supported by research grants from the Association pour la Recherche sur le Cancer (ARC no. 5837) and the Association pour la Recherche sur les Myopathies/Institut National de la Santé et de la Recherche Médicale (AFM/INSERM no. 4CS02F). J.C. was supported by a grant from the Groupe d'Etude Hemostase et Thrombose and the Ligue Nationale contre le Cancer.
The publication costs of this article were defrayed in part by page charge payment. Therefore, and solely to indicate this fact, this article is hereby marked “advertisement” in accordance with 18 U.S.C. section 1734.
References
Author notes
Jalila Chagraoui, Bâtiment Lavoisier, Hôpital Paul Brousse, 12, Av P Vaillant-Couturier, 94807, Villejuif, France; e-mail: jali@netcourrier.com.

![Fig. 1. Immunofluorescence of stromal cells from hematopoietic fetal liver. / (A) A 14-gw human fetal liver; (B) 14.5-dpc murine fetal liver; (C) AFT024 cell line from 14-dpc liver; and (D) 2018 cell line from 14-dpc liver. Fetal liver cells were obtained and cultured for 10 days in long-term culture medium; cells were then fixed and double-immunostained with Cy3-conjugated mouse anti-ASMA (red) and mouse anti–CK-8 (green; fluorescent secondary antibody was fluorescein isothiocyanate [FITC]–conjugated goat antimouse immunoglobulin). Panels show an overlay of the fluorescence signal from the 2 channels (red and green) to visualize a coexpression of the epithelial and mesenchymal marker. Expression of ASMA in cell lines is so intense that the signal appears yellow instead of red. Scale bar = 10 μm.](https://ash.silverchair-cdn.com/ash/content_public/journal/blood/101/8/10.1182_blood-2002-05-1341/4/m_h80834152001.jpeg?Expires=1769129996&Signature=jcM12EDDLH0qa10oSYGrps2UJQOOQ0yqlTYh0V5uRrCaDssVhz1CjdnLCStNgVZCp5v2S5PXEjZnBCx7HzlMnKTesCbsOdTFKlJVZd4PbOU0mXs9eaQEplpaI8Roa~LjOLYudWBEJ-F0Hjh2tFiVB6TwkBuo3dTIMLp~mL0B19mmmeB4Ju8VhDL5xXh7qd4ao7RV5Nfjaft2fpOhQ3bAk2nHfhZBcUSVFXhXayWldMptwTq67oUFxh4cb66-YUTrRH9yQvxm61IjSgRciv9sPt5WAze01W4LuMwp-WUc-8VsjuAV13spDVPcW2YTWawSkIk-qHEPoeBoA-Nv6KTsLA__&Key-Pair-Id=APKAIE5G5CRDK6RD3PGA)



![Fig. 1. Immunofluorescence of stromal cells from hematopoietic fetal liver. / (A) A 14-gw human fetal liver; (B) 14.5-dpc murine fetal liver; (C) AFT024 cell line from 14-dpc liver; and (D) 2018 cell line from 14-dpc liver. Fetal liver cells were obtained and cultured for 10 days in long-term culture medium; cells were then fixed and double-immunostained with Cy3-conjugated mouse anti-ASMA (red) and mouse anti–CK-8 (green; fluorescent secondary antibody was fluorescein isothiocyanate [FITC]–conjugated goat antimouse immunoglobulin). Panels show an overlay of the fluorescence signal from the 2 channels (red and green) to visualize a coexpression of the epithelial and mesenchymal marker. Expression of ASMA in cell lines is so intense that the signal appears yellow instead of red. Scale bar = 10 μm.](https://ash.silverchair-cdn.com/ash/content_public/journal/blood/101/8/10.1182_blood-2002-05-1341/4/m_h80834152001.jpeg?Expires=1769130028&Signature=lUHQYddrAYLDyKxF2ihrkmdHCwUSj0CiP3chLfInptf8VjGRD7Hm1R~U0CESUYxZCzh9aOnBXNTwqStdbhHyZreDfQJjhHAi0-mTS4mifTuLozkWspmrzNjHeQh8bnfLzqNyrrkXn5mYmeSaFXUh~RbEIKWwQgNsr6AkxDtLmQzV62oBoWfM02YdA4vutwBtGTMQrpQHeIoqCByXdJ8L8iusohWSPP4bw0UEX6yacIs0XkFC5~cQZLTJqxyKgdISc4OSiYpbaaZSSs7SWoQbPso1l7gjR2BLvtEzqmZOPdC1sS5QS~n7rLal~uMUS~pOcy1j~E3ryhyVLn-7b9FCQg__&Key-Pair-Id=APKAIE5G5CRDK6RD3PGA)
