Abstract
Human natural killer (NK)–cell receptors are expressed by NK cells and some T cells, primarily TCR+CD8+ cytotoxic T lymphocytes (CTLs). Inhibitory NK cell receptors (iNKRs) can down-regulate antigen-mediated T-cell effector functions, including cytotoxic activity and cytokine release. In the present study we demonstrate that CD3+ T cells that bind tetramers of HLA-E and express its ligand, the NK-cell inhibitory receptor CD94/NKG2A, were significantly decreased in frequency in patients with human T-cell lymphotropic virus 1 (HTLV-1)–associated myelopathy/tropical spastic paraparesis (HAM/TSP) but not in asymptomatic HTLV-1 carriers. These cells were either αβ or γδ T cells. T-cell receptor (TCR) Vβ-specific reverse transcription–polymerase chain reaction and spectratyping analysis revealed that the TCR repertoire in directly isolated HLA-E tetramer–positive cells from peripheral blood mononuclear cells was skewed in both HTLV-1–infected and healthy individuals. However, oligoclonally or monoclonally expanded levels of TCR Vβwere more frequently detected within HTLV-1–infected individuals than healthy controls. Importantly, HLA-E tetramer–positive or NKG2A+ T cells from HTLV-1 patients do not express Tax and display different TCR usage from the immunodominant Tax11-19–specific CD8+ T cells, suggesting that they do not encounter HTLV-1–infected cells. The expression of NK cell–associated receptors by clonally expanded CD8+ T cells during chronic viral infection suggests that these receptors play a role in regulating CD8+ T cell–mediated antiviral immune responses and that a decrease of this cell subset results in an increased risk of inflammatory diseases such as HAM/TSP.
Introduction
Human T-cell lymphotropic virus type 1 (HTLV-1)1,2 infection is associated with adult T-cell leukemia (ATL)3,4 and with a slowly progressive neurologic disease called HTLV-1–associated myelopathy/tropical spastic paraparesis (HAM/TSP).5,6 Only a minority of individuals infected with HTLV-1 develop HAM/TSP, by mechanisms incompletely understood.7 In many viral infections, innate immune cells such as natural killer (NK) cells are induced at an early stage of infection and are thought to control virus spread until the adaptive immune response is fully activated.8 Thus, it is possible that insufficient innate immune surveillance as well as insufficient acquired immunity allows increased replication of HTLV-1 in patients with HAM/TSP. Indeed, it has been reported that NK-cell activity was significantly lower in HAM/TSP patients than in controls.9 Also, functional in vitro analysis revealed that NK cells from HAM/TSP patients have lower cytotoxic activity and lower antibody-dependent cell-mediated cytotoxicity (ADCC)10 than NK cells from controls.
The discovery of major histocompatibility complex (MHC) class I–specific NK-cell receptors (NKRs) has provided insight into the control of NK cell function.11 NK cells and T lymphocytes share various cell surface receptors, including NK receptors for MHC class I molecules. NKRs include killer cell immunoglobulin-like receptors (KIRs) that bind to classical MHC class I molecules and lectin-like dimers, which are composed of the invariant CD94 associated with an isoform of NKG2 molecules that bind to HLA-E.12 The functional activity of NK cells, that is, lysis of target cells and cytokine production, is determined by a balance between the signals transduced from inhibitory and activating receptors expressed at their surface. The lack of expression of one or more class I MHC alleles on target cells (as may occur in virus-infected or tumor cells) leads to NK-mediated target cell lysis. All known NK-cell inhibitory receptors (iNKRs) can be expressed by T cells, primarily by the CD8+ subset.13 Interestingly, the CD8+NKR+ T-cell populations display a surface phenotype typical of memory cells.13 Analysis of the T-cell receptor (TCR) Vβ gene usage revealed that 1 or 2 Vβ families predominated in the CD3+NKR+ cell populations isolated from a given individual, and sequencing of CDR3 from these expanded Vβ families demonstrated that the expansions were oligoclonal or monoclonal in healthy donors.13 On ligation with MHC class I expressed on target cells, these NKRs may inhibit the cytolytic function of the T cells.12,14 Thus, it is possible that in chronic viral infection such as HTLV-1 infection, the frequency or activity of such T-cell subsets differs between patients with HAM/TSP and asymptomatic HTLV-1 carriers. To examine this, we studied the populations of both CD3+ and CD94/NKG2A+ cells in HTLV-1–infected individuals and healthy controls. We found that the percentage of CD3+ cells that binds the HLA-E tetramer or expresses NKG2A or CD94 is significantly decreased in patients with HAM/TSP compared with asymptomatic HTLV-1 carriers and healthy controls.
Patients, materials, and methods
Patients and cells
Peripheral blood was studied from 25 patients with a clinical diagnosis of HAM/TSP, 23 asymptomatic carriers, and 27 healthy controls. Of these, 5 HAM/TSP patients and 3 asymptomatic carriers were Afro-Caribbean United Kingdom residents. All of the other HTLV-1–infected subjects were Japanese. Among 20 Japanese HAM/TSP patients, 4 patients were positive for HLA-A*0201; asymptomatic carriers and healthy controls were not HLA typed. Fresh peripheral blood mononuclear cells (PBMCs) were obtained by Histopaque-1077 (Sigma, Dorset, United Kingdom) density gradient centrifugation, and washed 3 times with phosphate-buffered saline (PBS). Cells were cultured in RPMI 1640 medium (Gibco, Paisley, United Kingdom) supplemented with 10% fetal calf serum (FCS; Sigma), 2 mM glutamine (Gibco), 100 IU/mL penicillin (Gibco), and 100 μg/mL streptomycin (Gibco).
Monoclonal antibodies and HLA-E tetramer
Mouse antihuman CD3 fluorescein isothiocyanate (FITC)–conjugated monoclonal antibody (mAb) (UCHT1), mouse antihuman CD4–phycoerythrin-guanine (PC5)–conjugated mAb 13B8.2, mouse anti–CD8–energy-coupled dye (ECD)–conjugated mAb (SFCI21Thy2D3), mouse anti–CD94-phycoerythrin (PE)–conjugated mAb (HP-3B1), mouse anti-NKG2A–PE-conjugated mAb (Z199), mouse anti-CD56–PC5-conjugated mAb (NKH-1), mouse anti-pan γδ T-cell mAb (Immu510; Beckman Coulter, Bedfordshire, United Kingdom), and mouse anti-CD45RA-cychrome–conjugated mAb (H5010; Pharmingen, Oxford, United Kingdom) were used to detect cell surface molecules of lymphocytes. Cell surface CCR7 was detected by using anti-CCR7 mAb 6B3 (MBL, Tokyo, Japan) and FITC-labeled goat F(ab′)2 antimouse IgG1 serum (Southern Biotechnology, Birmingham, AL). Intracellular Tax staining was done as described previously15 with anti-Tax mAb (Lt-4; IgG3) or isotype control mAb. The PE-conjugated HLA-A*02/Tax11-19 tetramer and HLA-E tetramer were prepared as described previously.16 HLA-E was refolded with the HLA-G signal sequence peptide VMAPRTLFL. NKG2A expression on HLA-A*02/Tax11-19 tetramer-positive cells was detected by mouse anti-NKG2A mAb (Z199) and FITC-labeled goat F(ab′)2 antimouse IgG (H+L; IM0819; Beckman Coulter).
Concomitant detection of Tax and cell surface molecules by flow cytometry
Isolated fresh PBMCs were incubated with PE-conjugated HLA-E tetramer for 20 minutes at 37°C. Then cells were fixed in PBS containing 2% paraformaldehyde (Sigma) for 20 minutes and resuspended in PBS at 4°C. Cell surface molecules were labeled with each mAb for 15 minutes at room temperature (RT). For the concomitant detection of Tax, fixed and cell surface stained cells were washed again and permeabilized with PBS containing 0.1% Triton X-100 (Sigma) for 10 minutes at RT. Permeabilized cells were washed and resuspended in PBS/7% normal goat serum (NGS) containing an anti-Tax mAb (Lt-4) or an isotype control mAb (IgG3) for 20 minutes at RT. The cells were washed twice and resuspended in PBS/7% NGS containing FITC-labeled goat F(ab′)2 antimouse IgG3 serum (Southern Biotechnology) for 20 minutes at RT. Finally, the cells were washed twice and analyzed by flow cytometry on an EPICS XL (Beckman Coulter).
Isolation of HLA-E tetramer–positive cells
HLA-E tetramer–positive T cells were positively selected by using anti-PE MACS beads and a magnetic separation column (Miltenyi Biotec, Surrey, United Kingdom). Anti-PE MACS beads were incubated with PBMCs for 15 minutes at 4°C following PE-conjugated HLA-E tetramer staining for 25 minutes at 37°C. After incubation with MACS beads, the cells were passed over a VarioMacs separation column according to the manufacturer's instructions (Miltenyi Biotec). The purity of tetramer-positive cells was more than 95% by flow cytometric analysis (data not shown).
RNA extraction and cDNA synthesis
RNA from 1 × 10⁵ enriched HLA-E tetramer–positive T cells or whole PBMCs was extracted using a high pure mRNA extraction kit (Boehringer Mannheim, Germany). First-strand cDNA was transcribed with oligo dT primer and AMV reverse transcriptase by using a first-strand cDNA synthesis kit (Boehringer Mannheim) in a total volume of 42 μL. All reaction procedures were performed as suggested by the manufacturer.
TCR RT-PCR analysis
Of 42μL cDNA solution, 1 μL was used as a template in 50-μL reverse transcription-polymerase chain reactions (RT-PCRs) containing 20 pmol of one of a panel of 26 TCR Vβ-specific primers and 20 pmol of a reverse primer specific for the TCR Vβ constant region (CB-R), of which 3 pmol had been end-labeled with 6-FAM (PE-Applied Biosystems, Warrington, United Kingdom). The sequences of the specific primers were the same as previously described.17 PCR was performed using a BIOTAQ-DNA polymerase (BIOLINE, London, United Kingdom) and PTC-100 thermal cycler (MJ Research, Watertown, MA). PCR conditions were as follows: denaturation at 94°C for 30 seconds, annealing at 60°C for 30 seconds, and elongation at 72°C for 60 seconds repeated for 35 cycles and followed by 10 minutes of extension at 72°C. In preliminary experiments, the number of cycles was varied between 25 and 50 to determine the appropriate number of cycles for a semiquantitative PCR (data not shown). The fluorescent intensity of each band was quantified using Genescan software (PE-Applied Biosystems).
TCR spectratyping
CDR3 size spectratyping was performed as described previously.18 Two microliters of the final PCR mixture was subjected to electrophoresis on a 5% polyacrylamide sequencing gel and the resulting bands were quantified by fluorescence detection on an automated sequencer (model 377A; PE-Applied Biosystems). The repertoire profile was analyzed with Genescan software (Affymetrix, Santa Clara, CA).
Cloning and sequencing of rearranged TCR-Vβ transcripts
TCR-Vβ PCR products were separated on 1% agarose gels and visualized with ethidium bromide. The purified PCR products were cloned with a Zero Blunt TOPO PCR cloning kit (Invitrogen, Amsterdam, The Netherlands). Sequencing was performed using ABI Prism DyeDeoxy Terminator cycle sequencing kit and a 377A DNA sequencer (PE-Applied Biosystems). The identities of TCR gene family sequences obtained here were established by comparison with published sequences.
Quantitative PCR of HTLV-1 provirus
To quantify the HTLV-1 proviral load in each infected individual, we carried out a quantitative PCR method using ABI Prism 7700 with 100 ng gDNA (roughly equivalent to 104 cells) from PBMC samples as reported previously.19
Statistical analysis
To test for significant differences among the cell populations between 3 different groups of subjects, one-factor analysis of variance (ANOVA) was done when the variance of each group was equal by the Bartlett test. If the variance of each group was different, the Kruskal-Wallis test was used (PKW). For multiple comparisons, we used Sheffé F to analyze statistical difference. The Mann-Whitney U test was used for comparing the percentages of monoclonal or oligoclonal TCRs in E tetramer-positive cells (and whole PBMCs) between HTLV-1–infected individuals and controls. The results represent the mean ± SD where applicable. P values less than .05 was considered statistically significant.
Results
The percentage of CD3+ T cells that bind the HLA-E tetramer or express CD94 and NKG2A was significantly decreased in patients with HAM/TSP
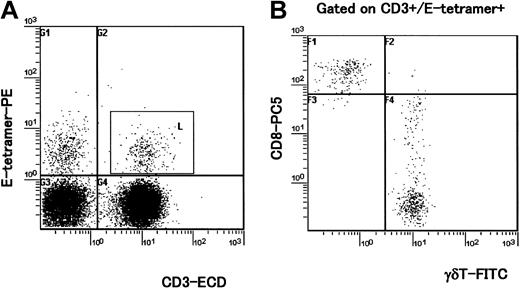
In humans, it has been described that CD94/NKG2 receptors are expressed on about 5% of peripheral blood CD8+ T cells and these cells represent oligoclonal expansion.13,20 CD94/NKG2 receptors are also expressed on a large proportion of γδ T cells and their expression is up-regulated following antigenic stimulation.21 To determine whether the frequency of CD94/NKG2+ T cells differed between HAM/TSP patients and asymptomatic HTLV-1 carriers as well as healthy controls, we stained PBMCs with HLA-E tetramer, antibodies to NKG2A and CD94 together with antibodies to CD3, CD8, and CD56. An anti-γδ T-cell mAb was also used in certain samples to determine the proportion of γδ T cells expressing CD94/NKG2 receptors and staining with HLA-E tetramer. As shown in Table 1, the percentages of CD3+ cells that were HLA-E tetramer positive, CD94+, and NKG2A+ were significantly lower in patients with HAM/TSP than in healthy controls; however, these differences were not observed between asymptomatic carriers and healthy controls. Interestingly, although a decrease in the frequency of CD3-CD56+ NK cells that were HLA-E tetramer positive was observed in HTLV-1–infected individuals (HAM/TSP and asymptomatic carriers), these differences were not statistically significant (Table 1). Three-color analysis indicated that CD3+ cells that were HLA-E tetramer positive (Figure 1A, square gate) were all CD4- (data not shown). The combination of anti-CD8 and a pan anti-γδ TCR antibodies revealed that HLA-E tetramer–positive T cells were either αβ CD8high T cells or γδ T cells that were CD8low or CD8- (Figure 1B). In HAM/TSP patients, the percentage of γδT+ cells that were CD3+E tetramer-positive cells (γδT+CD3+E tetramer-positive) within total PBMCs (mean ± SD = 0.30 ± 0.21, n = 4) was significantly lower than that of noninfected controls (mean ± SD = 1.25 ± 0.54, n = 5; P = .0143, Mann-Whitney U test), whereas the percentage of γδ+ T cells within total PBMCs (mean ± SD = 1.84 ± 1.06, n = 4) was not significantly lower than that of noninfected controls (mean ± SD = 2.59 ±0.92, n = 5; P = .462, Mann-Whitney U test). This indicates that in HAM/TSP patients, the γδT+CD3+E tetramer-positive cell population was specifically decreased, although the total γδT+ cell population was not significantly decreased within total PBMCs. There was no correlation between the percentage of CD3+ T cells that were HLA-E tetramer positive and HTLV-1 proviral load (Spearman rank correlation coefficient r = 0.002, P = .9995), or between the percentages of HLA-E tetramer–positive cells and HTLV-1 proviral load (r = -0.374, P = .1155).
Four-color analysis of HLA-E tetramer–positive T cells. PBMCs isolated from 4 HAM/TSP patients and 5 healthy (uninfected) controls were stained with HLA-E tetramer and with antibodies to CD3, CD8, and the γδ TCR. A representative experiment from one healthy control is shown. (A) PBMCs were stained with E tetramer and anti-CD3 mAb. HLA-E tetramer–positive CD3+ cells were gated (square gate). (B) Dot plot shows expression of CD8 and γδ TCR in CD3+ cells that were HLA-E tetramer–positive (inside square gate on panel A). Staining with a pan anti-γδ TCR mAb indicates that about 70% of HLA-E tetramer–positive/CD3+ cells were CD8high- γδ T cells and almost all CD8high+ cells were γδ- T cells in this individual.
Four-color analysis of HLA-E tetramer–positive T cells. PBMCs isolated from 4 HAM/TSP patients and 5 healthy (uninfected) controls were stained with HLA-E tetramer and with antibodies to CD3, CD8, and the γδ TCR. A representative experiment from one healthy control is shown. (A) PBMCs were stained with E tetramer and anti-CD3 mAb. HLA-E tetramer–positive CD3+ cells were gated (square gate). (B) Dot plot shows expression of CD8 and γδ TCR in CD3+ cells that were HLA-E tetramer–positive (inside square gate on panel A). Staining with a pan anti-γδ TCR mAb indicates that about 70% of HLA-E tetramer–positive/CD3+ cells were CD8high- γδ T cells and almost all CD8high+ cells were γδ- T cells in this individual.
HLA-E tetramer–positive cells displayed an effector/memory phenotype and were not infected with HTLV-1
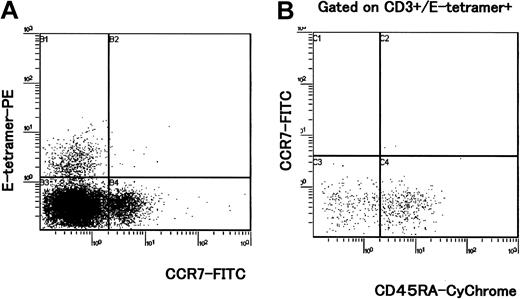
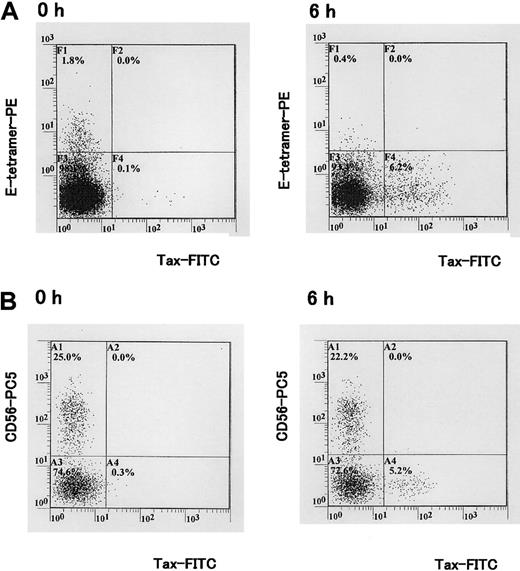
Three-color analysis with HLA-E tetramer, CD45RA, and CCR7 mAbs revealed that HLA-E tetramer–positive cells lacked CCR7 expression (Figure 2A) in all HAM patients and asymptomatic carriers tested. Within the HLA-E tetramer–positive CD3+ population, most cells were CCR7-CD45RA+ or CCR7-CD45RA-, indicating that these cells had the phenotype that has been associated with terminally differentiated effector (CCR7-CD45RA+) or effector memory cells (CCR7-CD45RA-; Figure 2B). In addition, intracellular Tax staining of PBMCs cultivated in vitro for 6 hours showed that HLA-E tetramer–positive cells were not infected with HTLV-1 (Figure 3A). The CD56+ subset (Figure 3B) and the majority of CD8+ T cells22 were also negative for Tax expression, whereas a proportion of HTLV-1–specific cytotoxic T lymphocytes (CTLs) was previously reported to be infected by HTLV-1 following contact with CD4+ infected cells.22 Lack of Tax expression in HLA-E tetramer–positive cells suggests that these cells do not encounter HTLV-1–infected cells.
CCR7 and CD45RA expression on HLA-E tetramer–positive cells. PBMCs directly isolated from 5 HAM/TSP patients, 5 asymptomatic HTLV-1 carriers, and 5 healthy controls were stained by HLA-E tetramer, CD3, CCR7, and CD45RA mAbs. A representative experiment from one HAM/TSP patient is shown. (A) Cell surface marker analysis of HLA-E tetramer–positive cells with CCR7-FITC mAb. (B) Dot plots show expression of CCR7 and CD45RA in CD3+ cells that were HLA-E tetramer positive.
CCR7 and CD45RA expression on HLA-E tetramer–positive cells. PBMCs directly isolated from 5 HAM/TSP patients, 5 asymptomatic HTLV-1 carriers, and 5 healthy controls were stained by HLA-E tetramer, CD3, CCR7, and CD45RA mAbs. A representative experiment from one HAM/TSP patient is shown. (A) Cell surface marker analysis of HLA-E tetramer–positive cells with CCR7-FITC mAb. (B) Dot plots show expression of CCR7 and CD45RA in CD3+ cells that were HLA-E tetramer positive.
Concomitant detection of HLA-E tetramer ligand, Tax, and CD56 antigens in PBMCs isolated from a HTLV-1–infected individual. (A) PBMCs isolated from a HAM/TSP patient were cultivated for 6 hours in vitro. Tax protein was detected with the Lt-4 mAb. Staining with HLA-E tetramer and Lt-4 is shown. (B) Staining with Lt-4 and CD56-PC5 mAb. One representative experiment of 3 is shown.
Concomitant detection of HLA-E tetramer ligand, Tax, and CD56 antigens in PBMCs isolated from a HTLV-1–infected individual. (A) PBMCs isolated from a HAM/TSP patient were cultivated for 6 hours in vitro. Tax protein was detected with the Lt-4 mAb. Staining with HLA-E tetramer and Lt-4 is shown. (B) Staining with Lt-4 and CD56-PC5 mAb. One representative experiment of 3 is shown.
Frequent oligoclonal expansion of HLA-E tetramer–positive CD8 T-cell subsets in HAM/TSP patients and asymptomatic carriers
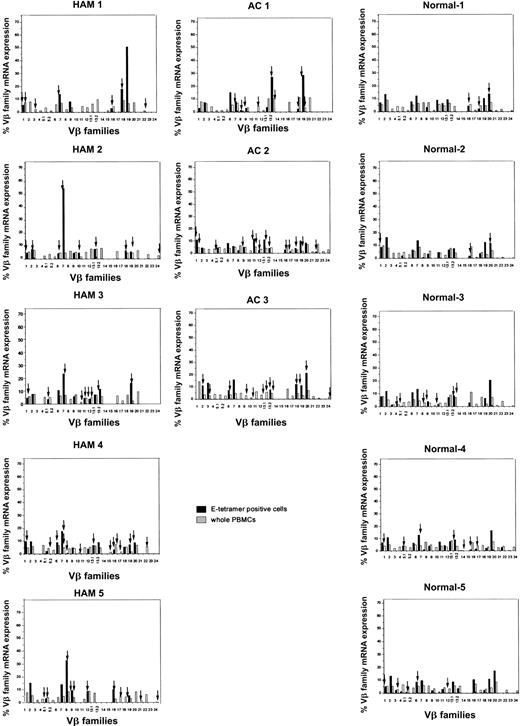
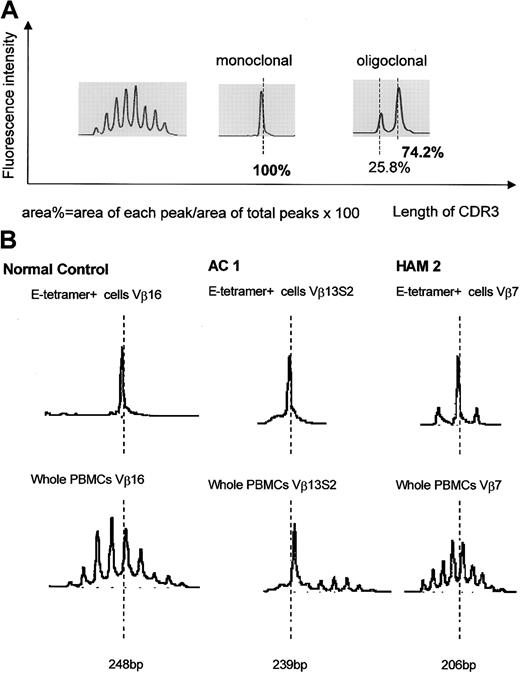
We have previously reported that clonal expansion of CD8+ T cells is frequent and widespread across Vβ families, in both asymptomatic HTLV-1 carriers and patients with HAM/TSP, although the frequency of oligoclonality is higher in HAM/TSP patients. Some of these expanded CD8+ T cells represent proliferation of certain Tax-specific clones.23 To elucidate whether clonal expansion was also observed within the HLA-E tetramer–positive cells, we first determined the TCR Vβ usage by RT-PCR. In both HTLV-1–infected individuals and healthy subjects, the Vβ usage in the E tetramer-positive T-cell subset was more diverse than among NKT cells,24 but less diverse than among the unseparated PBMCs (Figure 4). To quantify the Vβ diversity, we carried out CDR3 size spectratyping. In the spectratype generated from whole PBMCs, each Vβ family generally had 5 to 7 length variants with 1 or 2 dense bands in the middle of the spectratype, consistent with a gaussian distribution (Figure 5A, left panel). But in some HLA-E tetramer-positive T-cell samples, there were marked expansions of CDR3 segments of a certain length within the given Vβ family (Figure 5B). We defined such skewed spectratype bands as “oligoclonal” when a single peak contained more than 50% of the total area under the spectratype curve for that Vβ family (Figure 5A, center and right panels). Sequence analysis revealed that these expanded bands each consisted of a single dominant clonotype (Table 2). The TCR spectratyping analysis of the TCR RT-PCR products revealed that oligoclonally expanded Vβ sequences were more frequently observed in HTLV-1–infected individuals than noninfected controls (number of arrows in Figure 4), and this difference in frequency was statistically significant (Table 3). These data suggest that the oligoclonal T-cell expansion could be antigen driven.
Expression of TCR Vβ transcripts in HLA-E tetramer–positive cells and PBMCs from HTLV-1–infected individuals and seronegative controls, analyzed by RT-PCR. The relative amounts of Vβ transcripts in whole PBMCs (hatched bars) and HLA-E tetramer–positive cells (black bars) were quantified by fluorescence with Genescan software. Arrows indicate monoclonal or oligoclonal spectratype bands (see “Patients, materials, and methods” for definition of oligoclonality).
Expression of TCR Vβ transcripts in HLA-E tetramer–positive cells and PBMCs from HTLV-1–infected individuals and seronegative controls, analyzed by RT-PCR. The relative amounts of Vβ transcripts in whole PBMCs (hatched bars) and HLA-E tetramer–positive cells (black bars) were quantified by fluorescence with Genescan software. Arrows indicate monoclonal or oligoclonal spectratype bands (see “Patients, materials, and methods” for definition of oligoclonality).
CDR3 length profiles for TCR transcripts in CD8+ HLA-E tetramer–positive T cells from HTLV-1–infected individuals and seronegative controls. (A) Left portion shows typical gaussian profiles found in spectratypes derived from total PBMCs. Each Vβ spectratype generally had 5 to 7 peaks with 1 or 2 dense bands in their middle portion. Center and right portions show “monoclonal” and “oligoclonal” spectratypes observed in some HLA-E tetramer–positive cells. (B) Representative results of TCR spectratyping from HAM/TSP patients, asymptomatic carriers, and healthy controls.
CDR3 length profiles for TCR transcripts in CD8+ HLA-E tetramer–positive T cells from HTLV-1–infected individuals and seronegative controls. (A) Left portion shows typical gaussian profiles found in spectratypes derived from total PBMCs. Each Vβ spectratype generally had 5 to 7 peaks with 1 or 2 dense bands in their middle portion. Center and right portions show “monoclonal” and “oligoclonal” spectratypes observed in some HLA-E tetramer–positive cells. (B) Representative results of TCR spectratyping from HAM/TSP patients, asymptomatic carriers, and healthy controls.
Clonally expanded Vβ of HLA-E tetramer–positive T cells and immunodominant Tax11-19–specific CD8+ T cells from same patients showed different TCR clonotypes
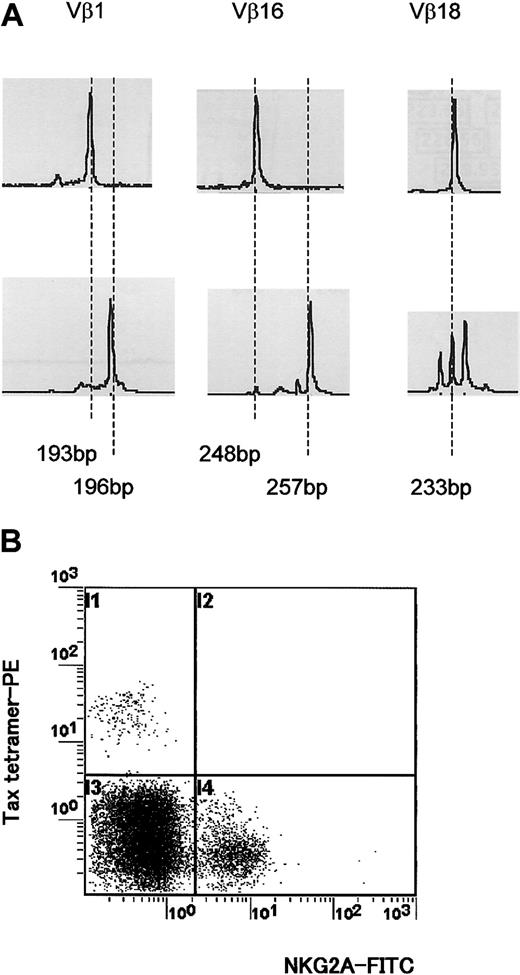
To determine whether these clonally expanded HLA-E tetramer-positive CD8+ T cells and Tax-specific CD8+ T cells had the same TCR clonotype, we subcloned and sequenced RT-PCR products derived from HLA-E tetramer–positive cells and HLA-A*02/Tax11-19 tetramer–positive cells from 2 HLA-A*02+ HTLV-1–infected individuals. In most TCRs examined, the highest peak length of given Vβ spectratypes clearly differed between HLA-E tetramer–positive and Tax11-19 tetramer–positive cells (Figure 6A). We sequenced all of the cloned RT-PCR products if the highest spectratype peaks of a given Vβ between HLA-E tetramer–derived cells and Tax11-19 tetramer–derived cells were the same length. Sequence analysis revealed that the major clonotypes seen in both subsets were clearly different (data not shown), indicating that the in vivo clonally expanded CD8+HLA-E tetramer–positive T cells in these HTLV-1–infected individuals did not contain HLA-A*02–restricted HTLV-1 Tax11-19 immunodominant peptide-specific cells. This observation was confirmed by 2-color flow cytometric analysis using HLA-A*02/Tax11-19 tetramer and anti-NKG2A mAb (Figure 6B). The HLA-A*02/Tax11-19 tetramer–positive CD8 T cells were uniformly negative on staining for the CD94/NKG2A iNKR.
Different TCR usage between HLA-E tetramer–positive T cells and immunodominant Tax11-19–specific CD8+ T cells from HTLV-1–infected individuals. (A) CDR3 length profiles for TCR transcripts in CD8+ HLA-E tetramer–positive (top row) and HLA-A*02/Tax11-19 tetramer–positive (bottom row) T cells were examined for 4 HLA-A*02+ HAM/TSP patients. A representative result from one HLA-A*02+ HAM/TSP patient is shown. (B) Two-color flow cytometric analysis using HLA-A*02/Tax11-19 tetramer and anti-NKG2A mAb from HLA-A*02+ HAM/TSP patients. Four HLA-A*02+ HAM/TSP patients were examined. A representative result from one HLA-A*02+ HAM/TSP patient is shown.
Different TCR usage between HLA-E tetramer–positive T cells and immunodominant Tax11-19–specific CD8+ T cells from HTLV-1–infected individuals. (A) CDR3 length profiles for TCR transcripts in CD8+ HLA-E tetramer–positive (top row) and HLA-A*02/Tax11-19 tetramer–positive (bottom row) T cells were examined for 4 HLA-A*02+ HAM/TSP patients. A representative result from one HLA-A*02+ HAM/TSP patient is shown. (B) Two-color flow cytometric analysis using HLA-A*02/Tax11-19 tetramer and anti-NKG2A mAb from HLA-A*02+ HAM/TSP patients. Four HLA-A*02+ HAM/TSP patients were examined. A representative result from one HLA-A*02+ HAM/TSP patient is shown.
Discussion
In HTLV-1 infection, a high frequency of circulating Tax-specific CTLs can be found in a majority of individuals infected with HTLV-1.25-27 Because it has been shown that Tax11-19–specific CD8+ T cells have the potential to produce proinflammatory cytokines,28 whereas possession of the HLA-A*02 allele was associated with protection against HAM/TSP as well as a lower proviral load,29 the CTL response directed against the Tax protein appears to play an important role in the course of HTLV-1 infection. Beside acquired immunity, innate immunity is also thought to be important in protecting the host against many viral infections. In HTLV-1 infection, previous reports revealed that the NK-cell activity was significantly decreased in HAM/TSP patients, by an unknown mechanism.9,10 In our study, we found that the percentage of CD3-CD56+ NK cells that are HLA-E tetramer positive tends to be lower in HAM/TSP patients, although the difference was not statistically significant (Table 1). NK cells express receptors that prevent them from attacking normal cells, while allowing them to attack infected or transformed cells in which class I molecules have been down-regulated. Like NK cells, some T cells express receptors specific for MHC class I molecules. The role of NK cell–associated receptors expressed by clonally expanded CD8+ T cells is not understood, but they may play an important role in regulating CD8+ T cell–mediated antiviral immune responses.20 In this study, we analyzed the expression of the cell surface C-type lectin receptor CD94/NKG2A using HLA-E tetramers and antibodies to CD94 and NKG2A. CD94/NKG2A delivers an inhibitory signal to NK cells following its interaction with HLA-E on the target cells.14,30 We measured the frequency of CD3-CD56+ or CD3+ cells that were HLA-E tetramer positive as well as NKG2A+ or CD94+ in HTLV-1–infected individuals and healthy controls. Interestingly, the percentages of CD3+ cells that were NKG2A+ or HLA-E tetramer positive or CD94+ were significantly decreased in HAM/TSP patients by comparison with asymptomatic HTLV-1 carriers or healthy individuals. This discrepancy was not found within the CD3-CD56+ NK-cell population. We conclude that there was a selective decrease of CD94/NKG2A expression on T cells in patients with HAM/TSP.
A further characterization of the HLA-E tetramer–positive CD3+ cells in HTLV-1–infected individuals revealed that they were all CCR7-. Sallusto et al reported that the expression of CD45RA and the chemokine receptor CCR7 can be used to distinguish 2 subsets of T cells that carry immunologic memory, termed “central memory T cells (CCR7+CD45RA-)” and “effector memory T cells (CCR7-CD45RA-).”31 CCR7+ “central memory” T cells express lymph node homing receptors and lack inflammatory and cytotoxic functions, but differentiate into CCR7- effector cells on secondary stimulation to mediate inflammatory reactions or cytotoxicity against invasive pathogens.31 The low percentage of HLA-E tetramer–positive CD3+ cells (which are mainly terminally differentiated effector and effector memory T cells) in HAM/TSP patients may reflect a rapid turnover from central memory T cells to effector memory T cells and activation-induced cell death by continuous HTLV-1 antigen stimulation. Several reported findings support the view that there is a rapid turnover of cells in HAM/TSP patients. It has been established that most HTLV-1–infected individuals mount a strong and persistently activated CTL response to HTLV-1,25-27 suggesting abundant chronic transcription of HTLV-1 genes.15 Recently, Nagai et al reported that phenotypically defined memory or effector cells (or both) were increased in CD8+ cells of HAM/TSP patients compared with those of healthy seronegative controls.32 Similarly, Yasunaga et al reported that the number of naïve T cells was low in HTLV-1–infected individuals compared with uninfected individuals, whereas the number of memory T lymphocytes was greater in HTLV-1–infected individuals.33 These findings support the rapid turnover hypothesis.
Analysis of the TCR Vβ gene usage and spectratyping revealed that the TCR Vβ usage of HLA-E tetramer–positive cells was skewed, but it was not restricted to one particular Vβ gene, as is the case in NKT cells. TCR spectratyping and sequencing analysis revealed that clonal expansions of HLA-E tetramer–positive CD3+ T cells (which are also CD4-CD8+) were significantly more frequently detected in HTLV-1–infected individuals than uninfected controls (Figure 5; Table 3), consistent with the observation23 that limited CTL specificities emerge during the chronic antigenic stimulation by HTLV-1. To determine whether these clonally expanded HLA-E tetramer–positive CD8+ T cells contained the dominant population of Tax11-19–specific CD8+ T cells,23 we subcloned and sequenced RT-PCR products derived from CD8+ HLA-E tetramer–positive cells and CD8+ Tax11-19/HLA-A*02 tetramer–positive cells from 2 HLA-A*02+ HTLV-1–infected individuals. Interestingly, the major clonotypes seen in both subsets were clearly different. These results indicate that in vivo clonally expanded HLA-E tetramer–positive T cells in these patients represented a different subset of cells from the HLA-A*02–restricted Tax11-19 peptide–specific CD8+ T cells. This is also consistent with the lack of CD94/NKG2A expression on CD8+ Tax11-19 tetramer–positive cells and the observation that HTLV-1 did not infect HLA-E tetramer–positive cells, whereas a proportion of CD8+ Tax11-19 tetramer–positive cells were infected22 by HTLV-1. Because there was no correlation between the percentage of CD3+ T cells that were HLA-E tetramer positive and HTLV-1 proviral load, or between the percentage of all HLA-E tetramer–positive cells and HTLV-1 proviral load, HLA-E tetramer–positive T cells themselves may not reduce the HTLV-1 proviral load directly. Taken together, these data suggest that CD8+ T cells that are HLA-E tetramer–positive or CD94/NKG2A+ represent either a distinct stage in T-cell activation, or more likely a distinct T-cell subset, possibly regulatory T cells that have undergone clonal expansion as a direct or indirect result of the HTLV-1 infection.
It is somewhat unexpected to observe this specific decrease of the proportion of HLA-E tetramer–positive T cells in HAM/TSP patients because CD94/NKG2A has been reported to be up-regulated on CTL following antigen stimulation in vitro and in vivo.20,21 Recently, it has been reported that CD94/NKG2A is up-regulated by polyomavirus-specific CD8 T cells, impairing their cytotoxic activity during viral clearance; in this way, CD94/NKG2A may contribute to virus-induced oncogenesis in vivo.34 Kambayashi et al also reported the emergence of Ly49+/CD8+ cells in the lung of influenza A virus-infected mice at day 10 after infection (10% of the total CD8+ T-cell population), suggesting that these T cells, which express both an innate and adaptive immune phenotype, play a regulatory role preventing the damaging effects of activated T cells.35 However, the observation reported here that the TCR clonotypes differed between HLA-E tetramer–positive T cells and Tax 11-19–specific CD8+ T cells suggests that up-regulation of CD94/NKG2A on antigen-specific CTLs following stimulation does not occur in HTLV-1 infection, or even if it occurs, these cells are immediately cleared by host mechanisms such as apoptosis.
Our data are also not consistent with reports suggesting that inhibitory receptors could play a role in maintenance of long-term memory.36,37 Although the cause of the observed selective decrease of the frequency of CD94/NKG2A+ T cells in HAM/TSP is not known, one possibility is that the decrease results from activation-induced cell death (AICD) caused by chronic antigenic stimulation. Alternatively, the release of cytokines in HAM/TSP patients may be unfavorable to CD94/NKG2A expression. However, levels of cytokines such as interleukin 2 (IL-2), IL-12, and IL-15, which have been shown to induce CD94/NKG2A expression in vitro, are significantly elevated in serum or PBMCs of patients with HAM/TSP.38-40 Furthermore, IL-15 inhibits AICD and stimulates the persistence of memory phenotype CD8+ T cells.41 Because the decrease in CD94/NKG2A+ T cells was mainly observed in γδ T cells but not in αβ T cells in HAM/TSP patients, it is possible that a high IL-15 level in HAM/TSP patients antagonizes the clearance of CD94/NKG2A T cells by AICD especially in the αβ T-cell subset.
Oligoclonal expansion of HLA-E tetramer–positive T cells may include a proportion of HLA-E–restricted T cells. Recognition of HLA-E by TCR αβ+ has recently been reported,42,43 but the proportion of these T cells and their functional properties are still unknown. It will be important to assess whether this T-cell subset could play a role in the development of HAM/TSP disease.
In conclusion, we demonstrate that CD8+ T cells that express the HLA-E ligand including an iNKR were significantly decreased in association with chronic viral disease (HAM/TSP) but not in asymptomatic HTLV-1 carriers. These cells were significantly more frequently expanded in individuals infected with HTLV-1 compared with healthy controls, and most of these cells were terminally differentiated effector (CCR7-CD45RA+) or effector memory cells (CCR7-CD45RA-). They may represent T-cell subsets with regulatory function and their low frequency in HAM/TSP patients may results from a rapid turnover and AICD. Further work is needed to characterize the origin of the decrease and its impact and involvement in the pathogenesis of HAM/TSP.
Prepublished online as Blood First Edition Paper, January 30, 2003; DOI 10.1182/blood-2002-09-2855.
Supported in part by the Japan Intractable Diseases Research Foundation (M.S.), Grant in Aid for Research on Brain Science of the Ministry of Health, Labor and Welfare of Japan, and the Wellcome Trust (United Kingdom).; DOI 10.1182/blood-2002-09-2855.
The publication costs of this article were defrayed in part by page charge payment. Therefore, and solely to indicate this fact, this article is hereby marked “advertisement” in accordance with 18 U.S.C. section 1734.
We thank David Allan, Chris Willberg, and Hatice Aldemir for the preparation of the HLA-E tetramer used in this study.

