Abstract
Genetic heterogeneity between individuals confounds the comparison of gene profiling of multiple myeloma (MM) cells versus normal plasma cells (PCs). To overcome this barrier, we compared the gene expression profile of CD138+ MM cells from a patient bone marrow (BM) sample with CD138+ PCs from a genetically identical twin BM sample using microarray profiling. Two hundred and ninety-six genes were up-regulated and 103 genes were down-regulated at least 2-fold in MM cells versus normal twin PCs. Highly expressed genes in MM cells included cell survival pathway genes such as mcl-1, dad-1, caspase 8, and FADD-like apoptosis regulator (FLIP); oncogenes/transcriptional factors such as Jun-D, Xbp-1, calmodulin, Calnexin, and FGFR-3; stress response and ubiquitin/proteasome pathway–related genes and various ribosomal genes reflecting increased metabolic and translational activity. Genes that were down-regulated in MM cells versus healthy twin PCs included RAD51, killer cell immunoglobulin-like receptor protein, and apoptotic protease activating factor. Microarray results were further confirmed by Western blot analyses, immunohistochemistry, fluorescent in situ hybridization (FISH), and functional assays of telomerase activity and bone marrow angiogenesis. This molecular profiling provides potential insights into mechanisms of malignant transformation in MM. For example, FGFR3, xbp-1, and both mcl-1 and dad-1 may mediate transformation, differentiation, and survival, respectively, and may have clinical implications. By identifying genes uniquely altered in MM cells compared with normal PCs in an identical genotypic background, the current study provides the framework to identify novel therapeutic targets.
Introduction
Multiple myeloma (MM) is presently an incurable malignancy that affects more than 14 000 new patients each year in the United States.1,2 Despite improvements in treatment, including high-dose therapy, the disease remains incurable; new therapeutic targets are therefore urgently needed. Cytogenetics, fluorescent in situ hybridization (FISH), and other molecular studies have identified alterations in cytokines, adhesion molecules, oncogenes, and tumor suppressor genes in MM.3-11 Moreover, gene microarray-based profiling now permits a comparison of global gene expression of MM cells versus normal plasma cells (PCs).12-15 Although such comparisons in a large number of patients may identify genes modulated in MM, the genetically heterogeneous background of patients with MM and controls confounds comparison since gene expression is determined not only by environmental factors but also by the genetic background.16-18 For example, studies in monozygotic and dizygotic twins have demonstrated that the expression of specific genes depends on heritable factors including polymorphisms in transcription factors or promoter elements.17,18
Gene expression profiling of patients with MM and monoclonal gammopathy of unknown significance (MGUS) has identified mRNA expression patterns associated with MM and with stage of disease.12-14 However, it is important to validate the observed expression changes at the protein level and, when feasible, at the level of cell function. In this study, we evaluated samples from a patient with MM and her identical twin sister, providing a unique opportunity to compare the expression profile of patient MM cells with normal PCs in a genetically identical setting. Moreover, we have further validated genes modulated in MM cells by immunoblotting for protein expression, FISH for cytogenetic correlations, and functional studies. Our studies both allow for comparison of MM cells with normal PCs and provide the basis for identification of novel therapeutic targets.
Materials and methods
Sample preparation
A 42-year-old patient was diagnosed with indolent MM in 1996 with mild anemia (hematocrit 0.31 [31%]), serum immunoglobulin G (IgG) level of 31 g/L (3.1 g/dL), low β-2 microglobulin at 2.32 mg/L, 11% bone marrow (BM) plasmacytosis, and no lytic bone lesions. Her serum IgG level in 2002 remains at 40 g/L (4.0 g/dL) with bone marrow plasmacytosis of 15%, and she has to date received only bisphosphonate therapy. Bone marrow aspirations were performed in the patient and her identical twin after obtaining IRB-approved (Dana-Farber Cancer Institute) informed consent. Mononuclear cells were separated by Ficoll-hypaque gradient centrifugation; at least 95% CD138+ patient MM cells or twin plasma cells were purified with CD138 immunomagenetic beads using the Auto MACS system (Miltenyi Biotech, Auburn, CA).12 CD138– fractions were also processed for further analysis. RNA was obtained by the RNAeasy method, as previously described.19
Generation of SMART cDNAs from CD138-enriched MM cells from BM
A cDNA amplification step was added following reverse transcription, since purification of plasma cells resulted in quantities of RNA insufficient to place directly on the gene chip. Using the switch mechanism at RNA template (SMART) approach (Clontech, Palo Alto, CA), we obtained sufficient quantities of cDNA amplified in a nonbiased fashion. Specifically, all commonly used cDNA synthesis methods rely on the ability of reverse transcriptase (RT) to transcribe mRNA into single-stranded DNA in the “first-strand” synthesis reaction; however, since RT cannot always transcribe the entire mRNA sequence, the 5′ ends of genes tend to be underrepresented in cDNA populations. We therefore used the modified-SMART method, which exploits a template-switching effect at the 5′ end and ensures the generation of full-length cDNA. The template-switching, primer-dependent second-strand cDNA synthesis occurs at high temperature, thereby overcoming potential secondary and tertiary structure problems in the template and the potential 3′ bias of common methods. Briefly, 1 μg total RNA was combined with an oligo dT-T7 RT primer and template switch oligonucleotide prior to first strand synthesis (20 nmol Dithiothreitol, 10 nmol dNTP with PowerScript reverse transcriptase; BD Biosciences, San Jose, CA) at 42°C for 1 hour. The resulting first strand SMART cDNA was then combined in a reaction containing 0.4 mM dNTPs, 1.5 mM MgCl2, 1x polymerase chain reaction (PCR) buffer, 0.1 μM T7 PCR primer, and 0.1 μM SMART PCR primer, according to the manufacturer's instructions. Following a hot start (TaKaRa LA Taq, 1 minute at 95°C), thermal cycling conditions for the appropriate number of cycles were 95°C for 5 seconds, 65°C for 5 seconds, and 68°C for 6 minutes (DNA Engine thermal cycler; MJ Research, Waltham, MA). As PCR inevitably favors short sequences over long ones, it was necessary to assess the optimum number of PCR cycles (15, 18, 21, 24, or 27) for each sample so that the reaction could be terminated prior to overcycling of the shorter sequences. The optimum cycle number was determined to be one cycle less than when the products became visible on a 1.2% agarose EtBr gel. Following thermal cycling, the PCR products were cleaned up using the QiaQuick PCR Purification Kit (Qiagen, Valencia, CA), per the manufacturer's instructions. Control experiments (quantitative RT-PCR and gene expression analysis) using cell lines to assess reproducibility of the modified SMART method demonstrated linear amplification.
Biotinylated probe preparation and hybridization on microarray
Double-stranded cDNA was prepared from 5 μg total RNA using the Life Technologies (Bethesda, MD) Superscript choice system and an oligo(dT)24-anchored T7 primer. Biotinylated RNA was synthesized using the BioArray RNA transcript labeling kit (Enzo, Farmingdale, NY) with biotin-11–cytidine-5′-triphosphate II (CTP) and biotin-16–UTP (uridine-5′-triphosphate) for 5 hours at 37°C. Either the entire cDNA reaction or 0.5 μg M-SMART cDNA was used for the reaction. In vitro transcription products were purified using RNeasy columns (Qiagen). Biotinylated RNA was then treated for 35 minutes at 94°C in a buffer composed of 200 mM Tris acetate, pH 8.1, 500 mM potassium acetate, and 150 mM magnesium acetate. Affymetrix HG-U95av2 arrays (Affymetrix, Santa Clara, CA) were hybridized with biotinylated in vitro transcription products (10 μg/chip) for 16 hours at 45°C. Fluidic station 400 (Affymetrix) was used for washing and staining the arrays. Due to the size-reduced hybridization features of the huGene arrays (24 × 24 μM), a 3-step protocol was used to enhance detection of the hybridized biotinylated RNA: incubation with a streptavidin-phycoerythrin conjugate, labeling with antistreptavidin goat biotinylated antibody (Ab) (Vector Laboratories, Burlingame, CA), and staining with the streptavidin-phycoerythrin conjugate. The DNA chips were then scanned using a gene chip scanner (Affymetrix). The excitation source was an argon ion laser, and emission was detected by a photomultiplier tube through a 570-nm long pass filter. Digitized image data were processed using the GeneChip software (version 4.0; Affymetrix).
Data analysis
Antibodies and Western blot analyses
Cell lysates were prepared as previously described.22 Briefly, equal amounts of proteins (250-300 μg) were resolved by 10% SDS-PAGE, transferred onto nitrocellulose membranes, blocked by incubation in 5% dry milk in PBST (0.05% Tween-20 in PBS), and probed with anti-hsp70, anti–mcl-1, and anti-CDC34 Abs. Blots were then developed by enhanced chemiluminesence (ECL; Amersham, Arlington Heights, IL).
Cytogenetics and fluorescent in situ hybridization (FISH)
Karyotyping and FISH analysis were performed using standard approaches.23 FISH for abnormalities of chromosomes 4, 13, and 14 was performed using commercially available probes and standard protocols (Oncor, Gaithersburg, MD).
Bone marrow CD34 immunostaining and angiogenesis
The extent of BM angiogenesis was assessed using standard immunohistochemical methods to identify BM microvessels.24 Briefly, CD34 immunostaining was performed using a labeled streptavidin-biotin peroxidase method24 on a Ventana ES automated immunohistochemistry stainer (Ventana Medical Systems, Tucson, AZ). Deparaffinized tissues were pretreated with EDTA (ethylenediaminetetraacetic acid; pH 8.0) in a steamer for 30 minutes, followed by a cool down for 5 minutes. Anti-CD34 monoclonal antibody (mAb) (Becton Dickinson, San Diego, CA; diluted 1:10) was then incubated with tissue sections for 32 minutes. The aminoethyl carbazole detection kit (Ventana Medical Systems) was used for antigen visualization; sections were counterstained with hematoxylin and then covered with Kaiseri glycerol jelly (Mayo Medical Laboratories, Rochester, MN). Paraffin sections of well-vascularized tonsil were run as a positive control, and a section stained with nonimmune rabbit immunoglobulin was used as a negative control.
Angiogenesis grading and microvessel density (MVD) estimation
All estimations were done in a blinded manner as in previous studies.24 For simple grading, slides were scanned at × 100, × 200, and × 400 magnification; based on the extent of microvessel staining, each slide was assigned an angiogenesis grade of low, intermediate, or high, as previously described. For MVD estimation each slide was first scanned at × 100 magnification to determine 3 “hot spots” defined as areas with the maximum number of microvessels. Microvessels were counted in each of the 3 hot spots at × 400 magnification; large vessels and vessels in the periosteum or bone were excluded. Areas of staining with no discrete breaks were counted as a single vessel, and the presence of a lumen was not required. MVD was estimated by determining the average number of vessels per × 400 high power field in each of the 3 hot spots examined.
Immunohistochemistry
Cytospin samples of purified MM cells from the patient and PCs from the healthy twin were prepared in medium containing 10% fetal calf serum (FCS) using Shandon Cytocentrifuge (Astmoor, United Kingdom). Cytospins were fixed at room temperature for 2 minutes in a mixture of acetone and methanol (1:1), air-dried, and stained. For double immunofluorescence, cytospins were incubated at room temperature for 1 hour with rabbit anti–h-FGFR3 and mouse anti–h-kappa–fluorescein isothiocyanate (FITC) Abs. FGFR3 was visualized with a donkey polyclonal antirabbit immunoglobulin Ab conjugated with Texas red (TR; Amersham). Slides were mounted using VectaShield mounting medium with DAPI (Vector).
Telomerase assay
The telomerase assay was performed using a TRAPeze Telomerase Detection Kit (Oncor). For a more sensitive and semiquantitative assay, 35 ng MM cell extract was used in the telomerase assay. PCR amplification was performed with 30 cycles at 94°C for 30 seconds, at 58°C for 30 seconds, and at 72°C for 60 seconds. The PCR products were analyzed by electrophoresis on 12% polyacrylamide nondenaturating gels and stained with SYBR Green I (Molecular Probes, Eugene, OR). Telomerase activity was assessed by determining the ratio of the entire telomerase ladder to that of the internal control, using NIH image analysis software.
Results
To define those genes differentially expressed in MM cells versus normal PCs in a genetically identical setting, we purified CD138+ MM cells from patient BM and its normal cellular counterpart from identical twin BM. We also compared the gene expression profile in the CD138– fraction, which predominantly contain stromal, hematopoietic, and lymphoid cell populations, as a control. Total cellular RNA was prepared and subjected to cDNA microarray analysis using probe sets corresponding to more than 12 600 human genes, followed by data analysis using the DNA chip analyzer. We have previously confirmed that PCR amplification provides a nonbiased amplification of the expressed genes.25 Control experiments (quantitative RT-PCR and gene expression analysis) performed using cell lines, with and without amplification, to assess reproducibility of the modified SMART method demonstrated both linear amplification and lack of bias. Following normalization of data in CEL files using the dChip software,20,21 the expression values were computed. The “compare samples” function was used to determine a specific profile of MM cells compared with normal twin PCs (CD138+).
Two hundred and ninety-six genes were up-regulated and 103 genes were down-regulated at least 2-fold in MM cells versus healthy twin PCs. These included genes with important roles in cell proliferation, malignant transformation, antiapoptosis, and differentiation, as well as metabolic and biochemical activity (Table 1). Genes significantly increased in MM cells versus healthy twin PCs included oncogenes/transcriptional factors (FGFR-3, Jun-D, v-fos, Xbp-1, calmoduliun, Calnexin); genes involved in cell survival pathways (mcl-1, dad-1, caspase 8, and FADD-like apoptosis regulator, katanin p80); stress response genes (hsp90 and hsp70); cell-cycle–related genes (CDC2-related kinase, CDK6, CDK7, Fzhr-1, p57/kip2); and ubiquitin/proteasome pathway–related genes (CDC34, UbC, UbB, ubiquitin specific protease, proteasome subunit alpha, ubiquitin-activating E1-like enzyme). Ribosomal genes, reflecting increased metabolic and translational activity, were also increased in MM cells versus healthy twin PCs. Genes significantly decreased in MM cells compared with healthy twin PCs included RAD51, killer cell immunoglobulin-like receptor protein, and apoptotic protease activating factor.
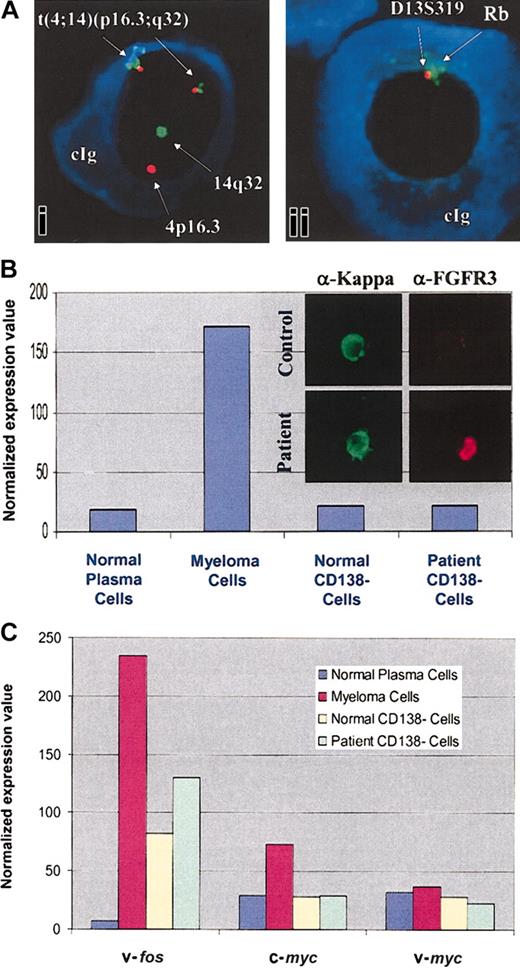
Microarray results have been further confirmed by Western blot analyses and immunohistochemistry for protein expression. We have focused on those highly expressed genes which are known to be involved in B-cell growth and survival. The increased expression of FGFR3 in patient MM cells was further evaluated by FISH analysis for cytogenetic correlations. As seen in Figure 1A, a t(4;14) translocation was detected in 96% of the kappa-restricted cells present in patient MM samples from 1997, 1999, and 2001. Interestingly, MM cells also showed deletion of 13q14, detected using Rb and D13S319 probes. Immunohistochemistry confirms high levels of FGFR3 protein expression in patient MM cells versus healthy twin PCs (Figure 1B). As seen in Figure 1C, v-fos and c-myc were also highly expressed in MM cells compared with healthy twin PCs; there was no significant difference in v-myc expression.
t(4;14) translocation and FGFR3 overexpression in patient MM cells. (Ai) Myeloma cells were evaluated for abnormalities of chromosome 4 and 14; (Aii) chromosome 13 abnormalities were evaluated with 2 probes (D13S319 and Rb) in the 13q14 region, using fluorescent in situ hybridization (original magnification, × 400). cIg indicates cytoplasmic immunoglobulin. (B) Normalized expression values from gene chip Hu95av2 for FGFR3 gene transcripts in CD138+ and CD138– cells from BM from the patient with MM and the healthy twin. MM cells and healthy twin PCs were immunostained with anti-FGFR3 and anti-kappa light chain Abs (inset; original magnification, × 100). (C) Normalized expression values from gene chip Hu95av2 for oncogenes v-fos,c-myc, and v-myc gene transcripts in CD138+ and CD138– cells from BM from the patient with MM and the healthy twin.
t(4;14) translocation and FGFR3 overexpression in patient MM cells. (Ai) Myeloma cells were evaluated for abnormalities of chromosome 4 and 14; (Aii) chromosome 13 abnormalities were evaluated with 2 probes (D13S319 and Rb) in the 13q14 region, using fluorescent in situ hybridization (original magnification, × 400). cIg indicates cytoplasmic immunoglobulin. (B) Normalized expression values from gene chip Hu95av2 for FGFR3 gene transcripts in CD138+ and CD138– cells from BM from the patient with MM and the healthy twin. MM cells and healthy twin PCs were immunostained with anti-FGFR3 and anti-kappa light chain Abs (inset; original magnification, × 100). (C) Normalized expression values from gene chip Hu95av2 for oncogenes v-fos,c-myc, and v-myc gene transcripts in CD138+ and CD138– cells from BM from the patient with MM and the healthy twin.
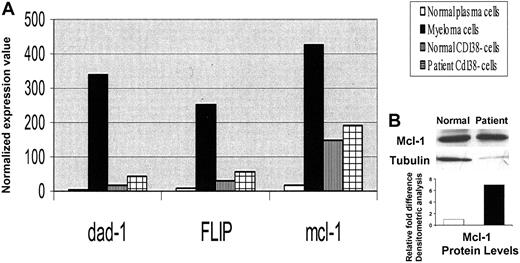
Although expression of bcl-2 and bcl-xl, as well as survivin and inhibitors of apoptosis proteins (IAPs), was not significantly different between patient MM cells and the healthy twin PCs (data not shown), there was a significant up-regulation of dad-1 (56-fold), FLIP (31-fold), and mcl-1 (25-fold) in MM cells compared with healthy twin PCs (Figure 2). Increased expression of mcl-1 protein (5.7-fold) in MM cells was confirmed using Western blot analysis.
Increased antiapoptotic gene expression in MM cells versus healthy twin PCs. (A) Normalized expression values from gene chip Hu95av2 for antiapoptotic genes dad-1, FLIP, and mcl-1 gene transcripts in CD138+ and CD138– cells from BM from the patient with MM and the healthy twin. (B) Cell lysates were prepared from MM cells and normal twin PCs, resolved by 10% SDS-PAGE, transferred onto nitrocellulose membrane, and probed with anti–mcl-1 and anti-tubulin Abs. Blots were developed by enhanced chemiluminesence, and relative protein expression in patient MM cells compared with normal twin PCs was calculated using densitometry.
Increased antiapoptotic gene expression in MM cells versus healthy twin PCs. (A) Normalized expression values from gene chip Hu95av2 for antiapoptotic genes dad-1, FLIP, and mcl-1 gene transcripts in CD138+ and CD138– cells from BM from the patient with MM and the healthy twin. (B) Cell lysates were prepared from MM cells and normal twin PCs, resolved by 10% SDS-PAGE, transferred onto nitrocellulose membrane, and probed with anti–mcl-1 and anti-tubulin Abs. Blots were developed by enhanced chemiluminesence, and relative protein expression in patient MM cells compared with normal twin PCs was calculated using densitometry.
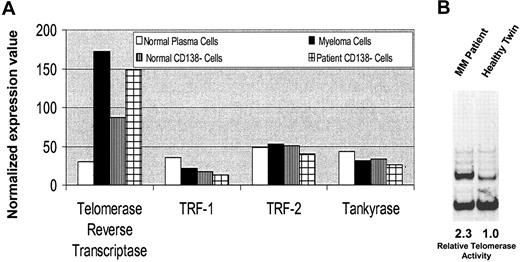
A high level of telomerase expression was observed in MM cells versus normal twin PCs, although no significant differences were observed in TRF-1, TRF-2, and Tankyrase transcript levels (Figure 3A). Interestingly, telomerase levels were also elevated in the patient versus twin CD138– BM fractions. Telomerase activity was measured by telomeric repeat amplification protein (TRAP) assay in lysates from MM cells and healthy twin PCs. As can be seen in Figure 3B, there was 2.3-fold higher telomerase activity in patient MM cells compared with healthy twin PCs.
Telomerase expression in MM cells versus healthy twin PCs. (A) Normalized expression values from gene chip Hu95av2 for telomerase and other telomere-related genes in CD138+ and CD138– cells from BM from the patient with MM and the healthy twin. (B) Telomerase activity was measured using the TRAPeze telomerase detection kit. Cell lysates from patient MM cells and normal twin PCs following PCR amplification were electrophoresed on 12% nondenaturing polyacrylamide gel and stained with SYBR green I. Telomerase activity is determined by the ratio of the entire telomerase ladder to that of the internal control using densitometric analysis.
Telomerase expression in MM cells versus healthy twin PCs. (A) Normalized expression values from gene chip Hu95av2 for telomerase and other telomere-related genes in CD138+ and CD138– cells from BM from the patient with MM and the healthy twin. (B) Telomerase activity was measured using the TRAPeze telomerase detection kit. Cell lysates from patient MM cells and normal twin PCs following PCR amplification were electrophoresed on 12% nondenaturing polyacrylamide gel and stained with SYBR green I. Telomerase activity is determined by the ratio of the entire telomerase ladder to that of the internal control using densitometric analysis.
Since we observed increased levels of expression of angiogenesis-related interleukin 8 (IL-8; 5-fold) and angiopoietin-1 (5.8-fold) transcripts in MM cells versus healthy twin PCs (Figure 4A), we next evaluated microvessel density (MVD) in MM patient BM. As seen in Figure 4B, BM angiogenesis was intermediate and increased to 7 microvessels per high power field.
Elevated angiogenesis-related gene expression and increased BM angiogenesis in MM. (A) Normalized expression values from gene chip Hu95av2 for angiogenesis-related IL-8 and angiopoetin-1 gene transcripts in CD138+ and CD138– cells from BM from the patient with MM and the healthy twin. (B) Deparaffinized MM patient BM biopsy specimens from 2002 were immunostained with anti-CD34 Abs using a labeled streptavidin-biotin peroxidase; microvessels per high power field (× 100) and the grade of angiogenesis were evaluated.
Elevated angiogenesis-related gene expression and increased BM angiogenesis in MM. (A) Normalized expression values from gene chip Hu95av2 for angiogenesis-related IL-8 and angiopoetin-1 gene transcripts in CD138+ and CD138– cells from BM from the patient with MM and the healthy twin. (B) Deparaffinized MM patient BM biopsy specimens from 2002 were immunostained with anti-CD34 Abs using a labeled streptavidin-biotin peroxidase; microvessels per high power field (× 100) and the grade of angiogenesis were evaluated.
Patient MM cells also showed increased expression of stress-related metabolic and biochemical pathway–related genes. As seen in Figure 5A, heat shock protein (hsp) 90 and hsp 70 were up-regulated (> 10-fold) in MM cells versus normal twin PCs; an 8-fold increased expression of hsp 70 in patient MM cells versus healthy twin PCs was confirmed using Western blotting. There was no difference in hsp 40 expression. Ubiquitin-proteasome–related genes were also highly expressed in patient MM cells versus healthy twin PCs (Figure 5B); 3.4-fold increased protein level of CDC34 in patient MM cells versus normal twin PCs was confirmed by Western blotting. Expression of more than 52 ribosomal proteins was also increased (> 20-fold) in patient MM cells versus normal twin PCs (data not shown), consistent with increased paraprotein synthesis. We also observed a 15-fold increase in xbp-1 transcripts in patient MM cells versus normal twin PCs; however, no significant difference in expression of Pax-5 and PRDII-BF1 was observed.
Elevated stress response and proteasome-related gene expression in MM cells versus healthy twin PCs. Normalized gene expression values in CD138+ and CD138– cells from BM from the patient with MM and the healthy twin were detected by gene chip Hu95av2 microarray profiling for heat shock proteins hsp 90, hsp 70, and hsp 40 transcripts (A); and proteasome-related genes CDC34, proteasome alpha and beta subunits (B). Cell lysates were prepared from MM cells and normal twin PCs, resolved by 10% SDS-PAGE, transferred onto nitrocellulose membranes, and then probed with (A) anti–hsp 70 and anti-actin Abs; or (B) anti-CDC34 and anti-actin Abs. Blots were developed by enhanced chemiluminescence, and relative protein expression in patient MM cells compared with normal twin PCs was calculated using densitometry.
Elevated stress response and proteasome-related gene expression in MM cells versus healthy twin PCs. Normalized gene expression values in CD138+ and CD138– cells from BM from the patient with MM and the healthy twin were detected by gene chip Hu95av2 microarray profiling for heat shock proteins hsp 90, hsp 70, and hsp 40 transcripts (A); and proteasome-related genes CDC34, proteasome alpha and beta subunits (B). Cell lysates were prepared from MM cells and normal twin PCs, resolved by 10% SDS-PAGE, transferred onto nitrocellulose membranes, and then probed with (A) anti–hsp 70 and anti-actin Abs; or (B) anti-CDC34 and anti-actin Abs. Blots were developed by enhanced chemiluminescence, and relative protein expression in patient MM cells compared with normal twin PCs was calculated using densitometry.
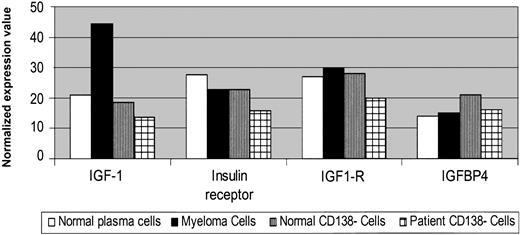
We have shown that cytokines mediate growth (IL-6, insulin-like growth factor 1 [IGF-1]), survival (IL-6, IGF-1), drug resistance (IL-6, IGF-1), and migration (vascular endothelial growth factor [VEGF]) of MM cells. Although IL-6 and VEGF were not altered in patient MM cells versus normal twin PCs (data not shown), IGF-1 gene expression was elevated (> 2-fold) in patient MM cells versus normal twin PCs (Figure 6A); however, IGF1R and IGFBP4 were expressed in a similar fashion. There was no significant difference in cytokine or cytokine receptor profile in CD138– fractions from the BM from the patient with MM versus BM from the healthy twin.
Elevated cytokine gene expression in MM cells versus healthy twin PCs. Normalized expression values from gene chip HG-U95av2 microarray profiling for IGF-1 and its receptor gene transcripts in CD138+ and CD138– cells from BM from the patient with MM and the healthy twin.
Elevated cytokine gene expression in MM cells versus healthy twin PCs. Normalized expression values from gene chip HG-U95av2 microarray profiling for IGF-1 and its receptor gene transcripts in CD138+ and CD138– cells from BM from the patient with MM and the healthy twin.
Discussion
One of the unique aspects of this study is a comparison of patient MM cells with normal cellular counterparts (PCs) from an identical genetic background. The observed differences in gene expression therefore represent the phenotype of the MM cell and its biologic behavior. The cellular environment, composed of both cytokines and cellular factors, can influence gene expression in patients with MM, and studies to date have compared patient MM cells with normal PCs from individuals with nonidentical genetic backgrounds.12-15 Therefore, many of the differences observed may be attributable to this genetic heterogeneity. For example, a study evaluating IL-10 expression in blood cells following lipopolysaccharide (LPS) stimulation in 246 monozygotic and dizygotic twins confirmed the significant role of genetic determinants in influencing gene expression.17 This differential gene expression is attributed to promoter polymorphism and differential modulation of transcriptional factors. Since it has been demonstrated that the human immunoglobulin V(H) gene repertoire is genetically controlled in monozygotic twins,18 the current study represents a unique opportunity to profile MM cells versus normal PCs.
A second important aspect of this study is confirmation of the observed gene expression changes at the protein and/or functional level. Although it is difficult to recapitulate all the sequential molecular changes that may have taken place to result in MM cell growth, we can hypothesize sequential genetic events. The initial oncogenic event may be oncogene activation providing an initial proliferative advantage.3 FGFR3 is an oncogenic receptor tyrosine kinase, which is activated due to Ig switch region translocation t(4;14)(p16.3;q32) in 15% of patients with MM.26-29 Signalling via FGFR3 and its activating mutations triggers mitogen-activated protein (MAP) kinase cascade, resulting in growth of MM cells.30 In our patient, detection of the t(4;14) translocation using immunohistochemistry confirmed aberrant FGFR3 gene expression. Interestingly, FISH analysis also showed an abnormality involving the 13q14 region (Δ13), consistent with the reported association of t(4;14) translocation and Δ13 in MM and MGUS.31 Although the majority of t(4;14) translocations are associated with Δ13, many patients with Δ13 lack t(4;14), suggesting that Δ13 may be an earlier event in the disease pathogenesis. Although both FGFR3 up-regulation and Δ13 have been independently associated with adverse outcome,32,33 the prognostic significance of these coexistent abnormalities is undefined, and our patient's disease course has remained indolent for more than 6 years despite these genetic abnormalities. Preliminary array comparative genomic hybridization (CGH) profiles between MM cells and normal twin PCs did not reveal many detectable chromosomal alterations (D. Carrasco, unpublished observation, November 2002). This observed lack of significant genetic rearrangements and progression of the disease is consistent with observed down-regulation of RAD51 expression in MM cells compared with normal twin PCs. Elevated RAD51 is associated with high recombination activity.
One important characteristic of MM cells is decreased apoptosis, both spontaneous and drug induced, and our data demonstrate up-regulation of 3 antiapoptotic genes in patient MM cells versus normal twin PCs. Myeloid cell factor 1 (mcl-1) is an antiapoptotic member of the Bcl-2 family, an important survival factor in MM cells which is regulated by IL-6.34,35 Blockade using antisense oligonucleotides has shown that mcl-1, but not bcl-2 or bcl-xl, is an essential antiapoptotic gene in MM.36 In our patient with MM, up-regulation of mcl-1 protein expression was also confirmed, consistent with its role in promoting growth and survival of MM cells.
We found an approximately 15-fold up-regulation of X-box binding protein 1 (XBP-1) in patient MM cells compared with normal twin PCs. XBP-1 is an IL-6 target gene implicated in IL-6–mediated growth of MM.37 It is also one of 3 major transcription factors (Pax-5, PRDII-BF1, and XBP-1) involved in the differentiation of normal B cells into plasmablastic cells.38 We observed increased XBP-1 gene expression in patient MM cells, but no change in expression of other B-cell–specific transcription factors, suggesting XBP-1 as an important potential target for therapy.
Elevated telomerase expression and activity was observed in patient MM cells versus healthy twin PCs.39 Telomerase extends telomeric DNA, thereby providing sustained replicative capacity to MM cells. Activation of telomerase is therefore observed in most patient MM cells, compared with PCs from individuals with MGUS and healthy donors.39 We have shown that IGF-1 and IL-6 induce telomerase activity via NFκB activation and Akt kinase phosphorylation in MM cells.40,41 The results in this patient with MM provide further rationale for the development of novel therapeutic strategies to inhibit telomerase.
An important observation in our patient with MM is elevated levels of ubiquitin proteasome pathway (UPP) genes. Proteasomes are multicatalytic complexes located both in the cytoplasm and in the nucleus which catalyze the degradation of intracellular proteins regulating cell growth, survival, and cell cycle.42 They also play a significant role in antigen presentation by major histocompatibility (MHC) class I molecules and elimination of abnormal proteins with mutation or posttranslational damage.43,44 High levels of UPP-related genes observed in our patient with MM and reported by others12,15,45 provide an additional basis for proteasome-directed therapy. In this regard, PS-341 is a boronic acid analog proteasome inhibitor which has already shown remarkable activity even in patients with refractory relapsed MM.46
An important class of proteins up-regulated in our patient with MM is the stress response hsp's. Hsp 90 and hsp 70 are molecular chaperones with significant roles in protein assembly, folding, structural integrity, and degradation.47 Hsp 90 is known to interact specifically with certain protein kinases and receptors mediating cell growth and survival including p53, Bcr-Abl, Raf-1, Akt, and ErbB2; in contrast, hsp 70 and hsp 40 are less specific and interact with a wide range of polypeptides.48 Up-regulation of hsp's is observed in various cancers including MM14,15 ; moreover, the levels of hsp's are further elevated in MM cells following proteasome inhibition.45 Therefore, inhibition of the chaperoning function of hsp 90 using geldanamycin, a specific inhibitor of its ATP binding site, induces apoptosis of both drug-sensitive and drug-resistant MM cells in vitro, and represents an additional novel therapeutic strategy in MM.49
We have compared, using the set of genes identified here, the expression profile of MM cells from the patient and normal PCs from the identical twin with prior gene expression studies in MM. Patient MM cells cluster with MM cells, whereas normal PCs cluster with normal PCs, confirming that this set of genes discriminates patients with MM versus healthy donors. The magnitude of the change was not consistently or significantly different from patients with active disease. The spectrum of change rather than their magnitude may therefore determine the progression of disease from indolent myeloma to symptomatic myeloma and plasma cell leukemia.
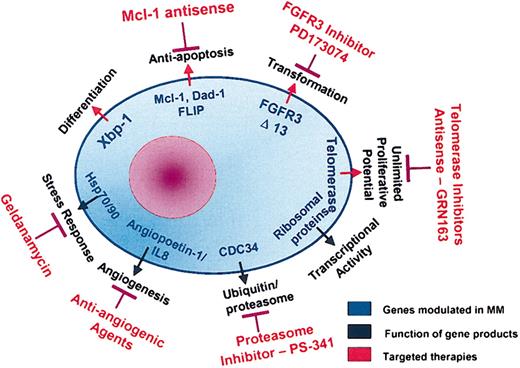
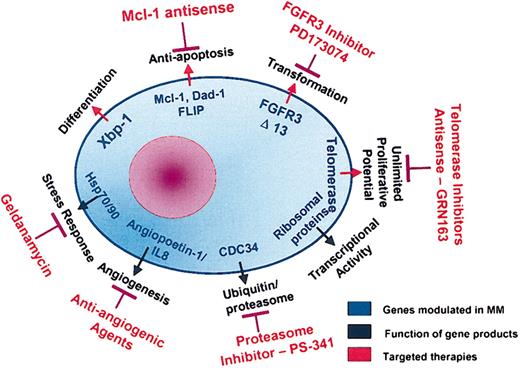
Although this patient with MM has had an indolent disease course to date, identification of this gene profile provides insight into various molecular pathways of disease pathogenesis and suggests novel therapeutic strategies (Figure 7). First, efficacy of proteasome inhibitors is suggested due to the high activity of UPP genes. Second, an important antiapoptotic mechanism operative in this patient's MM cells is up-regulation of FLIP, which inhibits caspase 8. Thalidomide and its novel analog Revimid act via the caspase 8 pathway,50 and may therefore be less effective; however mcl-1 may be targeted using an antisense approach. Third, increased hsp 90 levels in the patient's MM cells suggest potential utility of targeted therapy with hsp 90 inhibitor geldanamycin. Fourth, increased expression of IGF-1 in patient MM cells may be targeted by the monoclonal IGF-1R Ab currently under development for phase 1 testing.51,52 Finally, elevated FGFR3 in this patient's MM cells suggests potential utility of targeting FGFR3 kinase using inhibitor PD173074.53 Additional identified genes with a potential role in myeloma pathogenesis, which therefore represent potential targets of novel therapeutics, are shown in Table 2.
Molecular pathways in MM pathogenesis and potential therapeutic targets.
Gene expression profiling therefore offers the potential to further define disease pathogenesis and to identify potential molecular therapeutic targets in an individual patient with MM. This identification and characterization of important genetic events and their sequelae involved in MM cell growth and survival, coupled with our understanding of mechanisms of drug sensitivity and resistance, may predict whether individual patients will respond to a given therapy and identify future targets for novel therapeutic approaches.
Prepublished online as Blood First Edition Paper, September 11, 2003; DOI 10.1182/blood-2003-02-0402.
Supported by Multiple Myeloma Research Foundation Awards (T.H., N.M., D. Chauhan, N.C.M., K.C.A.); the VA Merit Review Grant, National Institutes of Health (NIH) grants P50-100707 and PO1-78378; the Leukemia and Lymphoma Society Scholar in Translational Research Award (N.C.M.); NIH grants RO1-50947, P50-100707, and PO1-78378; the Doris Duke Distinguished Clinical Research Scientist Award; and the Cure for Myeloma Fund (K.C.A.).
The publication costs of this article were defrayed in part by page charge payment. Therefore, and solely to indicate this fact, this article is hereby marked “advertisement” in accordance with 18 U.S.C. section 1734.

