Abstract
The AML1 transcription factor is essential for normal hematopoiesis and is the target of several chromosomal translocations in acute leukemia. Acquired somatic AML1 mutations were recently demonstrated sporadically in de novo myelodysplasia (MDS) and acute myeloid leukemia (AML) including a few cases of therapy-related disease (t-MDS/t-AML). We examined 140 patients with t-MDS or t-AML for AML1 mutations by direct sequencing. We identified 9 missense, 3 nonsense, and 10 frameshift mutations, all heterozygous, in 22 patients (15.7%). Thirteen mutations were located in the N-terminal Runt homology domain (RHD), whereas 9 mutations were located in the C-terminal region including the transactivation domain (TAD). Nineteen patients with AML1 mutations had previously received alkylating agents whereas 2 patients had received radiotherapy only. AML1 mutations were highly significantly associated with presentation of the disease as t-MDS (P = .003), with deletion or loss of chromosome arm 7q (P = .001) and with subsequent transformation to overt t-AML (P = .0001). Patients with missense mutations presented a shorter survival compared with patients with nonsense/frameshift mutations (P = .03). Our results suggest that AML1 mutations and deletion of genes on chromosome arm 7q cooperate in leukemogenesis and predispose to leukemic transformation.
Introduction
The AML1 (CBFA2, PEBPαB, or RUNX1) and CBFβ genes encode 2 proteins, which as heterodimers make up the core binding factor (CBF) complex, an important transcription factor in normal hematopoiesis.1,2 AML1 spans 260 kb, contains 12 exons, and has been mapped to chromosome band 21q22.1 The most abundant AML1 transcript, AML1b, encodes a protein of 453 amino acids (aa's) with an evolutionary, highly conserved N-terminal Runt homology domain (RHD) of 128 aa's, and a C-terminal transactivation domain (TAD) of 81 aa's. The RHD mediates DNA binding and heterodimerization with the non-DNA binding regulatory CBFβ subunit, whereas the TAD activates transcription of genes essential for normal hematopoietic proliferation and differentiation.1,2
Several findings point toward a causal role of impaired AML1 in many cases of acute leukemia.1-3 Cytogenetically, AML1 is disrupted and fused with other genes as a result of specific acquired chromosomal translocations,2 most frequently the t(12;21) translocation in pediatric, precursor B-cell acute lymphoblastic leukemia and the t(8;21) translocation in acute myeloid leukemia (AML) of French-American-British (FAB) subtype M2. Less common is the t(3;21) translocation in t-MDS and in acute transformation of chronic myeloid leukemia.
Acquired somatic AML1 mutations mainly within the RHD have been reported sporadically in de novo MDS and AML4-9 and heterozygous germ-line AML1 mutations were recently identified as closely associated with the rare, autosomal dominant familial platelet disorder (FPD).10-12 FPD is characterized by thrombocytopenia and a high propensity for developing MDS or AML (FPD/AML). The development of FPD/AML is frequently associated with the acquisition of recurrent unbalanced chromosome aberrations, primarily monosomy 5 or deletion of 5q (–5/5q–), monosomy 7 or deletion of 7q (–7/7q–), and trisomy 8, suggesting that second mutations are required for leukemic transformation.2,10
Treatment with alkylating agents and treatment with topoisomerase II inhibitors are known to induce t-MDS and t-AML with different clinical and cytogenetic characteristics.13-17 The molecular biology of the disease seems to follow specific genetic pathways associated with characteristic chromosome and genetic abnormalities.16,18-20 Acquired AML1 mutations were recently observed in 5 of 13 patients all previously treated with alkylating agents.7,8 Surprisingly, none of these 13 patients presented the cytogenetic abnormalities –5/5q– or –7/7q–, which other studies observed in 70% to 80% of such patients.13-17 Thus, it remains to be determined if acquired AML1 mutations are important genetic abnormalities in cytogenetically characteristic cases of t-MDS and t-AML.
To evaluate this possibility and to relate AML1 mutations to a specific type of previous treatment and to a specific genetic pathway of the disease, 140 unselected patients with t-MDS or t-AML were examined for AML1 mutations by direct DNA sequencing. The results were related to cytogenetic and clinical parameters of the patients. In addition, fluorescence in situ hybridization (FISH) analysis and analysis based on single nucleotide polymorphisms (SNPs) were applied in mutated cases to evaluate a possible loss of heterozygosity (LOH) of AML1.
Patients, materials, and methods
Patients
Bone marrow mononuclear cells, or in a few patients cells from peripheral blood containing a high percentage of myeloblasts, were obtained at diagnosis from 89 patients presenting with t-MDS and from 51 patients presenting with overt t-AML. Many of these patients have been included in our previous studies of p53 mutations,19 of internal tandem duplication of FLT3 (FLT3/ITD) and MLL,21 and of p15 methylation.20 Clinical and cytogenetic data are available for all 140 cases and the results have been published previously for 128 cases designated as nos. 10, 12-16, 19, 27, 29, 34-38, 40, 41, 43-47, 50-52, 54-59, 62-64, 66, 69, 70-73, 75, 77-84, 86-89, 91, 93-95, 97, 98, 100-109, 111-120, 122-124, 126-143, 145, 146, 148, 150-160, 162-167, 169-172, and 175-180.15,16,22
PCR and RT-PCR amplification
Total RNA and genomic DNA were extracted with the TRIzol reagent (Gibco Life Technologies, Grand Island, NY) from cryopreserved, unmodified, bone marrow cells of 81 patients. From an additional 59 patients genomic DNA was extracted with the DNAzol reagent (Gibco Life Technologies) from bone marrow cells prepared for cytogenetic examination and kept in methanol-acetic acid at –20° C. One microgram total RNA was reverse transcribed with the Superscript II reverse transcriptase kit (Gibco Life Technologies) using random hexamer primers. DNA (25 μg) or single-stranded cDNA solution (1 μL) was amplified by polymerase chain reaction (PCR) in a total volume of 20 μL including 1X Qiagen buffer (Qiagen, Hilden, Germany), 100 mM dinucleoside 5′-triphosphate (dNTP; Pharmacia Biotech, Uppsala, Sweden), 0.4 μM of each primer (DNA Technology, Aarhus, Denmark), and 0.5 units HotStarTaq polymerase (Qiagen). For amplification of the CG-rich exons 3 and 8, dimethyl sulfoxide (DMSO) 5%, was included. The intronic primers used for PCR/sequencing together with primers used for reverse transcriptase (RT)–PCR/sequencing are listed in Table 1. Amplification conditions consisted of an initial denaturation at 95° C for 15 minutes followed by 35 cycles of 94° C for 30 seconds, 56° C for 30 seconds, and 72° C for 60 seconds.
Mutation analysis
Mutation analysis of AML1 exons 3, 4, 5, 6, 7b, and 8 was performed by direct sequencing of the PCR products of all 140 patients. Mutated cases with RNA available were additionally analyzed by sequencing of RT-PCR products. PCR and RT-PCR products were purified with the JETquick PCR purification kit (Genomed, Bad Oeynhausen, Germany). Sequencing was performed with the forward primers (Table 1) using the BigDye Terminator Cycle Sequencing Kit (Applied Biosystems, Foster City, CA). Analysis was performed on an ABI Prism 3100 Genetic Analyzer (Applied Biosystems). To confirm mutations, a second independent PCR amplification and subsequent bidirectional sequencing was performed. In addition, the PCR products were cloned into pGEM-T vector (Promega, Mannheim, Germany), and multiple randomly picked clones from each sample were PCR amplified and sequenced.
Loss of heterozygosity (LOH) analysis
In patients with AML1 mutations, metaphase FISH using the TEL-AML1 probe (Vysis, Downers Grove, IL) and the CEP 21 probe (Vysis) was applied to investigate for deletion of the wild-type AML1 allele and for numeric aberrations of chromosome 21. In patients with AML1 mutations and abnormalities of chromosomes 5 or 7, interphase FISH using the EGR-1 probe (Vysis) or the D7S486 probe (Vysis) was used to determine the fraction of leukemic cells with deletion or loss of chromosome arms 5q or 7q, respectively. FISH was performed according to instructions from the manufacturer (Vysis) and for each patient a minimum of 25 metaphase cells or 200 interphase cells were examined if possible.
PCR/SSCP (PCR/single-stranded conformation polymorphism) and RT-PCR/SSCP analyses were applied to assess LOH of AML1 as previously described19 using the primers outlined in Table 1. The PCR/SSCP fragments were subsequently cloned, and approximately 16 independent, randomly picked clones were genotyped by restriction digestion or by sequencing in order to determine the ratio of mutated to wild-type AML1 alleles in each case.
To further assess LOH, the AML1 allelic ratio in the 22 mutated cases was determined by SNP analysis. SNPs within the AML1 locus were searched for in the US National Center for Biotechnology Information's SNP database (http://www.ncbi.nlm.nih.gov/SNP/). SNPs within 1000 bp of each exon were PCR amplified using flanking primers (Table 1) and genotyped by direct sequencing. Initially, 5 patients with AML1 mutations were screened for informative SNPs. Three heterozygous SNPs were identified: 2 in intron 4 and 1 in intron 6. As the 2 SNPs in intron 4 were completely correlated, only 1 of these was used for further genotyping. This SNP (SNP1) is characterized by an A/G nucleotide variation 231 bp downstream of exon 4 (SNP database identification number [dbSNP ID]: rs2 298 352). The SNP in intron 6 (SNP2) is characterized by a G/C variation 555 bp downstream of exon 6 (dbSNP ID: rs2 051 394). The A>G substitution of SNP1 disrupts the HpyCH4 IV restriction endonuclease site (New England Biolabs, Frankfurt, Germany), whereas the G>C substitution of SNP2 disrupts the NheI restriction, endonuclease site (New England Biolabs).
DNA from all 22 patients with AML1 mutations and DNA from heterozygous healthy controls were then amplified by PCR using fluorescein-labeled primers specific for SNP1 or SNP2 (Table 1). The PCR products were restriction digested, and heterozygous alleles were identified using the ABI Prism 3100 Genetic Analyzer. The area under the curves of the 2 alleles was calculated using Genescan software (Applied Biosystems). The allelic ratio (R) was calculated by dividing the area of allele 1 by the total area of the 2 alleles (R = allele1/(allele1+allele2)). To determine if the allelic ratio of patients was balanced or imbalanced, the allelic ratio of each patient was divided by the mean allelic ratio of 6 controls (ΔR = Rp/Rc). The healthy controls were predicted to present a balanced ratio of the 2 AML1 alleles (allele1-allele2 ratio of 1:1).
Results
Frequency and spectrum of AML1 mutations
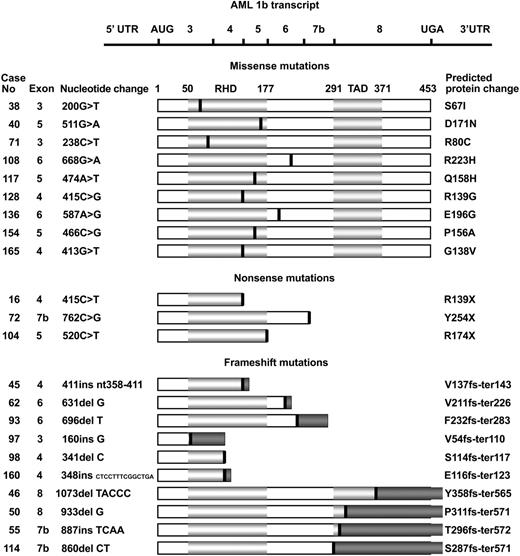
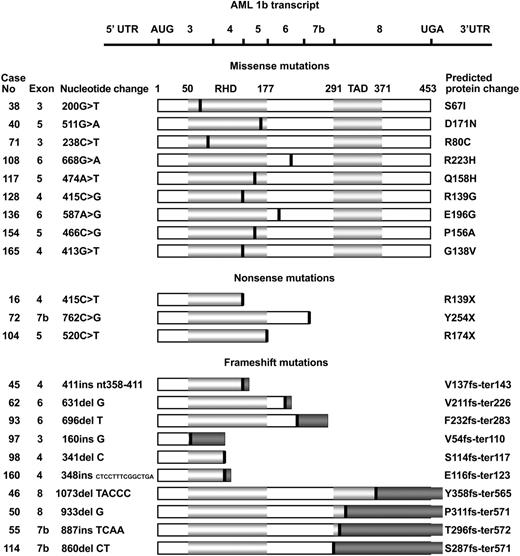
A total of 22 (15.7%) of the 140 unselected patients with t-MDS or t-AML each disclosed a single AML1 mutation (Figure 1). RNA was available from 13 of the 22 patients, and the mutations were confirmed in all 13 cases. Thirteen mutations were located within the N-terminal RHD (3 in exon 3, 6 in exon 4, and 4 in exon 5) whereas 9 mutations were located in the C-terminal region (4 in exon 6, 3 in exon 7b, and 2 in exon 8). The mutational spectrum consisted of 9 missense mutations, 3 nonsense mutations, and 10 frameshift mutations: 6 deletions and 4 insertions. The missense mutations were clustered within the RHD, as only 2 were located downstream of the RHD. The nonsense and frameshift mutations on the other hand were dispersed along the whole AML1b transcript. All 9 missense mutations resulted in single amino acid substitutions. The 3 nonsense mutations and 6 of the frameshift mutations all generated premature termination codons (PTCs) predicted to result in truncated AML1 proteins. The final 4 frameshift mutations (cases 46, 50, 55, and 114) located in exon 7b or exon 8 produced translation termination codons 335 bp or 351 bp downstream of the normal termination codon within the 3′ untranslated region (UTR).
Spectrum ofAML1mutations. The horizontal line at the top represents the AML1b transcript. Horizontal light gray bars below represent the AML1 protein indicating the runt homology (RHD) and transactivation domains (TADs). The amino acid numbers are shown above the bars. The black vertical lines indicate the relative positions of the 22 AML1 mutations grouped as 9 missense mutations, 3 nonsense mutations, and 10 frameshift mutations. Dark gray bars represent the incorrect amino acids after the frameshifts. Patient numbers, mutated exons, and nucleotide substitutions are shown to the left, whereas the predicted protein changes are shown to the right. The nucleotide numbers are relative to the start codon ATG defined as +1ofthe AML1b transcript (blast accession no.: L34598). Ins denotes insertion; del, deletion; fs, frameshift; and ter, termination.
Spectrum ofAML1mutations. The horizontal line at the top represents the AML1b transcript. Horizontal light gray bars below represent the AML1 protein indicating the runt homology (RHD) and transactivation domains (TADs). The amino acid numbers are shown above the bars. The black vertical lines indicate the relative positions of the 22 AML1 mutations grouped as 9 missense mutations, 3 nonsense mutations, and 10 frameshift mutations. Dark gray bars represent the incorrect amino acids after the frameshifts. Patient numbers, mutated exons, and nucleotide substitutions are shown to the left, whereas the predicted protein changes are shown to the right. The nucleotide numbers are relative to the start codon ATG defined as +1ofthe AML1b transcript (blast accession no.: L34598). Ins denotes insertion; del, deletion; fs, frameshift; and ter, termination.
Loss of heterozygosity of AML1
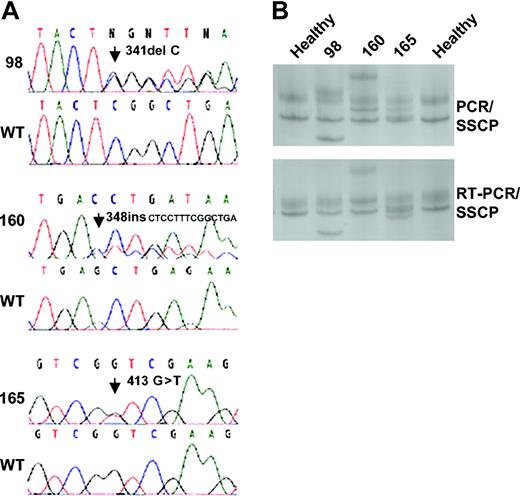
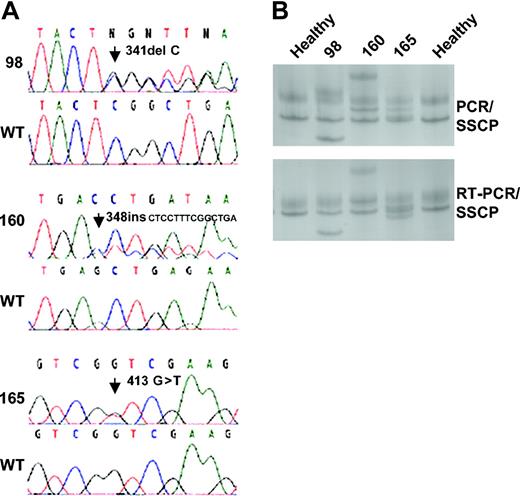
Two FISH signals for AML1 were observed in 18 of the 22 patients with AML1 mutations, whereas the remaining 4 cases (nos. 50, 62, 72, and 97) showed 3 signals, in line with conventional cytogenetics and FISH showing trisomy 21 or an additional arm 21q (+21/+21q) in these 4 cases (Tables 2 and 3). At the genetic level, the DNA sequencing analysis in all cases showed a mixture of wild-type and mutated AML1 alleles of approximately equal intensity (Figure 2A). This mixture was confirmed by PCR/SSCP as well as by RT-PCR/SSCP (Figure 2B). Interphase FISH demonstrated that among the 16 patients with 2 signals for AML1 and deletion of 7q or 5q, the fraction of leukemic cells with clonal markers –7/7q– or –5/5q– was above 90% in 3 patients (cases 38, 128, and 165), above 80% in 3 patients (cases 71, 72, and 93), and above 70% in 5 patients (cases 50, 62, 104, 117, and 154) (median, 81.5% for all 11 patients; Table 2). As the fraction of mutant AML1 alleles was in median only 41.5% (Table 2), the high percentage of wild-type AML1 alleles observed at least in these 11 cases could not solely derive from the smaller fractions of cytogenetically normal, nonleukemic cells.
Direct DNA sequencing and SSCP analysis ofAML1. (A) The sequences depict mutations identified in exon 4 of AML1 and the corresponding wild-type (WT) sequences. The first sequence shows a deletion of 1 nucleotide identified in patient 98, the second sequence shows a insertion of 14 nucleotides identified in patient 160, and the final sequence shows a single base substitution in patient 165. (B) Representative PCR/SSCP bands (top) and RT-PCR/SSCP bands (bottom) of exon 4. Lanes 1 and 5 are healthy controls and lanes 2 to 4 are patient nos. 98, 160, and 165.
Direct DNA sequencing and SSCP analysis ofAML1. (A) The sequences depict mutations identified in exon 4 of AML1 and the corresponding wild-type (WT) sequences. The first sequence shows a deletion of 1 nucleotide identified in patient 98, the second sequence shows a insertion of 14 nucleotides identified in patient 160, and the final sequence shows a single base substitution in patient 165. (B) Representative PCR/SSCP bands (top) and RT-PCR/SSCP bands (bottom) of exon 4. Lanes 1 and 5 are healthy controls and lanes 2 to 4 are patient nos. 98, 160, and 165.
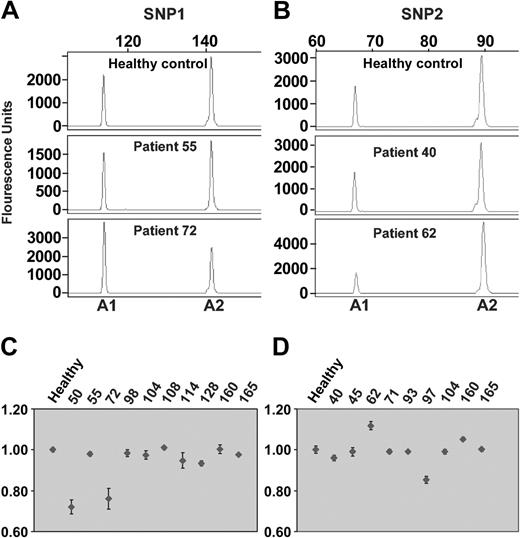
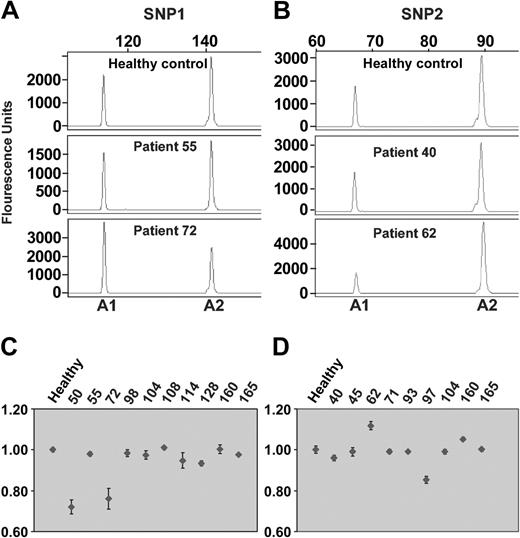
Heterozygosity of SNP1 was observed in patients 50, 55, 72, 98, 104, 108, 114, 128, 160, and 165, and heterozygosity of SNP2 was observed in patients 40, 45, 62, 71, 93, 97, 104, 160, and 165. Twelve of the 16 heterozygous patients disclosed a balanced allelic ratio not significantly different from the 1:1 allelic ratio of the healthy controls (Figure 3). The remaining 4 patients (cases 50, 62, 72, and 97) showed allelic imbalance consistent with their presentation of +21/+21q (Figure 3). To further verify heterozygosity of AML1, PCR fragments encompassing AML1 mutations in exon 4 and heterozygous SNP1 of patients 98, 128, 160, and 165, and PCR fragments encompassing AML1 mutations in exon 6 and heterozygous SNP2 of patients 62 and 93 were cloned and several independent clones were sequenced. In all 6 cases the AML1 mutation was completely correlated to only one of the AML1 alleles (data not shown). Interestingly, in case 62 with +21q only 25% of the cloned PCR fragments showed AML1 mutations (Table 2), suggesting that only one of the 3 AML1 alleles was mutated. In case 50, also with +21q, on the other hand, 73% of the cloned PCR fragments showed AML1 mutations (Table 2), suggesting that 2 of the 3 alleles presented the same AML1 mutation. Taken together, our results strongly indicate that patients with t-MDS or t-AML mainly disclose heterozygous AML1 mutations.
The allelic ratio ofAML1assessed by SNP analysis. (A-B) The representative electropherograms show the sizes and levels of allele 1 (A1) and allele 2 (A2) after restriction digestion of SNP1 in panel A and of SNP2 in panel B. Top row shows healthy controls; middle row, patients with allelic balance; and bottom row, patients with allelic ratios significantly different from the controls, suggesting allelic imbalance. (C-D) The allelic ratio is depicted as dots of the 10 patients heterozygous for SNP1 (C), and of the 9 patients heterozygous for SNP2 (D). The mean values from 3 separate experiments are given with standard deviations (thin vertical lines). Two patients showed allelic imbalance of SNP1 (cases 50 and 72), and 2 patients disclosed allelic imbalance of SNP2 (cases 62 and 97).
The allelic ratio ofAML1assessed by SNP analysis. (A-B) The representative electropherograms show the sizes and levels of allele 1 (A1) and allele 2 (A2) after restriction digestion of SNP1 in panel A and of SNP2 in panel B. Top row shows healthy controls; middle row, patients with allelic balance; and bottom row, patients with allelic ratios significantly different from the controls, suggesting allelic imbalance. (C-D) The allelic ratio is depicted as dots of the 10 patients heterozygous for SNP1 (C), and of the 9 patients heterozygous for SNP2 (D). The mean values from 3 separate experiments are given with standard deviations (thin vertical lines). Two patients showed allelic imbalance of SNP1 (cases 50 and 72), and 2 patients disclosed allelic imbalance of SNP2 (cases 62 and 97).
AML1 mutations related to clinical and cytogenetic characteristics
AML1 mutations were significantly more frequent in patients presenting with t-MDS compared with patients presenting with overt t-AML (20 of 89 versus 2 of 51; P = .003; Table 4). Even more significant, 17 (77%) of 22 patients with AML1 mutations disclosed the chromosome abnormalities –7/7q– compared with only 46 (40%) of 118 patients with wild-type AML1 (P = .001; Table 4). Conversely, none of 22 patients with recurrent balanced translocations to chromosomal bands 21q22, or 11q23, the t(15;17) or the inv(16), showed AML1 mutations (P = .025; Table 4). No significant association was observed between AML1 mutation and +21/+21q or other frequently observed unbalanced chromosome aberrations such as –5/5q–, +8, 11q–, –17/17p–, or a complex karyotype (Table 4; data not shown).
AML1 mutations related to leukemic transformation
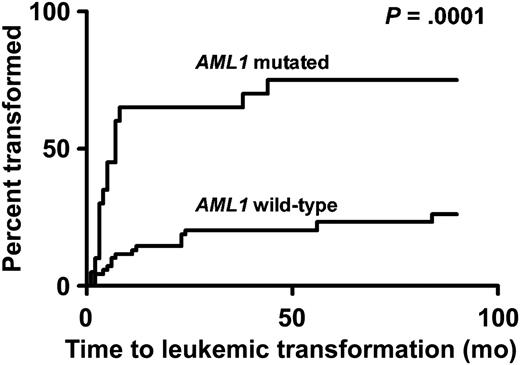
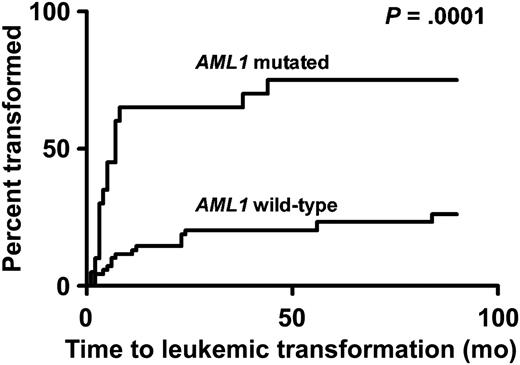
In the subgroup of 82 patients presenting with t-MDS and with FAB subtypes determined, significantly more patients with AML1 mutations presented with the advanced stages of t-MDS, refractory anemia with excess of blasts (RAEB) or RAEB in transformation (RAEB-t), compared with patients with wild-type AML1 (9 of 15 versus 15 of 66; P = .01; Table 4). Even more marked, 15 (75%) of 20 patients with AML1 mutations disclosed leukemic transformation compared with only 18 (26%) of 69 patients without mutations (P = .0001; Table 4, Figure 4). Three of the 5 patients with AML1 mutations who did not transform had been at observation for only 1, 2, and 4 months, respectively, before death (Table 3). Also, the median time to transformation tended to be shorter for patients with AML1 mutation (4.5 months) compared with patients with wild-type AML1 (11 months; P = .08; Table 5; Figure 4). After transformation to overt t-AML, the FAB subtypes were unrelated to AML1 mutation status. Only 1 patient transformed to t-AML of FAB subtype M0, and transformation to AML of FAB subtypes M3 and M5 was not observed (Tables 3 and 5).
Leukemic transformation. Leukemic transformation from t-MDS to overt t-AML according to mutational status of AML1.
Leukemic transformation. Leukemic transformation from t-MDS to overt t-AML according to mutational status of AML1.
AML1 mutations related to survival
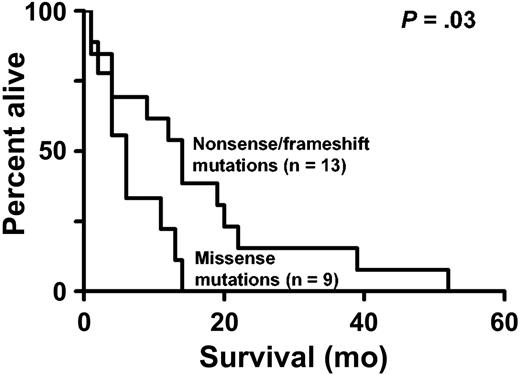
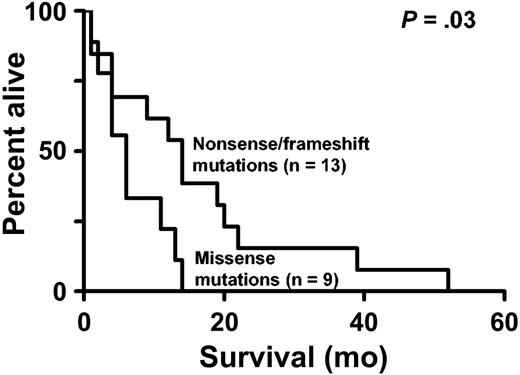
The median survival of the entire group of 140 patients with t-MDS and t-AML was 8.5 months: 11 months for patients presenting with t-MDS compared with only 5 months for patients presenting with overt t-AML. A nonsignificant shorter survival was observed for the 20 patients presenting with t-MDS and AML1 mutations (median, 10 months) compared with the 69 patients with t-MDS and wild-type AML1 (median, 12 months; P = .08; log-rank test, 2-sided). If only the subgroup of 22 patients with AML1 mutations is considered, the 9 patients with missense mutations disclosed a significantly shorter overall survival (median, 6 months) compared with the 13 patients with nonsense or frameshift mutations (median 14 months; P = .03; log-rank test, 2-sided; Figure 5).
Kaplan-Meier estimate of overall survival. Overall survival of patients with missense mutations compared with patients with nonsense or frameshift mutations.
Kaplan-Meier estimate of overall survival. Overall survival of patients with missense mutations compared with patients with nonsense or frameshift mutations.
Discussion
Somatically acquired AML1 mutations were identified in 22.5% of patients with t-MDS, which is within the same range as previously observed in advanced stages of de novo MDS8 (17%), but lower than the 38% reported in t-MDS/t-AML.7 However, these patients with therapy-related disease were apparently selected, as the cytogenetic abnormalities –7/7q– or –5/5q–, the hallmarks of t-MDS and t-AML, were not observed in any case although all patients had previously received alkylating agents.7,8
In addition, our results confirm that AML1 mutations are common also in the C-terminal region and that the missense mutations cluster within the RHD, whereas the frameshift and nonsense mutations are dispersed along the N-terminal as well as the C-terminal region.8 Our results, however, do not support the supposed clustering of mutations in the N-terminal region of AML1 in t-MDS/t-AML, because our patients showed the same distribution of AML1 mutations as previously observed in de novo MDS.8
Previous studies have disclosed a predominance of homozygous AML1 mutations in AML of FAB subtype M0, whereas heterozygous mutations have been observed in AML of other FAB subtypes.4,5,9 In the present study all 22 patients with AML1 mutations presented only one specific mutation, and deletion of one allele was not observed by FISH. The direct sequencing and SSCP analysis showed virtually equal intensities of the mutated and wild-type alleles, suggesting that AML1 mutations in our patients are mainly heterozygous. However, a mixture of leukemic cells with homozygous AML1 mutations and of normal cells with wild-type AML1 must still be considered. Nonetheless, in the 11 cases with more than 70% cytogenetically abnormal cells in the bone marrow, the percentage of mutated alleles was much lower in median below 42% (Table 2). In addition, the SNP analysis of the 16 patients presenting heterozygous SNPs showed allelic imbalance in only 4 patients, in all as a result of +21/+21q. Taken together, these observations indicate that AML1 mutations are heterozygous in t-MDS and t-AML.
The risk of transformation from MDS to AML has been shown to be related to cytogenetic abnormalities, to the percentage of bone marrow myeloblasts, and to the degree of cytopenia.23 However, few specific genetic abnormalities have been directly implicated in leukemic transformation. In the present study we demonstrate for the first time that AML1 mutations are significantly associated with t-MDS and with transformation to overt t-AML (Table 4; Figure 4). Mutation of RAS, p53, FLT3, and methylation of p15 have been observed mainly during or after transformation to overt AML,20,24-28 whereas AML1 mutations were, in our study, observed in the preleukemic phase before transformation. Thus, AML1 mutations either predispose to or induce leukemic transformation, consistent with the pivotal role of AML1 in hematopoiesis.1-3
Few studies have addressed the prognostic significance of AML1 mutations in MDS or AML. Harada et al8 showed that patients with MDS and AML1 mutations had a significantly shorter survival than patients without such mutations. We only observed a nonsignificant tendency toward a shorter survival of patients with t-MDS and AML1 mutations. However, our patients with missense mutations disclosed a significantly shorter survival than patients with nonsense or frameshift mutations who presented a survival almost identical to that of patients without AML1 mutations. Although these results require confirmation in a larger series of patients, they suggest that the 2 types of mutations confer different functional effects. Consistent with this observation, the functional properties of many of the AML1 missense mutations identified in the present study including the S67I, D171N, R80C, Q158H, R139G, P156A, and G138V mutants have been shown experimentally to generate proteins with a dominant loss of function.6-8,12,29 Many nonsense and frameshift mutations, on the other hand, have been shown experimentally to generate truncated AML1 proteins with a recessive loss of function.6-8,12 In vivo, most transcripts with nonsense and frameshift mutations are efficiently degraded by the nonsense-mediated mRNA degradation (NMD) pathway.30 All this points toward haploinsufficiency as the most likely mechanism for protein truncating mutations, as loss of the wild-type allele was not observed in the present study.
Patients with t-MDS and patients with FPD/AML show some striking similarities. First, both diseases are characterized by profound thrombocytopenia, whereas anemia predominates in de novo MDS. Second, AML1 mutations are mainly heterozygous in both types of patients. Third, AML1 mutations are, in both diseases, associated with a high rate of subsequent transformation to overt AML with the same spectrum of cytogenetic abnormalities, including –7/7q–, suggesting the requirement for additional mutations.2,10 Fourth, also in FPD/AML, there seems to exist a different effect of the 2 types of AML1 mutations as FPD patients with missense mutations are at higher risk of developing AML than patients with nonsense or frameshift mutations.12
The specific genetic changes and their role in leukemic transformation have been revealed for most of the recurrent balanced translocations,2,3,31,32 whereas the genetic role of the recurrent unbalanced translocations in most cases remain unsolved. Exceptions are the associations between –17/17q– and p53 mutations located to band 17p13,19,33 and +11 and internal tandem duplications of MLL located to band 11q23.34 The recently observed association between –5/5q– and p53 mutations19,35,36 and between –7/7q– and p15 methylation20,37 and now also AML1 mutations are difficult to explain, because the critical genetic defects underlying –5/5q– and –7/7q– remain unknown. That the cytogenetic and genetic associations may be important in our understanding of leukemogenesis is supported by the different transcriptional profiles for t-MDS and t-AML patients with –5/5q– versus patients with –7/7q– but normal chromosomes 5.38
Prepublished online as Blood First Edition Paper, May 13, 2004; DOI 10.1182/blood-2004-02-0754.
Supported by grants from the Danish Cancer Society and the Alfred Nielsen and wife foundation.
The publication costs of this article were defrayed in part by page charge payment. Therefore, and solely to indicate this fact, this article is hereby marked “advertisement” in accordance with 18 U.S.C. section 1734.
The authors are indebted to Pia Bech for excellent technical assistance in the molecular studies and to Inge-Lise Frost Andersen for excellent technical assistance in the FISH analyses.

