Abstract
Several reports describe that the explant culture of the trabecular bone after collagenase treatment produces mesenchymal stem cells (MSCs). However, the suspended cells had not been intensively examined concerning MSCs. We hypothesized that the cells would acquire the properties of MSCs during their expansion and therefore compared them with marrow aspirate-derived MSCs. Human trabecular bones were washed, digested, filtered, and expanded clonally for 14 days. Their proliferation ability (n = 9) and differentiation potentials for chondrocyte, adipocyte, and osteoblast (n = 6) were similar with those of marrow aspirate-derived MSCs. Epitope and mRNA analysis revealed some differences in both types of cells, which disappeared with expansion and subcultivation. A mixed population of collagenase-released (CR) cells had similar differentiation potentials with CR clone, CD31+ fraction, and osteoblastic cells. For quantitative study, trabecular bone and bone marrow were harvested by single aspiration using a biopsy needle (n = 16). Although the total nucleated cell number harvested was similar, the colony-forming efficiency of CR cells was approximately 100-fold higher than that of BM cells and more than 1 million CR cells could be obtained in 14 days from all donors. Enzymatically released cells from trabecular bone became virtually identical to marrow aspirate-derived MSCs, demonstrating that a trabecular bone fragment can be an alternative source of MSCs. (Blood. 2004; 104:2728-2735)
Introduction
Human cells derived from trabecular bones have been used for many years in the study of bone cell biology.1-5 Recently, Tuli et al,6,7 Noth et al,8 and Sottile et al9 reported that human trabecular bone is a good source of mesenchymal stem cells (MSCs) with the characteristics of self-renewal and multilineage differentiation potential. To isolate MSCs from trabecular bones, they digested human trabecular bone with collagenase to release cells, referred to as collagenase-released (CR) cells. Then, they did explant cultures of the remaining bare bone fragments and harvested MSCs that were derived from the trabecular bones. CR cells were first mentioned by Robey and Termine as part of a study of osteoblast metabolism in vitro.1 However, the CR cells were not examined intensively because the CR cell cultures showed a high level of type III collagen, which the researchers simply regarded as fibroblastic contamination.1 Also, Noth et al described contamination by foreign marrow cells, especially fibroblasts, often predominated in the CR cell cultures.8 Furthermore, collagenase pretreatment followed by extensive washing resulted in trabecular bone fragments completely devoid of surface-adherent cells, with all soft-tissue elements removed.8 Therefore, until now the CR cells have been thought to be a poor source of MSCs.
A large body of literature has developed on MSCs derived from bone marrow aspirate,10 referred to as bone marrow (BM) cells here. Bone marrow is the tissue filling the space between vascular sinuses and bone surfaces in the pores of cancellous bone. The cells are contained within a meshwork of cell surfaces provided by stromal cells or soft connective tissues. This tissue includes an outer capsule of bone lining cells consisting of osteoblasts and preosteoblasts. Endothelial cells line the inner surfaces of the vascular sinuses, and on the abluminal side there is a thick adventitial cell layer, which contains mainly reticular, adipocytic, and smooth muscle cells.11 No specific antigens have been described that associate the developmental potential of MSCs with a specific phenotypic trait. Therefore, it is not possible at this time to determine the anatomic location of MSCs within bone marrow. Several laboratories have isolated monoclonal antibodies, including Stro-112 and SB-10,13 that are immunoreactive against stromal cells cultured in vitro. Recently, Stro-1 was shown to bind to the endothelial cells in a variety of tissues.14 SB-10 was also reported to correspond to activated leukocyte cell adhesion molecule (ALCAM),15 which is expressed on endothelial cells as well as mesenchymal stem cells.16 This suggests that the medullary vascular network represents the closest in vivo approximation to the MSCs.17 We hypothesized that CR cells contained the cells derived from the medullary vascular network. Furthermore, the CR cells contain bone lining cells and adipocytes, which are other origins of MSCs.
In this pioneer study, we have quantitatively compared properties of the cells released from the trabecular bone by collagenase treatment to the bone marrow stromal cells obtained from marrow aspirates. The 2 populations of cells were found to be virtually identical, except initially for the expression of 2 surface markers, which may indicate the presence of endothelial and bone lining cells in the CR population. Contrary to previous reports, obtaining CR cells is a simple and high-yield procedure for isolating primary mesenchymal progenitor cells from a small piece of trabecular bone.
Materials and methods
Trabecular bone fragments and bone marrow aspirates
Both human trabecular bones and bone marrow aspirates were harvested under spinal anesthesia during the knee operations of 15 donors: 8 young patients (23 ± 6 years of age) with anterior cruciate ligament (ACL) injury and 5 elderly patients (71 ± 8 years of age) with osteoarthritis. Young patients underwent ACL reconstructions, and the elderly patients had total knee arthroplasties. In the young patients, trabecular bone fragments were obtained with a curet from the tibia from the new route for the reconstructed ligament. In the elderly patients, trabecular bone fragments were curettaged at the resected proximal tibia and collected. Bone marrow was obtained from the tibia by only one aspiration with an 18-guage needle fastened to a 20-mL syringe.
In addition, both human trabecular bones and bone marrow aspirates were harvested from the tibia by single aspiration using Jamshidi Bone Marrow Biopsy/Aspiration Needle (Allegiance Healthcare, McGaw Park, IL) during the knee operations of 16 donors, 8 young patients (23 ± 3 years of age) and 8 elderly patients (72 ± 8 years of age). The study was approved by an institutional review board of Tokyo Medical and Dental University, and informed consent was obtained from all study subjects.
Isolation and cultures of CR cells and BM cells
Trabecular bone fragments were weighed and washed thoroughly with phosphate-buffered saline (PBS) to remove hematopoietic cells. The fragments were then digested in a collagenase solution (3 mg/mL collagenase D [Roche Diagnostics, Mannheim, Germany] in α modified essential medium [αMEM, Invitrogen, Carlsbad, CA]) at 37°C. After 3 hours, digested cells (CR cells) were filtered through a 70-μm nylon filter (Becton Dickinson, Franklin Lakes, NJ). The digested cells were plated in a culture dish (Nalge Nunc International, Rochester, NY) in complete culture medium: αMEM containing 20% fetal bovine serum (FBS; Invitrogen; lot selected for rapid growth of MSCs), 100 units/mL penicillin (Invitrogen), 100 μg/mL streptomycin (Invitrogen), and 250 ng/mL amphotericin B (Invitrogen). Also, 100 μL bone marrow aspirate was plated in a culture dish in complete culture medium. Both cells were incubated at 37°C with 5% humidified CO2. After 24 hours, the adherent cells were further washed with PBS, and complete culture medium was added every 3 or 4 days. After 14 days of initial plating, the cells were harvested with 0.25% trypsin and 1 mM EDTA (ethylenediaminetetraacetic acid; Invitrogen) for 5 minutes at 37°C (Passage 0), counted with a hemocytometer, and replated at 50 cells/cm2 in a 145-cm2 culture dish. After an additional 14 days of growth, the cells were harvested and counted on a hemocytometer to determine the fold increase at Passage 1. To cryopreserve the cells, they were resuspended at a concentration of 1 × 10⁶ cells per milliliter in αMEM with 5% dimethylsulfoxide (Wako, Osaka, Japan) and 20% FBS (Passage 1 cells). Aliquots of 1 mL were slowly frozen and cryopreserved in liquid nitrogen (Passage 1). To expand the cells, a frozen vial of the cells was thawed, plated in a 60-cm2 culture dish, and incubated for 4 days in the recovery plate. These cells (Passage 2) were used for other experiments.
Osteoblastic cells were harvested from an explant culture of the remaining bone fragments after collagenase digestion according to method used by Robey18 (also Robey and Termine1 ).
CR cells and BM cells were collected with a biopsy needle; 103, 104, and 105 nucleated cells were plated in 6 dishes of 60-cm2 and cultured for 14 days as a primary culture. After each of the 3 dishes was stained with 0.5% Crystal Violet (Wako, Osaka, Japan), optimal initial cell densities were decided on the grounds that colony size was not affected by contact inhibition and that a greater number of colonies were obtained. Then, we harvested the cells plated at optimal densities from the remaining 3 dishes, counted the number of cells, and calculated the total yield.
To isolate nucleated cells from bone marrow, 4 mL Ficoll-Paque PLUS (Amersham Biosciences, Uppsala, Sweden) was layered beneath 8 mL bone marrow diluted with Hanks balanced salt solution (HBSS; Invitrogen) and centrifuged at 400g for 10 minutes at room temperature. The mononuclear cell layer was transferred from the interface and washed with HBSS.
The photographs in Figures 1A, 4A, and 5A were taken using a Nikon Coolpix 4500 digital camera (Nikon, Tokyo, Japan) and Nikon View 5 software. Histological sections were visualized using an Olympus IX71 microscope (Olympus, Tokyo, Japan) and PIXERA Viewfinder 3.0 software.
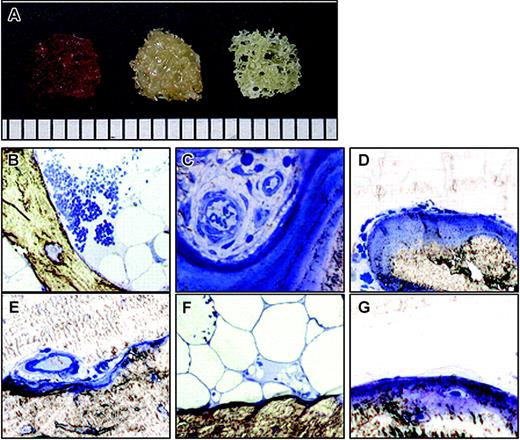
Human trabecular bone. (A) Trabecular bone fragment with hematopoietic cells (left), after washing (center), and after collagenase digestion (right). Scale bar = 1 mm (bottom). (B-G) Histology of trabecular bone. Each bone fragment was embedded in Epon without decalcification and stained with 1% Toluidine Blue. (B-C) Before washing. (D-F) After washing and before collagenase digestion. (G) After collagenase digestion. Original magnification: (B) × 40, (C-G) × 100.
Human trabecular bone. (A) Trabecular bone fragment with hematopoietic cells (left), after washing (center), and after collagenase digestion (right). Scale bar = 1 mm (bottom). (B-G) Histology of trabecular bone. Each bone fragment was embedded in Epon without decalcification and stained with 1% Toluidine Blue. (B-C) Before washing. (D-F) After washing and before collagenase digestion. (G) After collagenase digestion. Original magnification: (B) × 40, (C-G) × 100.
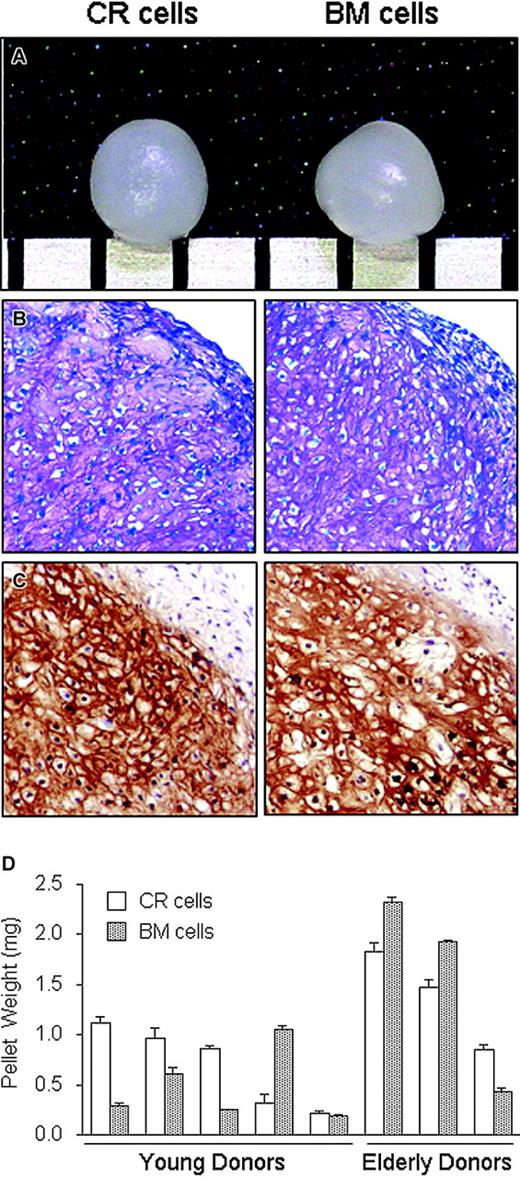
Chondrogenic potential of CR and BM cells. Passage 2 cells were plated at 50 cells/cm2, cultured for 14 days, and then harvested. The cells were pelleted and cultured in chondrogenesis medium for 21 days. (A) Representative macro picture. Scale bar = 1 mm. (B) Histology section stained with Toluidine Blue. Original magnification, × 100. (C) Immunohistochemistry for type II collagen. Original magnification: × 100 (B-C). (D) The cartilage pellets derived from CR cells and BM cells collected from the 5 young and 3 elderly donors were weighed and the data expressed as mean ± SD (n = 3).
Chondrogenic potential of CR and BM cells. Passage 2 cells were plated at 50 cells/cm2, cultured for 14 days, and then harvested. The cells were pelleted and cultured in chondrogenesis medium for 21 days. (A) Representative macro picture. Scale bar = 1 mm. (B) Histology section stained with Toluidine Blue. Original magnification, × 100. (C) Immunohistochemistry for type II collagen. Original magnification: × 100 (B-C). (D) The cartilage pellets derived from CR cells and BM cells collected from the 5 young and 3 elderly donors were weighed and the data expressed as mean ± SD (n = 3).
Adipogenic potential of CR cells and BM cells. Passage 2 cells collected from 6 donors were plated at 100 cells per 60-cm2 dish and cultured for 14 days. The cells were then incubated in adipogenic medium for an additional 21 days. (A) Adipocyte colonies stained with Oil Red-O were shown as red colonies. The same dishes were then stained with Crystal Violet and the total number of colonies was determined. Representative pictures are shown. (B) The ratio of Oil Red-O-positive colonies to the total number of colonies was calculated for each dish, and Oil Red-O-positive colony efficiency is shown for young and elderly donors. The data are expressed as mean ± SD (n = 3).
Adipogenic potential of CR cells and BM cells. Passage 2 cells collected from 6 donors were plated at 100 cells per 60-cm2 dish and cultured for 14 days. The cells were then incubated in adipogenic medium for an additional 21 days. (A) Adipocyte colonies stained with Oil Red-O were shown as red colonies. The same dishes were then stained with Crystal Violet and the total number of colonies was determined. Representative pictures are shown. (B) The ratio of Oil Red-O-positive colonies to the total number of colonies was calculated for each dish, and Oil Red-O-positive colony efficiency is shown for young and elderly donors. The data are expressed as mean ± SD (n = 3).
Assay of colony-forming unit assay
The CR cells and BM cells at Passage 1 were plated at 100 cells per 60-cm2 dish, incubated for 14 days, and stained with 0.5% Crystal Violet in methanol for 5 minutes. The cells were washed twice with distilled water, and the number of colonies per dish was counted. Colonies less than 2 mm in diameter and faintly stained colonies were ignored.
Epitope profile
The CR cells and BM cells at Passage 0 were harvested 14 days after plating. One million cells were resuspended in 200 μL PBS containing 20 μg/mL antibody. After incubation for 30 minutes at 4°C, the cells were washed with PBS and resuspended in 1 mL PBS for fluorescent-activated cell sorter (FACS) analysis. Fluorescein isothiocyanate (FITC)- or phycoerythrin (PE)-coupled antibodies against CD34, CD45, CD 90, CD147, and anti-nerve growth factor receptor antibody (NGFR) were from Becton Dickinson; CD31, CD44, CD54, CD106, and CD117 were from eBioscience (San Diego, CA); CD105 and CD166 were from Ancell (Bayport, MN); Flk-1 (vascular endothelial growth factor [VEGF] receptor 2) was from Genzyme-Techne (Minneapolis, MN); and CD10 was from DakoCytomation (Copenhagen, Denmark). For isotype control, FITC- or PE-coupled nonspecific mouse immunoglobulin G (IgG; Becton Dickinson) was substituted for the primary antibody. Cell fluorescence was evaluated by flow cytometry using a FACSCalibur instrument (Becton Dickinson). The CD31+ fraction was sorted by FACSVantage (Becton Dickinson). The data were analyzed using CellQuest software (Becton Dickinson). Positive expression was defined as the level of fluorescence more than 99% of the corresponding isotype-matched control antibodies.
In vitro chondrogenesis
Cells (200 000) were placed in a 15-mL polypropylene tube (Becton Dickinson) and centrifuged at 450g for 10 minutes. The pellet was cultured at 37°C with 5% CO2 in 400 μL chondrogenic media that contained 500 ng/mL bone morphogenetic protein-2 (BMP-2; R&D Systems, Minneapolis, MN) in high-glucose Dulbecco modified Eagle medium (Invitrogen) supplemented with 10 ng/mL transforming growth factor-β3 (TGF-β3), 10-7 M dexamethasone (Sigma-Aldrich, St Louis, MO), 50 μg/mL ascorbate-2-phosphate, 40 μg/mL proline, 100 μg/mL pyruvate, and 50 mg/mL ITS + Premix (Becton Dickinson; 6.25 μg/mL insulin, 6.25 μg/mL transferrin, 6.25 ng/mL selenious acid, 1.25 mg/mL bovine serum albumin [BSA], and 5.35 mg/mL linoleic acid). The medium was replaced every 3 to 4 days for 21 days.19 For microscopy, the pellets were embedded in paraffin, cut into 5-μm sections, and stained with Toluidine Blue. For type II collagen detection, sections were predigested with proteinase K enzyme for 15 minutes. Then, sections were incubated with primary antibodies: mouse monoclonal antibody to human type II collagen (Daiichi Fine Chemical, Toyama, Japan) for one hour at room temperature. Sections were incubated for 30 minutes with biotinylated secondary antibodies. Immunostaining was detected by Vector ABC kit horse anti-mouse IgG (H+L) (Vector Laboratories, Burlingame, CA). Counterstaining was performed with Mayer-hematoxylin.
Adipogenesis in a colony-forming assay
CR cells or BM cells (100) were plated in 60-cm2 dishes and cultured in complete medium for 14 days. The medium was then switched to adipogenic medium that consisted of complete medium supplemented with 10-7 M dexamethasone, 0.5 mM isobutylmethylxanthine (Sigma-Aldrich), and 50 μM indomethacin (Wako) for an additional 21 days. The adipogenic cultures were fixed in 4% paraformaldehyde, stained with fresh Oil Red-O (Sigma-Aldrich) solution, and the number of Oil Red-O-positive colonies was counted. Colonies less than 2 mm in diameter or faint colonies were ignored. The same adipogenic cultures were subsequently stained with Crystal Violet, and the total number of cell colonies were counted.20
Calcification in a colony-forming assay
CR cells and BM cells (100) were plated in 60-cm2 dishes and cultured in complete media for 14 days. The medium was switched to calcification medium that consisted of complete medium supplemented with 10-9 M dexamethasone (Sigma-Aldrich), 20 mM β-glycerol phosphate (Wako), and 50 μg/mL ascorbate-2-phosphate for additional 21 days. These dishes were stained with fresh Alizarin Red solution (Sigma-Aldrich), and the number of Alizarin Red-positive colonies was counted. Colonies less than 2 mm in diameter or faint colonies were ignored. The same calcification cultures were subsequently stained with Crystal Violet, and the total number of cell colonies were counted.
RNA collection
Total RNA was prepared from 40 million CR cells just after collagenase digestion, or 1 million CR cells and BM cells 14 days after plating Passage 0, by extraction using the RNAqueous Kit (Ambion, Austin, TX).
Reverse transcription-polymerase chain reaction (RT-PCR) analysis
RNA was converted to cDNA and amplified by the Titan One Tube RT-PCR System (Roche Diagnostics, Mannheim, Germany) according to the manufacturer's recommendations. RT was performed by a 30-minute incubation at 50°C, followed by a 2-minute incubation at 94°C to inactivate the RT. PCR amplification of the resulting cDNAs was performed under the following conditions: 35 cycles of 94°C for 30 seconds, 58°C for 45 seconds, and 68°C for 45 seconds, in which the 68°C step was increased by 5 seconds every cycle after 10 cycles. The reaction products were resolved by electrophoresis on a 1.5% agarose gel and visualized with ethidium bromide. PCR primers are as follows: core binding factor alpha 1 (CBFA1, forward), 5′-AGGCAGTTCCCAAGCATTTC-3′ and CBFA1 (reverse), 5′-GGTCGCCAAACAGATTCATC-3′ (440 bp); Osterix (forward), 5′-TGCAGCAAATTTGGTGGCTC-3′ and Osterix (reverse), 5′-AGCAAAGTCAGATGGGTAGG-3′ (540 bp); peroxisome proliferator-activated receptor-γ (PPARγ, forward) 5′-AAGACCACTCCCACTCCTTTG-3′ and PPARγ (reverse), 5′-GTCAGCGGACTCTGGATTCA-3′ (554 bp); fatty acid binding protein 4 (FABP4, forward), 5′-ATGCTTTTGTAGGTACCTGG-3′ and FABP4 (reverse), 5′-CTCTCTCATAAACTCTCGTG-3′ (387 bp); CD63 (forward), 5′-TTGCTCTACGTCCTCCTGCT-3′ and CD63 (reverse), 5′-GTTCTTCGACATGGAAGGGA-3′ (453 bp); CD71 (forward), 5′-TGGCAGTTCAGAATGATGGA-3′ and CD71 (reverse), 5′-TTGATGGTGCTGGTGAAGTC-3′ (446 bp); CD73 (forward), 5′-CTGGGAGCTTACGATTTTGC-3′ and CD73 (reverse), 5′-TCCCACAACTTCATCACCAA-3′ (439 bp); CD146 (forward), 5′-AAGCGGACGCTCATCTTC-3′ and CD146 (reverse), 5′-TCTTTAACCAGCTGTGCCTT-3′ (475 bp); alkaline phosphatase (forward), 5′-CTAACTCCTTAGTGCCAGAG-3′ and alkaline phosphatase (reverse), 5′-TCGGTTTGAAGCTCTTCCAG-3′(741 bp); bone sialoprotein (forward), 5′-CAGTAGTGACTCATCCGAAG-3′ and bone sialoprotein (reverse), 5′-GGAGAGGTTGTTGTCTTCGA-3′ (507 bp); osteocalcin (forward), 5′-ATGAGAGCCCTCACACTCCTC-3′ and osteocalcin (reverse), 5′-GCCGTAGAAGCGCCGATAGGC-3′ (297 bp); and β-actin (forward), 5′-CCAAGGCCAACCGCGAGAAGATGAC-3′ and β-actin (reverse), 5′-AGGGTACATGGTGGTGCCGCCAGAC-3′ (587 bp).
Real-time PCR analysis
Quantitative PCRs were performed in a LightCycler instrument (Roche Diagnostics, Basel, Switzerland). cDNA was synthesized from total RNA using SuperScript III Reverse Transcriptase (Invitrogen) according to the manufacturer's protocol. cDNAs were mixed with LightCycler FastStart DNA Master SYBR Green I and LightCycler Primer Set: CBFA1, PPAR-γ, and β-actin (Search-LC, Heidelberg, Germany). After an initial denaturation step (95°C for 10 minutes), amplification was performed for 35 cycles (95°C for 1 second, 56°C for 30 seconds, and 72°C for 30 seconds).
Alkaline phosphatase (ALP) activity
ALP activity was measured after 21 days of osteoblast differentiation. The cells were harvested with lysis buffer (0.1 M Tris [tris(hydroxymethyl)aminomethane]-HCl, 5 mM MgCl2, 2% Triton-X 100, and 1 mM phenylmethylsulfonyl fluoride [PMSF]) and sonicated. An aliquot (10 μL) of supernatant was added into 100 μL 50-mM p-nitrophenylphosphatase hexahydrate containing 1 mM MgCl2, and the mixture was incubated at 37°C for 30 minutes. The absorption at 405 nm was measured with a spectrophotometer. ALP activity represented millimoles (mM) of p-nitrophenol release after 30 minutes of incubation at 37°C.21
Statistical analysis
To assess differences, 2-factor analysis of variance (ANOVA) and Student t test were used. A value of P < .05 was considered significant.
Results
Culture of CR cells and BM cells
Trabecular bone fragments obtained were red in color (Figure 1A, left) due to the presence of hematopoietic cells, which were observed around the trabecula (Figure 1B) and in the blood vessels (Figure 1C). After washing thoroughly with PBS, the fragments looked yellowish due to removal of the hematopoietic cells (Figure 1A, center). Bone lining cells (Figure 1D), endothelial cells (Figure 1E), and adipocytes (Figure 1F) still remained. After 3 hours of collagenase digestion, the fragment looked whitish (Figure 1A, right) due to the removal of soft tissue (Figure 1G).
CR cells and BM cells had a similar morphology and most of the cells were spindle-shaped. However, polygonal-shaped cells were also observed in both the CR cell and BM cell cultures (data not shown).
Characterization of CR cells and BM cells
We examined surface epitopes of the CR and BM cells 14 days after primary culture. Of the 14 antibodies examined, both CR cells and BM cells were negative for CD31, CD34, CD45, and CD117 (c-kit); showed low levels of CD10,22 Flk-1 (VEGF receptor 2),23 and NGFR23 ; and were positive for CD44,23,24 CD90 (Thy-1),16,22 CD105 (endogrin, SH2),24,25 CD147,23 and CD166 (ALCAM, SB-10)16 (Table 1). Interestingly, CR cells at Passage 0 showed a greater degree of staining for CD54 (intercellular adhesion molecule [ICAM-1])16,24 and CD106 (vascular cell adhesion molecule 1 [VCAM-1])24,26 than BM cells. However, there were no significant differences in the level of CD54 and CD106 expression between the CR cells and the BM cells at Passage 1 (data not shown). Also, there were no obvious differences of the cell surface antigens examined between young and elderly donors.
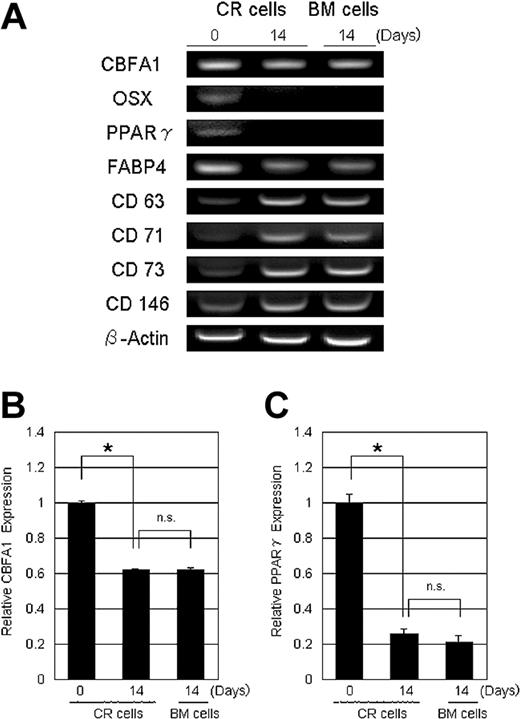
To further define the characteristics of the CR cells, total RNA was prepared from CR cells just after collagenase digestion, 14 days after plating Passage 0 cells, and from BM cells 14 days after plating Passage 0 cells. Reverse-transcription-PCR demonstrated that, in CR cells, the expression level of osteoblastic genes, CBFA1, Osterix, adipogenic genes, PPARγ, and fatty acid binding protein 4 (FABP4) decreased with culture and became similar to the level observed in BM cells (Figure 2A). CBFA1 and PPARγ expression levels were further confirmed by real-time PCR analysis (Figure 2B-C). Contradictorily, reverse-transcriptase-PCR indicated that the expression of CD63 (HOP-26),27 CD71,24 CD73 (SH3),28 and CD14629 increased with culture and became similar to the expression seen in BM cells (Figure 2A).
Gene expression profile of CR cells and BM cells. RNA was prepared from CR cells just after collagenase digestion, 14 days after plating Passage 0 CR cells, and 14 days after plating Passage 0 BM cells. (A) Reverse transcription-PCR analysis. CBFA1 indicates core binding factor alpha 1; OSX, Osterix; PPARγ, peroxisome proliferator activated receptor γ; and FABP4, fatty acid binding protein 4. (B-C) Quantification analysis used by real-time PCR analysis for CBFA-1 (B) and PPARγ (C). β-actin was used as an internal control. The data are expressed as mean ± SD (n = 3). *P < .01; n.s. indicates not significant.
Gene expression profile of CR cells and BM cells. RNA was prepared from CR cells just after collagenase digestion, 14 days after plating Passage 0 CR cells, and 14 days after plating Passage 0 BM cells. (A) Reverse transcription-PCR analysis. CBFA1 indicates core binding factor alpha 1; OSX, Osterix; PPARγ, peroxisome proliferator activated receptor γ; and FABP4, fatty acid binding protein 4. (B-C) Quantification analysis used by real-time PCR analysis for CBFA-1 (B) and PPARγ (C). β-actin was used as an internal control. The data are expressed as mean ± SD (n = 3). *P < .01; n.s. indicates not significant.
Proliferative potential of CR cells and BM cells
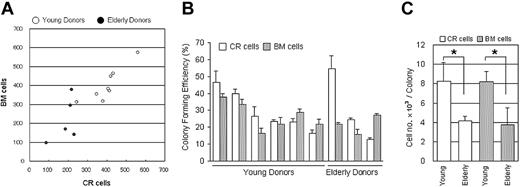
At Passage 1, both CR cells and BM cells had similar proliferation capabilities (Figure 3A). Interestingly, both CR cells and BM cells in young donors proliferated at a greater rate than those in elderly donors. Although some donor variation existed, there were no significant differences seen in the colony-forming efficiencies of CR cells and BM cells (Figure 3B). The difference of proliferation ability between young and elderly donors was due to cell number per colony in both CR cells and BM cells (Figure 3C).
Proliferative potential of CR cells and BM cells. (A) CR cells and BM cells at Passage 1 from 13 donors were plated at 50 cells/cm2 and cultured for 14 days. Average fold increase (n = 3) was calculated and plotted. (B-C) Passage 1 CR cells and BM cells from 6 young donors and 3 elderly donors were plated at 100 cells per 60-cm2 dish in 6 dishes and cultured for 14 days. Then, 3 dishes from each donor were stained with Crystal Violet to count colony number. (B) Colony-forming efficiency is shown. (C) Total cell number was counted from 3 other dishes and cell number per colony was calculated. The data are expressed as mean ± SD. *P < .01
Proliferative potential of CR cells and BM cells. (A) CR cells and BM cells at Passage 1 from 13 donors were plated at 50 cells/cm2 and cultured for 14 days. Average fold increase (n = 3) was calculated and plotted. (B-C) Passage 1 CR cells and BM cells from 6 young donors and 3 elderly donors were plated at 100 cells per 60-cm2 dish in 6 dishes and cultured for 14 days. Then, 3 dishes from each donor were stained with Crystal Violet to count colony number. (B) Colony-forming efficiency is shown. (C) Total cell number was counted from 3 other dishes and cell number per colony was calculated. The data are expressed as mean ± SD. *P < .01
Differentiation potential of CR cells and BM cells
To compare chondrogenic potential of CR cells and BM cells, the cells were pelleted and incubated in chondrogenesis medium. After 21 days of culture, both cell pellets had a similar spherical and glistening transparent appearance (Figure 4A). The development of cartilage matrix from both CR cells and BM cells was shown by staining the proteoglycans with Toluidine Blue (Figure 4B). Type II collagen was detected in the matrix of both pellets for immunohistochemical analysis (Figure 4C). The presence of a cartilage extracellular matrix was analyzed by the weight of each pellet (Figure 4D).
To determine the adipocyte differentiation potential, adipogenesis in a colony-forming assay was performed.30 The number of colonies that accumulated lipids was evaluated 21 days after adipogenesis induction. First, adipocyte colonies were stained with Oil Red-O; then, the same dishes were stained with Crystal Violet and the ratio of Oil Red-O-positive colonies to the total number of colonies was calculated for each dish (Figure 5).
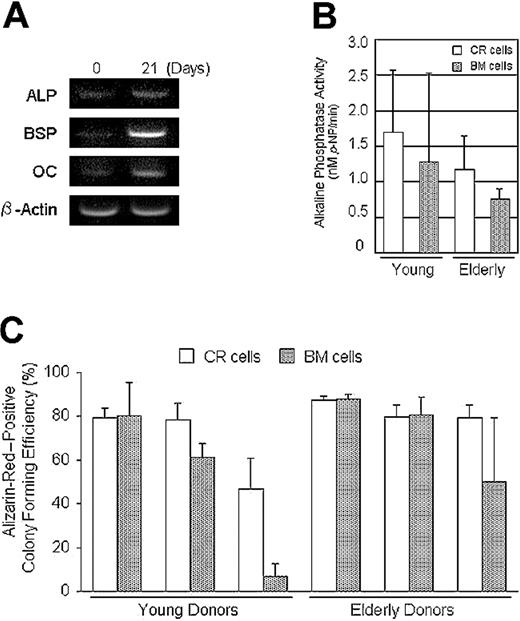
CR cells were cultured in calcification medium, and an increase in alkaline phosphatase, bone sialoprotein, and osteocalcin expression was confirmed by reverse-transcription-PCR (Figure 6A). Also, sufficient levels of alkaline phosphatase activity were detected in both CR cells and BM cells cultured in calcification medium (Figure 6B). Furthermore, the ratio of Alizarin-Red-positive colonies to the total number of colonies was analyzed in a method similar to the adipogenesis assay (Figure 6C).
Osteogenic potential of CR cells and BM cells. (A) Reverse-transcription-PCR analysis. CR cells were cultured in calcification medium for 21 days. The increase of osteogenic gene expressions was confirmed. ALP indicates alkaline phosphatase; BSP, bone sialoprotein; and OC, osteocalcin. (B) Both CR cells and BM cells were cultured in calcification medium for 21 days and alkaline phosphatase activity was measured (n = 3). (C) Passage 2 cells from 6 donors were replated at 100 cells per 60-cm2 dish and cultured for 14 days. Then the cells were incubated in calcification medium for an additional 21 days. Calcified colonies were stained with Alizarin Red; then the same dishes were stained with Crystal Violet. The ratio of Alizarin Red-positive colonies to the total number of colonies was calculated for each dish and Alizarin Red-positive colony efficiency is shown for young and elderly donors. The data are expressed as mean ± SD (n = 3).
Osteogenic potential of CR cells and BM cells. (A) Reverse-transcription-PCR analysis. CR cells were cultured in calcification medium for 21 days. The increase of osteogenic gene expressions was confirmed. ALP indicates alkaline phosphatase; BSP, bone sialoprotein; and OC, osteocalcin. (B) Both CR cells and BM cells were cultured in calcification medium for 21 days and alkaline phosphatase activity was measured (n = 3). (C) Passage 2 cells from 6 donors were replated at 100 cells per 60-cm2 dish and cultured for 14 days. Then the cells were incubated in calcification medium for an additional 21 days. Calcified colonies were stained with Alizarin Red; then the same dishes were stained with Crystal Violet. The ratio of Alizarin Red-positive colonies to the total number of colonies was calculated for each dish and Alizarin Red-positive colony efficiency is shown for young and elderly donors. The data are expressed as mean ± SD (n = 3).
Although there were differences in the differentiation potentials in some donors, there were no significant differences between the CR and BM cells for chondrogenesis (Figure 4D), adipogenesis (Figure 5B), or osteogenesis (Figure 6C) by a 2-factor ANOVA. Also, there were no significant differences between young and elderly donors.
Progenitor assay
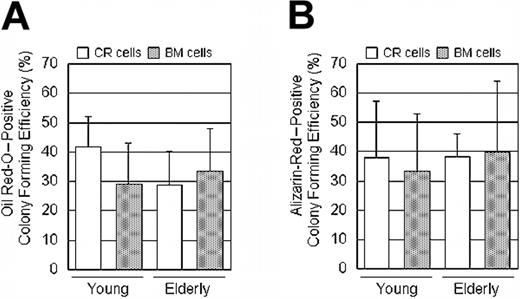
To convincingly show that CR cells come from an MSC progenitor, we expanded CR and BM cells at Passage 0 clonally, and then differentiated the offspring into adipocytes and osteoblasts without replating. Oil Red-O- and Alizarin-Red-positive colony-forming efficiency was 30% to 40% in both CR cells and BM cells and in both young and elderly donors (Figure 7A-B).
Progenitor assay: CR cells and BM cells were cultured in complete culture medium for 14 days, and then medium was switched to adipogenic medium or calcification medium for an additional 21 days at primary culture. The ratio of Oil Red-O- or Alizarin Red-positive colonies to the total number of colonies was calculated for each dish and Oil Red-O-positive colony efficiency (A) and Alizarin Red-positive colony efficiency (B) are shown. The data are expressed as mean ± SD (n = 6).
Progenitor assay: CR cells and BM cells were cultured in complete culture medium for 14 days, and then medium was switched to adipogenic medium or calcification medium for an additional 21 days at primary culture. The ratio of Oil Red-O- or Alizarin Red-positive colonies to the total number of colonies was calculated for each dish and Oil Red-O-positive colony efficiency (A) and Alizarin Red-positive colony efficiency (B) are shown. The data are expressed as mean ± SD (n = 6).
Mixed and purified populations of CR cells
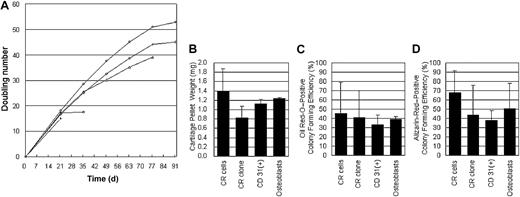
To compare CR cells to better defined populations, we prepared clones and CD31+ fractions of CR cells. Among 5 clones, 3 clones had a proliferation potential of more than 30 doublings (Figure 8A). CD31+ cells were expressed in 2.5 ± 1.7% of CR cells just after collagenase digestion. In addition, we prepared osteoblastic cells to examine their function as MSCs. A mixed population of CR cells had similar potentials for chondrocyte, adipocyte, and osteoblast differentiation with CR clone, CD31+ fraction of CR cells, and osteoblastic cells (Figure 8B-D).
Purified populations of CR cells. (A) CR cells were cultured for 21 days and 5 clones were isolated; then the cells were replated at 50 cells/cm2 every 14 days. Total doubling number of each clone was shown. (B-D) A mixed population of CR cells was compared with a population of CR clone, CD31+ fraction, and osteoblastic cells for chondrocyte (B), adipocyte (C), and osteoblast differentiation (D). Each population was derived from 3 donors and each assay was triplicated. The data are expressed as mean ± SD.
Purified populations of CR cells. (A) CR cells were cultured for 21 days and 5 clones were isolated; then the cells were replated at 50 cells/cm2 every 14 days. Total doubling number of each clone was shown. (B-D) A mixed population of CR cells was compared with a population of CR clone, CD31+ fraction, and osteoblastic cells for chondrocyte (B), adipocyte (C), and osteoblast differentiation (D). Each population was derived from 3 donors and each assay was triplicated. The data are expressed as mean ± SD.
Trabecular bone harvested with biopsy needle
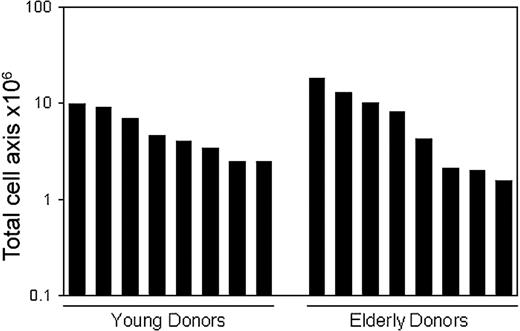
In consideration of the clinical use of CR cells, trabecular bone was harvested by single aspiration using a Jamshidi Bone Marrow Biopsy/Aspiration Needle. Bone marrow was also collected by single aspiration using the same biopsy needle. Nucleated cells were plated as described in “Materials and methods” and expanded for 14 days. Although the total nucleated cell number harvested was almost similar in CR cells and BM cells, colony-forming efficiency of CR cells was approximately 100-fold higher than that of BM cells in both young and elderly donors (Table 2). We were able to harvest 5.4 ± 2.9 × 10⁶ CR cells from young donors and 7.4 ± 6.0 × 10⁶ CR cells from elderly donors. Importantly, more than 1 million CR cells could be obtained from all donors by single aspiration using a biopsy needle (Figure 9).
Yield of MSCs derived from trabecular bone harvested with biopsy needle. Human trabecular bones were harvested from 8 young and 8 elderly donors. After the digestion, the nucleated cells were expanded clonally for 14 days as described in “Materials and methods.” Total cell number of MSCs per a harvested trabecular bone for each donor was shown.
Yield of MSCs derived from trabecular bone harvested with biopsy needle. Human trabecular bones were harvested from 8 young and 8 elderly donors. After the digestion, the nucleated cells were expanded clonally for 14 days as described in “Materials and methods.” Total cell number of MSCs per a harvested trabecular bone for each donor was shown.
Discussion
In this work, we have compared the properties of mesenchymal progenitors in cultures derived from human bone marrow (BM cells) and from a suspension of cells derived from the soft connective tissue and bone lining after collagenase treatment of trabecular bone fragments (CR cells). Results revealed that the morphology, proliferation, expression of molecular differentiation markers, and differentiation potential were very similar in both types of cells. There were, however, some differences in the properties of BM and CR Passage 0 cells, which tend to disappear with subcultivation.
Trabecular bone has been known as a source of primary osteoblasts for years and there seem to be 2 techniques for isolation performed as part of osteoblast research. In the first, the trabecular bone fragments are digested by collagenase solutions, the supernatant fraction (CR cells) is removed, and the remaining bone fragments are cultured.1,5,18 In the second protocol, the trabecular bone fragments are incubated as explants without collagenase digestion.2-4 We digested the trabecular bone fragments using collagenase solutions, discarded the remaining bone fragments, and cultured the supernatant fraction. Therefore, our preparation of CR cells is different from conventional preparations of trabecular bone-derived osteoblasts as explant culture.
Tuli et al6,7 and Noth et al8 reported that explant cultures of collagenase-pretreated trabecular bone fragment, known as isolation technique for osteoblasts,1,5,18 gave rise to multipotential mesenchymal progenitor cells. They maintained explant cultures for 28 days and harvested approximately 2 million cells per gram of bone chips.7 Their cells reached 70% to 80% confluence, while our cells were maintained for 14 days at clonal density when the cells were harvested; therefore, the 2 methods cannot be strictly compared. However, we harvested an average of 89 million cells from young and 103 million cells from elderly donors per gram of trabecular bone. Furthermore, the CR cells could be proliferated more than 100-fold in 14 days. Therefore, this study introduces a higher-yield procedure for isolating MSCs than the previous method.
Our study of PCR showed that the expression of osteoblast phenotypic genes, CBFA1, Osterix, adipocyte phenotypic genes, PPARγ, and FABP4 decreased during the expansion of the CR cells. On the contrary, mRNA expression of possible stem cell-related markers CD63, CD71, CD73, and CD146 increased during the expansion of CR cells. These data suggest that osteoblasts and adipocytes are components of CR cells just after collagenase digestion and that CR cells lost the phenotypes and acquired the stem cell markers during the expansion of CR cells. The PCR results strongly suggest that CR cells at passage 0 contain a subset of adherent cells in addition to a population of MSCs similar to those found in BM cells.
Interestingly, CD54 (ICAM-1) and CD106 (VCAM-1) expression levels in the CR cells were higher than in the BM cells, although these 2 cell populations had a similar pattern of the other cell surface antigens. ICAM-1 and VCAM-1 are expressed on endothelial cells,31 adipose tissue-derived stromal cells,32 and osteoblasts.33 VCAM-1 is also expressed on bone marrow stromal reticular cells.34 These results suggest that the higher expression of ICAM-1 and VCAM-1 on the CR cells reflect the origin of the cells. According to our histologic results (Figure 1), bone lining cells, endothelial cells, and adipocytes were not observed in the remaining trabecular bone fragments after collagenase digestion. This suggests that CR cells originated from these cells. Possibly CR cells also contain marrow reticular cells, which cannot be detected without electron microscopy.34 The CR cells and the BM cells were identical except for expression of 2 surface markers for mature endothelial cells and osteoblasts, but these differences were lost in the next cell passage. This suggests that CR cells dedifferentiate and lose the phenotypes of the origin and become identical to BM cells with culture.
In our study, there were no obvious differences between young and elderly donors for yields of the cells at Passage 0, the colony-forming efficiency at Passage 0 cells, surface cell antigens, progenitors of adipocyte and osteoblast, or chondrocyte, adipocyte, and calcification differentiation potential. However, proliferation ability of Passage 1 decreased with age due to decrease of cell number per colony. Some researchers have reported that aging did not affect colony-forming efficiency and proliferative capacity,35 adipogenesis, and calcification.36 To the contrary, others have reported that aging affected the initial yield37 and proliferative capacity38 of mesenchymal stem cells. Apparently, the disagreement is due to the differences in the sample isolation and expansion.
We quantitatively evaluated the chondrogenesis potential of a population of MSCs as pellet wet weight. According to our previous studies, during in vitro chondrogenesis of MSCs, the pellet increased its size, weight, and cartilage matrix synthesis. On the other hand, DNA yield per a pellet decreased. Radioactivity per DNA in cells prelabeled with 3H-thymidine was stable during in vitro chondrogenesis of MSCs. These results indicate a pellet increased its size due to production of extracellular matrix, not proliferation of the cells.19 We believe pellet size or weight is a convincing indicator for in vitro chondrogenesis of a population of MSCs.19,23,30,39
Under the conditions used, approximately only half of the CR colonies were Oil Red-O positive after 21 days. The absence of adipocytes in the remaining colonies may reflect a limited potential of the cells to differentiate, but the conditions for differentiation may not have been optimal.20 Fully differentiated adipocytes have a poor proliferation potential, and the cells cannot form single cell derived colonies.40 Therefore, our result of CFU for adipogenesis was not due to contamination of fully differentiated adipocytes.
We showed that mixed population of CR cells had similar potentials for chondrocyte, adipocyte, and osteoblast differentiation with CR clone and CD31+ fraction of CR cells. Despite the great interest in MSCs, the cells are still poorly characterized. Part of the difficulty lies in the subtle changes the cells undergo as they are expanded in culture.10 Although clonal colony and purified population of MSCs are readily prepared, the cells rapidly become heterogeneous as they expand so that they contain subpopulations of early progenitors and more differentiated cells. We have already shown that the early progenitors are quickly lost during expansion unless the cells were maintained at very low densities and the culture conditions carefully monitored.30 It has not been established, however, which subpopulations provide the most robust differentiation.41
To demonstrate desirability of procuring trabecular bones, we collected them with a Jamshidi Bone Marrow Biopsy/Aspiration Needle. From 16 donors, approximately 70 mg of trabecular bones was aspirated and approximately 6 million CR cells were harvested after 14 days of culture. It is important that more than 1 million CR cells could be obtained from all donors including elderly patients. As shown in Figure 3A, the CR cells can be expanded more than 100-fold in 14 days. This means a large enough amount of trabecular bone can be collected with biopsy needle in the outpatient setting under local anesthesia.
In comparison of BM cells, we collected bone marrow together with the same biopsy needle and found that, though the total nucleated cell number harvested was almost similar in CR cells and BM cells, colony-forming efficiency of BM cells was approximately 100-fold lower compared with CR cells in both young and elderly donors. Large amounts of bone marrow are aspirated with more invasions. There is a report that small volume aspirates yielded more nucleated cells than large volume aspirates.42 Failure to obtain sufficient amount of aspirates from bone marrow was reported in elderly patients and those with hematologic disorders such as aplastic anemia.43 These data suggest that it is not always possible to collect enough bone marrow from all donors by single aspiration using a biopsy needle to ensure the harvest of a sufficient number of MSCs. We propose that a trabecular bone fragment can be an alternative source of mesenchymal stem cells for both basic research and clinical use.
In conclusion, suspended cells from trabecular bone by collagenase digestion were virtually identical to mesenchymal stem cells obtained from marrow aspirates.
Prepublished online as Blood First Edition Paper, July 8, 2004; DOI 10.1182/blood-2003-12-4452.
Supported in part by grants from the Marine and Fire Insurance Association of Japan, the Japan Orthopaedics and Traumatology Foundation, the Nakatomi Foundation, and the Japan Sports Medicine Foundation (I.S.); and the Japan Latest Osteoarthritis Society and the Center of Excellence Program for Frontier Research on Molecular Destruction and Reconstruction of Tooth and Bone in Tokyo Medical and Dental University (T.M.).
The publication costs of this article were defrayed in part by page charge payment. Therefore, and solely to indicate this fact, this article is hereby marked “advertisement” in accordance with 18 U.S.C. section 1734.
We thank Hideya Yoshimura, MD, for help with real-time PCR; Akiko Yokoyama, MD, for help with cell culture derived from tissues harvested with biopsy needle; Izumi Nakagawa for excellent technical assistance; Miyoko Ojima for expert help with histology; and Alexandra Peister, PhD, and Kelly Johanson, PhD, for valuable suggestions and proofreading.

