Abstract
The classical model of bacterial killing by phagocytic cells has been recently challenged by questioning the toxic effect of oxygen products and attributing the fundamental role to K+ ions in releasing antimicrobial proteins within the phagosome. In the present study we followed
Introduction
Phagocytic cells play a fundamental role in the antimicrobial defense by engulfing and killing various potentially pathogenic microorganisms. Patients with chronic granulomatous disease (CGD) suffer repeated, often fatal infections due to severe impairment of the antimicrobial defense mechanisms.1 The discovery that CGD is the consequence of a genetic defect in one of the essential subunits of the
When activated, NADPH oxidase transfers electrons from intracellular NADPH to extracellular (or intraphagosomal) O2, forming
Decrease or reversal of the plasma membrane potential alters the driving force for all other charged particles, favoring outward movement of cations and inward movement of anions. Indeed, compensating H+ efflux has been demonstrated by many laboratories7-12 although the underlying transport pathway(s) is still the subject of intensive investigations.4 More recently K+ efflux has also been reported from activated PMNs.13,14 On the other hand, plasma membrane depolarization impedes Ca2+ influx induced either by store depletion or by stimulation of chemotactic receptors.15,16
In view of all these ion movements initiated by the charge separation via the NADPH oxidase, we had proposed that alteration of the ionic composition of the intraphagosomal space may contribute to the impairment of bacterial killing in CGD.17 Recently Reeves and coworkers questioned the toxic effect of various ROS under the conditions of the phagosome.18 Instead, they suggested a specific role for K+ ions enriched in the intraphagosomal space in the release of granule enzymes from their polyanionic support and thereby in their activation. In fact, this hypothesis reduces the role of
The aim of the present study was to gain insight into the relative importance in bacterial killing of (1)
Materials and methods
Materials
Ficoll was from Pharmacia (Peapack, NJ); 3-3′-dipentyloxacarbocyanine
Preparation of neutrophil granulocytes from human blood
Human neutrophils were obtained from blood of healthy volunteers by dextran sedimentation followed by Ficoll-Paque gradient centrifugation using endotoxin-free solutions and sterile conditions at 4°C to prevent premature activation of the cells. Contaminating red blood cells were removed by hypotonic lysis. Cells were finally resuspended in sterile endotoxin-free H-medium and kept on ice until use. Preparations contained more than 95% neutrophils; their viability, as determined by erythrosin B dye exclusion, exceeded 95%.
Measurement of \(\mathbf{O_{2}^{{\cdot}-}}\) production
Superoxide production of the cells was tested with the superoxide dismutase-inhibitable cytochrome c reduction or the lucigenin-based chemiluminescence. To measure superoxide production in the extracellular medium with cytochrome c, cells (106/mL) were suspended in H-medium containing 100 μM cytochrome c. Control samples contained 12.5 μg/mL superoxide dismutase. Aliquots (200 μL) of the suspension were added into wells of a 96-well plate and prewarmed at 37°C for 5 minutes in a shaking enzyme-linked immunosorbent assay (ELISA) reader (Labsystems iEMS Reader MF, Helsinki, Finland). The cells were stimulated with the appropriate stimuli by the addition of 5 μL of the stimulus solution. The changes in the absorption were recorded at 550 nm for 10 minutes with 2 measurements per minute at 37°C with gentle shaking. After subtracting the background values, superoxide production was calculated with the use of an absorption coefficient of 21 mM-1cm-1 for cytochrome c.
To measure reactive oxygen species production with lucigenin-based chemiluminescence, the cells (107/mL) were suspended in H-medium containing 5.1 mg/mL lucigenin (dissolved in dimethyl sulfoxide [DMSO]). Aliquots (200 μL) of the suspension were added into wells of a 96-well plate and prewarmed at 37°C for 5 minutes in a shaking Fluoroskan Ascent FI luminometer (Labsystems). Cells were stimulated with the appropriate stimuli by the addition of 5 μL of the stimulus solution. Changes in the luminescence were recorded for 20 minutes at 37°C with gentle shaking. In 6 independent experiments linear correlation was obtained between values of cytochrome c reduction and chemiluminescence; thus, relative fluorescence units (RLUs) were converted to nanomoles of superoxide on the basis of parallel measurement of PMA-stimulated
Measurement of membrane potential changes
Changes in the membrane potential were followed by the potential-sensitive fluorescent dye 3-3′-dipentyloxacarbocyanine,
Measurement of the 86Rb release from neutrophils
Neutrophils (107/mL) were incubated in H-medium with 86RbCl (0.25 μCi [0.0093 MBq]) for 30 minutes at 37°C, washed twice in cold phosphate-buffered saline (PBS), and resuspended in H-medium at the density of the killing assay (107/mL). After incubation with or without stimuli at 37°C for 5 minutes, the cells were immediately centrifuged (4 minutes, 500g). Radioactivity was determined in an aliquot (100 μL) of the cell-free supernatant using an Automatic Gamma Counter (1470 Wizrad; Wallac, Turku, Finland). The 86Rb efflux detected in the unstimulated samples was subtracted from the values of the stimulated ones. The 86Rb release of the PMA-stimulated, DPI-free sample was taken as 100%. DPI by itself did not induce any 86Rb efflux from the cells.
Measurement of bacterial survival
Bacteria (9 × 10⁸ cells in 900 μL H medium) were opsonized with 100 μL mixed human blood serum of at least 5 different donors for 5 minutes at 37°C. PMNs (9 × 10⁶ in 900 μL H-medium) were then incubated with 100 μL (108/mL) opsonized bacteria for 30 minutes at 37°C. Samples (100 μL) were taken at indicated time points and lysed in 900 μL ice-cold H-medium containing 1 mg/mL saponin. In the case of S aureus, additional treatment at -80°C for 20 minutes was applied. Freezing did not impair subsequent growth of S aureus.
Bacterial growth was followed in a plate reader (Labsystems iEMS Reader MF) on the basis of changes in optical density, taking into account that in the exponential phase of bacterial growth the division time is constant. For calculations we applied the principles of real-time polymerase chain reaction (PCR); thus we characterize the samples containing unknown amount of living bacteria with an incubation time (tinc) the length of which is only dependent on the initial bacterial concentration. Specifically, lysed PMN samples were diluted in LB to decrease the initial optical density (OD) (typically a 5-fold dilution to a final volume of 200 μL per well was applied). A parallel series of 1:2 dilutions from the stock bacterial suspension (108/mL) was also prepared in LB. Then bacteria were grown in a shaking plate reader at 37°C for 5 to 8 hours, and the OD was followed continuously at 650 nm. Samples were run in 4 to 8 parallels. The data obtained in a typical experiment are shown in Figure 1A. The time required for achieving a certain OD value (in most experiments 0.2 was chosen) was determined for each dilution and plotted as initial bacterial count versus incubation time (tinc). A straight line was fitted on the experimental points (Figure 1B), and the number of surviving bacteria was calculated with the following formula: E coli or S aureus =
Determination of bacterial concentrations in the semiautomated killing assay and comparison with conventional plating. Serial dilution of the E coli suspension was prepared, and bacteria were grown on a 96-well plate as described in “Materials and methods.” (A) Changes in absorption at 650 nm were followed in time. (B) Initial concentration of bacteria was plotted against the obtained incubation time values (tinc). Error bars represent SD of 4 parallel samples. Fitting a straight line on the experimental data resulted in the following calibration equation: E coli =
Determination of bacterial concentrations in the semiautomated killing assay and comparison with conventional plating. Serial dilution of the E coli suspension was prepared, and bacteria were grown on a 96-well plate as described in “Materials and methods.” (A) Changes in absorption at 650 nm were followed in time. (B) Initial concentration of bacteria was plotted against the obtained incubation time values (tinc). Error bars represent SD of 4 parallel samples. Fitting a straight line on the experimental data resulted in the following calibration equation: E coli =
Killing activity of neutrophils was assessed on the basis of the changes in the number of viable bacteria. Because the 30-minute incubation time with PMNs exceeded the division time of both bacteria under some experimental conditions, the final bacterial count was higher than the initial one. In Figures 1, 5, and 6, “bacterial survival” is represented as the final bacterial count expressed as percentage of the initial count.
Effect of DPI on bacterial survival and bacteria-induced ROS generation. Effect in human neutrophils stimulated with either opsonized E coli (A) or S aureus (B). Superoxide (ROS) production was measured by chemiluminescence and expressed as percentage of the maximal value obtained in the absence of DPI. Bacterial survival numbers represent the ratio of surviving CFUs per initial CFUs. Mean ± SEM of 5 (survival of E coli), 3(E coli-induced ROS production), 10 (survival of S aureus), and 5 (S aureus-induced ROS production) independent experiments are presented. In the case of E coli and S aureus, 100% ROS production corresponds to 3.52 and 4.46 nmol
Effect of DPI on bacterial survival and bacteria-induced ROS generation. Effect in human neutrophils stimulated with either opsonized E coli (A) or S aureus (B). Superoxide (ROS) production was measured by chemiluminescence and expressed as percentage of the maximal value obtained in the absence of DPI. Bacterial survival numbers represent the ratio of surviving CFUs per initial CFUs. Mean ± SEM of 5 (survival of E coli), 3(E coli-induced ROS production), 10 (survival of S aureus), and 5 (S aureus-induced ROS production) independent experiments are presented. In the case of E coli and S aureus, 100% ROS production corresponds to 3.52 and 4.46 nmol
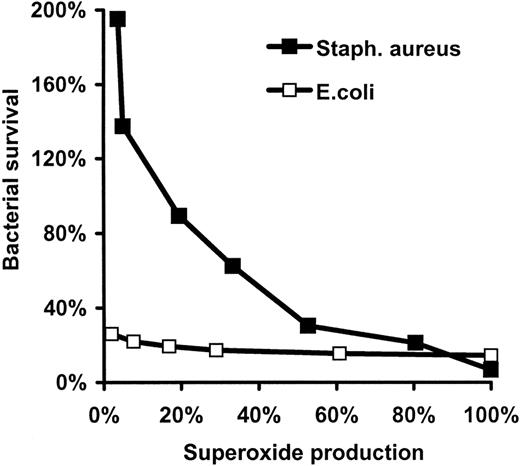
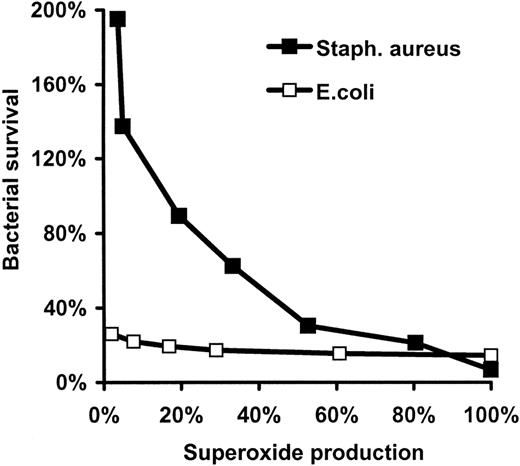
Relation of bacterial survival to superoxide (ROS) generation. Data presented in Figure 5 are replotted so that each point represents values obtained at the same DPI concentrations.
Relation of bacterial survival to superoxide (ROS) generation. Data presented in Figure 5 are replotted so that each point represents values obtained at the same DPI concentrations.
Experiments carried out to control the semiautomated bacterial growth assay
Bacterial growth in the central or peripheral wells of the plate differed by less than 2%, and it was not influenced by the presence of nonviable bacteria or saponin-treated PMNs. The utilized concentration of saponin and dilutions of DMSO or the opsonizing serum had no effect on the growth of bacteria. DPI (0 to 5000 nM) was without effect on the viability and rate of reproduction of S aureus but inhibited E coli. Therefore, the lysed samples of the E coli killing assays using DPI were diluted 1:500 instead of 1:5. In this dilution DPI had no inhibitory effect on E coli cells even in the case of 5000 nM in the killing suspension. Varying the ratio of bacteria to PMNs between 1 and 10 had no significant influence on the killing efficiency in the presence of various DPI concentrations. Figure 1 summarizes the results of a typical experiment where bacterial survival was compared by the semiautomated plate reader assay (Figure 1C) and conventional counting of colony-forming units (CFUs) on LB agar plates (Figure 1D). In the latter experiments, the lysed samples have been diluted further, 1:2500, in cold H-medium, and 100 μL was smeared on Petri dishes containing LB agar and cultured overnight at 37°C. The CFUs have been counted and presented as the percentage of the initial CFU number. Disruption of the microfilament structure by cytochalasin B is known to block phagocytosis and, hence, killing. In a concentration of 10 μM, cytochalasin B inhibited bacterial killing to similar extent, independent of the applied method.
Statistical analysis
Data are presented either as representative traces of the indicated number of experiments or as the mean ± SEM of the number of determinations indicated (n).
Results
Relation of \(\mathbf{O_{2}^{{\cdot}-}}\) production and membrane potential change
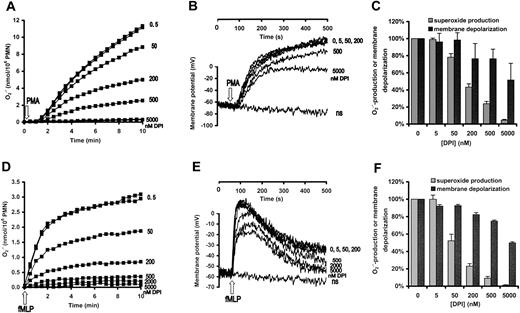
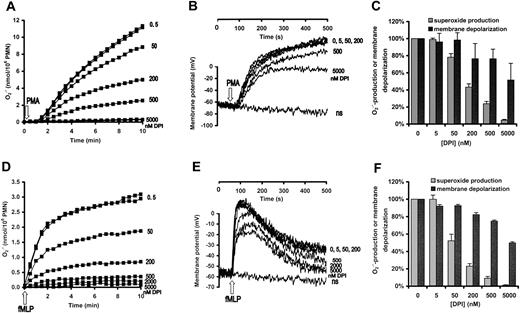
Neutrophilic granulocytes were stimulated either with phorbol myristate acetate (PMA), an activator of protein kinase C, (Figure 2A-C) or with the chemotactic peptide formyl-methionyl-leucylphenylalanine, fMLP (Figure 2D-F). Changes of membrane potential and
Effect of DPI on superoxide production and membrane depolarization in human neutrophils. Neutrophils were pretreated with the indicated concentration of DPI for 3 minutes and subsequently stimulated with 100 nM PMA (A-C) or 1 μM fMLP (D-F). (A,D) Superoxide production was measured by cytochrome c reduction. (B,E) Membrane potential of nonstimulated cells is indicated by “ns.” (C,F) Data are expressed as percentage of the value obtained in the DPI-free samples. In panel C, the mean ± SEM of 11 (superoxide production) and 5 (membrane depolarization) independent experiments are summarized, whereas panel F represents the data of 3 independent experiments.
Effect of DPI on superoxide production and membrane depolarization in human neutrophils. Neutrophils were pretreated with the indicated concentration of DPI for 3 minutes and subsequently stimulated with 100 nM PMA (A-C) or 1 μM fMLP (D-F). (A,D) Superoxide production was measured by cytochrome c reduction. (B,E) Membrane potential of nonstimulated cells is indicated by “ns.” (C,F) Data are expressed as percentage of the value obtained in the DPI-free samples. In panel C, the mean ± SEM of 11 (superoxide production) and 5 (membrane depolarization) independent experiments are summarized, whereas panel F represents the data of 3 independent experiments.
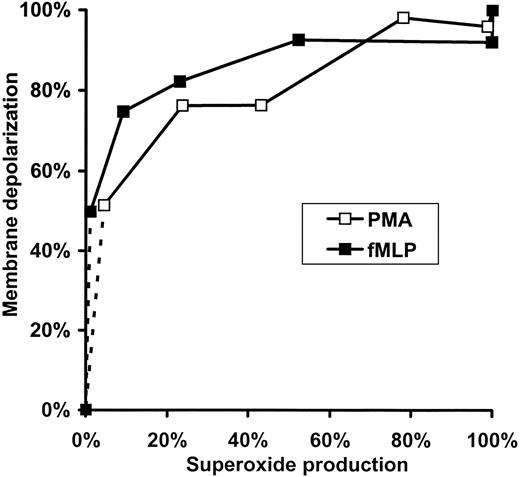
Further analysis of the data summarized in Figure 2 emphasizes the nonlinear relation between the rate of
Relation of membrane depolarization to superoxide production in fMLP- or PMA-activated human neutrophils. Data presented in Figure 2C,F are replotted so that each point represents values obtained at the same DPI concentrations.
Relation of membrane depolarization to superoxide production in fMLP- or PMA-activated human neutrophils. Data presented in Figure 2C,F are replotted so that each point represents values obtained at the same DPI concentrations.
Relation of \(\mathbf{O_{2}^{{\cdot}-}}\) production and K+ release from granulocytes
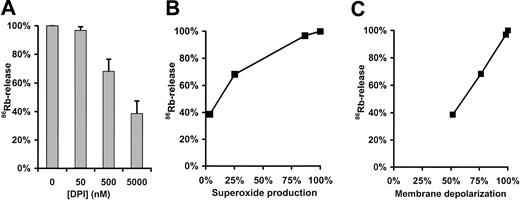
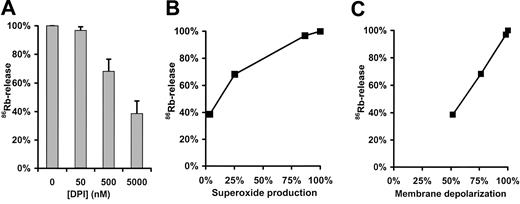
In previous investigations H+ and K+ were suggested as cations potentially compensating for the electron efflux via the oxidase. In the last decade ample information has been gained on the H+ conductance of phagocytic cells under resting and activated conditions7,10-12,20 whereas the importance of K+ movements has been emphasized recently.13,14 To gain further insight into the relation of
Effect of DPI on PMA-induced 86Rb efflux from human neutrophils. (A) Human neutrophils were loaded with 86Rb and pretreated with the indicated concentration of DPI for 3 minutes. 86Rb efflux was subsequently initiated with 100 nM PMA. Data are expressed as percentage of the value obtained in the absence of DPI. Error bars represent standard deviation of 4 parallel samples. (B) 86Rb release was related to superoxide production detected in the presence of the same DPI concentration. (C) 86Rb release was related to the extent of membrane depolarization obtained in the presence of the same DPI concentration.
Effect of DPI on PMA-induced 86Rb efflux from human neutrophils. (A) Human neutrophils were loaded with 86Rb and pretreated with the indicated concentration of DPI for 3 minutes. 86Rb efflux was subsequently initiated with 100 nM PMA. Data are expressed as percentage of the value obtained in the absence of DPI. Error bars represent standard deviation of 4 parallel samples. (B) 86Rb release was related to superoxide production detected in the presence of the same DPI concentration. (C) 86Rb release was related to the extent of membrane depolarization obtained in the presence of the same DPI concentration.
Relation of \(\mathbf{O_{2}^{{\cdot}-}}\) production and bacterial survival
In the next experiments bacterial survival was measured by a new, highly effective semiautomated method using a microtiter plate reader (see “Materials and methods” and Figure 1). Intracellular ROS production occurring during bacterial phagocytosis and killing was followed in parallel by the lucigenin-based chemiluminescence method in a luminescent plate reader. DPI inhibited the chemiluminescence signal induced by either E coli (Figure 5A) or S aureus (Figure 5B) with similar efficiency as observed in the cases of
Analyzing the survival of S aureus in the function of the rate of
Figure 3 revealed a very sharp relation between membrane potential change and
Effect of Zn2+ on the membrane potential, \(\mathbf{O_{2}^{{\cdot}-}}\) production, and bacterial survival
To investigate further the importance of depolarization versus
Discussion
Our experiments revealed a nonlinear relation between
At moderate rate of
Finally, when
In our experiments the variable parameter was the rate of
Taken together, the presented data provide experimental support for our earlier hypothesis17 that both depolarization and secondary ion movements initiated by electron transfer via the NADPH oxidase, and the produced
Prepublished online as Blood First Edition Paper, July 13, 2004; DOI 10.1182/blood-2004-03-1005.
Supported by grants from the Hungarian Research Fund (OTKA T037755, Ts040865, M036310), the Hungarian Ministry of Health (ETT 041/2003), and FIRCA (1 R03 TW006421-01A1).
The publication costs of this article were defrayed in part by page charge payment. Therefore, and solely to indicate this fact, this article is hereby marked “advertisement” in accordance with 18 U.S.C. section 1734.
The authors are indebted to Profs D. Roos and P. Enyedi and Dr A. Mócsai for critical reading of the manuscript and to Ms Erzsébet Seres-Horváth, Edit Fedina, and Krisztina Sütő for expert and devoted technical assistance.

![Figure 1. Determination of bacterial concentrations in the semiautomated killing assay and comparison with conventional plating. Serial dilution of the E coli suspension was prepared, and bacteria were grown on a 96-well plate as described in “Materials and methods.” (A) Changes in absorption at 650 nm were followed in time. (B) Initial concentration of bacteria was plotted against the obtained incubation time values (tinc). Error bars represent SD of 4 parallel samples. Fitting a straight line on the experimental data resulted in the following calibration equation: E coli = \batchmode \documentclass[fleqn,10pt,legalpaper]{article} \usepackage{amssymb} \usepackage{amsfonts} \usepackage{amsmath} \pagestyle{empty} \begin{document} \(2.2206{\times}\mathrm{e}^{-0.0365{\times}\mathrm{t}}_{\mathrm{inc}}{\times}10^{6}{/}\mathrm{mL}\) \end{document}. The results of 1 representative experiment out of 29 similar ones are shown. (C) Time course of the decrease in surviving bacteria followed by the semiautomated assay. (D) Time course of the decrease in surviving bacteria determined by conventional plating. Where indicated, cytochalasin B (CB) was present at a concentration of 10 μM. The results shown are representative of 4 similar experiments, and error bars represent standard deviation of 4 parallel samples.](https://ash.silverchair-cdn.com/ash/content_public/journal/blood/104/9/10.1182_blood-2004-03-1005/6/m_zh80210468710001.jpeg?Expires=1763692980&Signature=b9-ULjuycXwkuGrod23ufLQKSv87XwUs6SZR31-SiEK9Bno8JfEGlYR7p77JRR7AR5VHAKsA8U1ZKIuhN8ATG696cdVLMRGPc5SRkeocGYKFqjwzueLpCIJD~nV8UBBpjGZ58FlgxarV-oP25MMrvdR2qn9pf68RG1457CrZIK43mxRlaWli5WH24Ymm~kQmA0~hldqreNe9FMH6QP815AcqduPrVoLmZ1nuCJgN~eSoRm-IyN2EgpmoOkO1AGJ7kelpKHEGfDZDMpXwSXa9Oz6vpLMw3bQky-A2jaVphL-DviJFw2hW8SBUJZluXlEm3g9FPpRtLReH3~wG6YY~ZA__&Key-Pair-Id=APKAIE5G5CRDK6RD3PGA)
![Figure 5. Effect of DPI on bacterial survival and bacteria-induced ROS generation. Effect in human neutrophils stimulated with either opsonized E coli (A) or S aureus (B). Superoxide (ROS) production was measured by chemiluminescence and expressed as percentage of the maximal value obtained in the absence of DPI. Bacterial survival numbers represent the ratio of surviving CFUs per initial CFUs. Mean ± SEM of 5 (survival of E coli), 3(E coli-induced ROS production), 10 (survival of S aureus), and 5 (S aureus-induced ROS production) independent experiments are presented. In the case of E coli and S aureus, 100% ROS production corresponds to 3.52 and 4.46 nmol \batchmode \documentclass[fleqn,10pt,legalpaper]{article} \usepackage{amssymb} \usepackage{amsfonts} \usepackage{amsmath} \pagestyle{empty} \begin{document} \(\mathrm{O}_{2}^{{\cdot}-}\) \end{document} per 10 minutes per 106 PMNs, respectively.](https://ash.silverchair-cdn.com/ash/content_public/journal/blood/104/9/10.1182_blood-2004-03-1005/6/m_zh80210468710005.jpeg?Expires=1763692980&Signature=DBXggWi~imGnJDppYHvcQ3WVoxTbS7ScS9R-z2sLf1dknf9xD0tlQAaPTgOE4xZoGrhwLfnkortpiSa3w~lM9I5N-jxVMCnkNMf-WU~HKDsvxyn3XvSUPDv5ayh5lbAFEssG8WBrnd4NVCuFQbUTpqpF4vFuCGA~YyKYu7fLaMAFOM52Xx5FMiX06i6-HC8H5FjIOgoh3RqS-0KDuxv4d-8TMcyPmGrfnKp51P8rSRLoCwKjLA1f3LIFNvUJWvDcpVe3A4TFX8E-3lIpiAe9BUyOFvLbM1PfqL8XSWMawfcsX5O7z6HKUk6pzdwgrbrmyKNVMujgaSijW3UF9s1CtQ__&Key-Pair-Id=APKAIE5G5CRDK6RD3PGA)

![Figure 1. Determination of bacterial concentrations in the semiautomated killing assay and comparison with conventional plating. Serial dilution of the E coli suspension was prepared, and bacteria were grown on a 96-well plate as described in “Materials and methods.” (A) Changes in absorption at 650 nm were followed in time. (B) Initial concentration of bacteria was plotted against the obtained incubation time values (tinc). Error bars represent SD of 4 parallel samples. Fitting a straight line on the experimental data resulted in the following calibration equation: E coli = \batchmode \documentclass[fleqn,10pt,legalpaper]{article} \usepackage{amssymb} \usepackage{amsfonts} \usepackage{amsmath} \pagestyle{empty} \begin{document} \(2.2206{\times}\mathrm{e}^{-0.0365{\times}\mathrm{t}}_{\mathrm{inc}}{\times}10^{6}{/}\mathrm{mL}\) \end{document}. The results of 1 representative experiment out of 29 similar ones are shown. (C) Time course of the decrease in surviving bacteria followed by the semiautomated assay. (D) Time course of the decrease in surviving bacteria determined by conventional plating. Where indicated, cytochalasin B (CB) was present at a concentration of 10 μM. The results shown are representative of 4 similar experiments, and error bars represent standard deviation of 4 parallel samples.](https://ash.silverchair-cdn.com/ash/content_public/journal/blood/104/9/10.1182_blood-2004-03-1005/6/m_zh80210468710001.jpeg?Expires=1763839373&Signature=r~RIGHXM6CJ032uB6pBk6LT~5YPqDpwDn6NSVjyIE3-3fK2sMNHE9VmHuaYydO-A3TdbvVxxqcjgOujzsTG1O-OykjMhhH0v8uljufuUPD7bbjVTN9NqoXP3H0f9g2AhY6kPcO8Cclodb~oQQhXscmXv7~DB4KmCLfAPwU93XvcMbz7g9l3zM96B~v5LTBB2PZelRO5YRejkrRbA4pP2G-FsXs1~MHZZZFyr~w8YFk1MiXtN8oMlkQnvgIOQwEaoiPyHsvGXxnQc7fQVA8tBkmxhiR2ixavIljELxjjOYA~cONT9~lYMAQF9iqcAqkpn4EcWkTtnuOMxtDPOthIaVA__&Key-Pair-Id=APKAIE5G5CRDK6RD3PGA)
![Figure 5. Effect of DPI on bacterial survival and bacteria-induced ROS generation. Effect in human neutrophils stimulated with either opsonized E coli (A) or S aureus (B). Superoxide (ROS) production was measured by chemiluminescence and expressed as percentage of the maximal value obtained in the absence of DPI. Bacterial survival numbers represent the ratio of surviving CFUs per initial CFUs. Mean ± SEM of 5 (survival of E coli), 3(E coli-induced ROS production), 10 (survival of S aureus), and 5 (S aureus-induced ROS production) independent experiments are presented. In the case of E coli and S aureus, 100% ROS production corresponds to 3.52 and 4.46 nmol \batchmode \documentclass[fleqn,10pt,legalpaper]{article} \usepackage{amssymb} \usepackage{amsfonts} \usepackage{amsmath} \pagestyle{empty} \begin{document} \(\mathrm{O}_{2}^{{\cdot}-}\) \end{document} per 10 minutes per 106 PMNs, respectively.](https://ash.silverchair-cdn.com/ash/content_public/journal/blood/104/9/10.1182_blood-2004-03-1005/6/m_zh80210468710005.jpeg?Expires=1763839373&Signature=2nYhnm74YhBjUwqG2HkyQ~GZB9MLjePza0NQB107i0Jp424aTCU2XT76ViBAE1gWkg0CO~2aPHbtJhREOXTi~bHziQ2kwFFKAFgS~IjwMtoenT-EFimWDc~4pv5AQmjlBi7sv5UoZApWRTU~xvqHIRV4C5PuzUczgcJU3aJj3gKGh6K0iSyyHgEi6FIeE9e1Ae5R9cesYOhZSQ-Yflly3KLUEbMusu8kLKS4pQyZ74oFANWdiG4V1E5-D2VdWs9dxOTGeqZVjXQ6ZS602KaX26YhKUPSfPtNWLq9xbwG5JeNoeR7jBBDkg1LiZOwYfogTjWDEi1xLSwfxda5NTz1Xg__&Key-Pair-Id=APKAIE5G5CRDK6RD3PGA)
