Abstract
Our aim was to identify pre-transplant variables affecting the outcome of submyeloablative HSCT in 63 patients (27–66 y, median 52) with NHL/Hodgkin/CLL (n=29), acute leukemia (n=19), and myeloma (n=15). Donors were HLA-matched sibs (n=37), 10/10 allele-matched unrelated (n=19), or 1-locus/allele mismatched (n=7). The conditioning was 100 mg/m2 melphalan with (n=42; no prior auto) or without (n=21; prior auto) 50 mg/kg cyclophosphamide. GVHD prophylaxis comprised cyclosporine-mycophenolate (HLA-matched sibs) or tacrolimus-mycophenolate (others). G/GM-CSF were not used. Supportive care was uniform. 16 patients died of transplant-related causes (TRM), and 35 relapsed (8 alive after salvage therapy). Of the variables analyzed in univariate fashion for effect on OS, the following were found to be significant and were entered into a Cox model for TRM, relapse, EFS and OS: age (83% <60 y vs 17% ≥60 y), performance status (33% 0 vs 41% 1 vs 25% ≥2), chemosensitivity (60% refractory vs 40% non-refractory), donor (63% sib vs 37% unrelated), HLA (89% match vs 11% mismatch), donor age (48% ≤45 y vs 52% >45 y), 108/kg CD3+ cells infused (49% <3 vs 51% ≥3), LDH (56% normal vs 44% increased), platelet count (40% <100 vs 60% ≥100), albumin (32% ≤3 vs 68% >3), and hemoglobin (24% <9 vs 76% ≥9). Relapse was higher with refractory disease (RR 3.2; P=0.003) and donor age >45 (RR 2.7; P=0.007), and TRM higher with PS ≥2 (RR 22.7 vs PS 0; P=0.001), donor age >45 (RR 5.3; P=0.013) and increased LDH (RR 8.6; P=0.003). The table shows factors influencing OS and EFS.
| Variable . | OS . | DFS . | |||
|---|---|---|---|---|---|
| Adverse . | Favorable . | RR (95% CI) . | P . | RR (95% CI) . | P . |
| PS ≥2 | PS 0 | 0.17 (0.06–0.47) | 0.001 | 0.28 (0.11–0.78) | 0.007 |
| PS ≥2 | PS 1 | 0.48 (0.24–0.98) | 0.045 | 0.50 (0.24–1.03) | 0.061 |
| Increased LDH | Normal LDH | 0.29 (0.14–0.62) | 0.001 | 0.43 (0.22–0.83) | 0.012 |
| Refractory disease | Non-refractory disease | 0.38 (0.15–0.92) | 0.033 | 0.36 (0.17–0.77) | 0.008 |
| Donor age >45 | Donor age ≤45 | 0.39 (0.19–0.77) | 0.007 | 0.27 (0.14–0.53) | <0.001 |
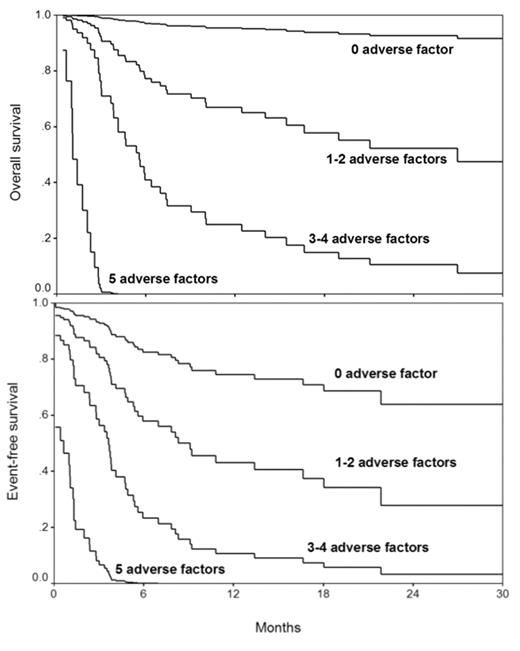
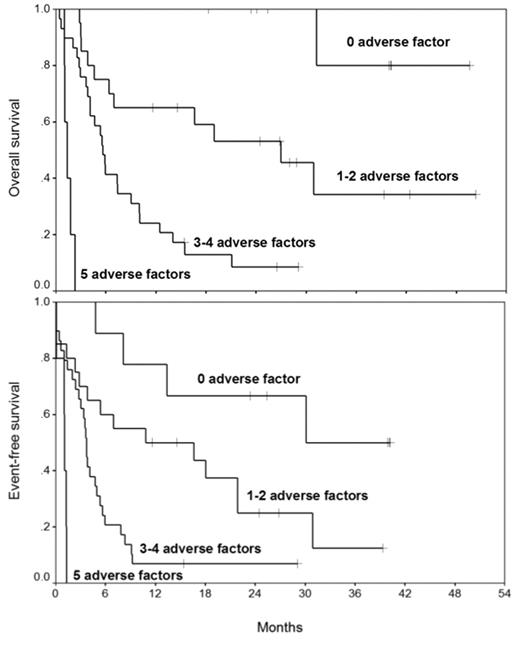
Scoring 1 point for each adverse factor (2 for PS ≥2), patients were divided into 4 groups: none (n=9), 1–2 (n=20), 3–4 (n=29), and 5 (n=5). The figures below show adjusted OS and EFS curves derived from the Cox analysis by the number of adverse variables. The figures below show actual OS and EFS Kaplan-Meier curves by the number of adverse variables.
The figures below show actual OS and EFS Kaplan–Meier curves by the number of adverse variables.
Interestingly, diagnosis, patient age and type of donor did not affect outcome. These data will allow better prediction of outcome in patients proposed to be treated with this regimen, and suggest that modification of therapy is needed for patients with ≥3 adverse variables to improve survival.
Author notes
Corresponding author


