Abstract
It has been shown that mice with complete deficiency of all 4.1R protein isoforms (4.1-/-) exhibit moderate hemolytic anemia, with abnormal erythrocyte morphology (spherocytosis) and decreased membrane stability. Here, we characterized the Gardos channel function in vitro and in vivo in erythrocytes of 4.1-/- mice. Compared with wild-type, the Gardos channel of 4.1-/- erythrocytes showed an increase in Vmax (9.75 ± 1.06 vs 6.08 ± 0.09 mM cell × minute; P < .04) and a decrease in Km (1.01 ± 0.06 vs 1.47 ± 1.02 μM; P < .03), indicating an increased sensitivity to activation by intracellular calcium. In vivo function of the Gardos channel was assessed by the oral administration of clotrimazole, a well-characterized Gardos channel blocker. Clotrimazole treatment resulted in worsening of anemia and hemolysis, with decreased red cell survival and increased numbers of circulating hyperchromic spherocytes and microspherocytes. Clotrimazole induced similar changes in 4.2-/- and band 3+/- mice, indicating that these effects of the Gardos channel are shared in different models of murine spherocytosis. Thus, potassium and water loss through the Gardos channel may play an important protective role in compensating for the reduced surface-membrane area of hereditary spherocytosis (HS) erythrocytes and reducing hemolysis in erythrocytes with cytoskeletal impairments. (Blood. 2005;106:1454-1459)
Introduction
Erythrocyte dehydration is a characteristic feature of several hematologic disorders, including sickle cell anemia, β-thalassemia, and hereditary spherocytosis (HS).1-4 Potassium chloride cotransport and calcium-activated potassium channel (Gardos channel; KCNN4)5 mediate erythrocyte dehydration in sickle cell disease and β-thalassemia,6 but their role in HS is less defined.
The dehydration observed in erythrocytes of patients with HS is caused by decreased potassium content, which is only partially offset by an increase in cell sodium. Several studies have shown that the erythrocyte “permeability” to sodium and potassium is increased in HS and that the increased sodium permeability is associated with increased activity of the Na-K ATPase.7-12 It has been postulated that the associated increase in adenosine triphosphate (ATP) consumption leads to ATP depletion during erythrostasis, followed by increased calcium entry, activation of the Gardos channel, and dehydration.8,13 A more recent study found no changes in the transport activity of Na-K-2Cl cotransport and Na/Li exchange in human HS erythrocytes, whereas sodium potassium pump activity was increased and potassium chloride cotransport activity was decreased.14 Thus, there are no clearly defined molecular mechanisms, which explains the increased cell sodium and decreased cell potassium concentrations of HS erythrocytes. There is no clear link between the ion transport abnormalities of HS erythrocytes and their reduced in vivo survival; however, it has been shown that the number of microspherocytes (erythrocytes with low cell volume [mean corpuscular volume (MCV)] and high cell-hemoglobin concentration [CHCM]) is a reasonably good indicator of disease severity.15
The ion transport properties of spherocytic erythrocytes from mice with naturally occurring mutations leading to spectrin or ankyrin deficiency have been described.16 These studies highlighted several similarities between the murine and the human diseases, such as the increased cell sodium and reduced potassium contents and the increased passive permeability to monovalent cations.16 In mouse erythrocytes lacking either erythroid band 3 (AE1) protein or β-adducin, dehydration and microspherocytosis were reported.17,18 In mouse red cells lacking 4.2 membrane protein, we described an up-regulated response of Na-K-2Cl cotransport, sodium-hydrogen exchange, and sodium leak to hypertonic shrinkage.19 Although these studies have highlighted the functional relation between membrane proteins and ion transport pathways, no data are actually available on the role of the calcium-activated potassium channel in HS erythrocytes.
In the present study, we characterize Gardos channel activity in mouse erythrocytes devoid of protein 4.1, an important component of the red cell cytoskeleton, and we establish that this pathway plays a crucial role in compensating for the reduced surface membrane area of HS erythrocytes.
Materials and methods
Mice with targeted deletion of 4.1, 4.2, and β-adducin have been previously described.18-20 Control mice (C57Bl/6J and 129/SvEv) were purchased from the Jackson Laboratory (Bar Harbor, ME).
Hematologic parameters, erythrocyte cation content, Gardos channel activity, and biochemical parameters
Mouse erythrocyte and reticulocyte cellular indices were measured with the Advia 120 hematology analyzer (Bayer, Diagnostic Division, Tarrytown, NY). Red cell density profiles were determined using phthalate esters, as previously described.21 Erythrocyte sodium and potassium content were determined in fresh erythrocytes by atomic absorption spectrophotometry (AAnalyst 800; Perkin Elmer, Norwalk, CT).
Gardos channel activity was determined as rubidium Rb 86 (86Rb) influx into erythrocytes incubated at 2% hematocrit in isotonic sodium chloride media (145 mM NaCl, 2 mM KCl, 0.15 mM MgCl2, 0.1 mM ouabain, 10 mM Tris-MOPS pH 7.4 at 22°C, 10 μM bumetanide, and 10 μCi/mL [0.37 MBq] 86Rb). Free ionic calcium was buffered between 0 and 3 mM with 1 mM EGTA (ethyleneglycotetraacetic acid) or citrate buffer, as described by Wolff et al22 and Rivera et al.23 Extracellular Ca2+ concentration was calculated by using the dissociation constant (Kd) for EGTA or citrate and correcting for ionic strength at pH 7.4 and 0.15 mM MgCl2. At time 0 minute, the Ca2+ ionophore A23187 (5 μM) was added; aliquots were removed at 2 and 5 minutes and immediately were spun down through 0.8 μL cold media containing 5 mM EGTA buffer and an underlying cushion of n-butyl phthalate. Supernatants were aspirated, and the tube tip containing the cell pellet was cut off. Erythrocyte-associated radioactivity was counted in a gamma counter (model 41600 HE; Isomedic ICN Biomedicals, Costa Mesa, CA). K+ uptake was linear up to 5 minutes, and fluxes were calculated from linear regression slopes. Lactate dehydrogenase (LDH), total bilirubin, and plasma hemoglobin levels were measured on a Hitachi 917 analyzer (Hitachi, Tokyo, Japan).
In vivo studies
Effects of clotrimazole (CLT) on 4.1-/- and wild-type mice. 4.1-/- mice were divided into 2 groups, and either vehicle (n = 7) or CLT (80 mg/kg; n = 7) was administered orally by gavage twice daily. Hematologic parameters were evaluated at baseline and after 11 days of therapy. All vehicle-treated mice were alive and well at the end of the treatment, whereas 2 of the CLT-treated animals died before day 11 (days 4 and 8). Another group of 4.1-/- mice was treated with higher dosages of CLT (160 mg/kg; n = 7) administered orally by gavage twice daily. Hematologic parameters were evaluated at baseline and after 48 hours of therapy. Only 4 animals were alive at the end of this treatment. Wild-type mice (C57B6/2J) were treated with CLT (80 mg/kg; n = 6) administered orally by gavage twice daily. Hematologic parameters were evaluated at baseline and after 10 days of therapy. All wild-type mice were alive and well at the end of the treatment.
Effects of o-chlorophenyl-diphenyl acetamide (CDA) on 4.1-/- mice. CLT in vivo is metabolized into 4 major metabolites: diphenylmethanol, diphenylmethane, 4-xydroxyphenyl phenyl-methane, and 4-xydroxyphenyl phenyl-methanol.24 We have previously found that an analog of CLT metabolites, CDA, has 10-fold greater potency than CLT to inhibit human erythrocytes Gardos channel in vitro (IC50 4-6 nM vs 40-60 nM; C.B., unpublished results, November 1996). This compound was administered to six 4.1-/- mice at the dose of 100 mg/kg twice a day for 7 days of treatment. Hematologic parameters were evaluated at baseline and after 7 days of therapy. Four of the 6 animals were alive at the end of the treatment.
Effects of CLT on 4.2-/- and band 3+/- mice. Twice a day, 4.2-/- mice were treated with high dosages of CLT (160 mg/kg; n = 6) administered orally by gavage. Hematologic parameters were evaluated at baseline and after 6 days of therapy. All 6 animals were alive at the end of this treatment. Two band 3+/- animals were treated with high dosages of CLT (160 mg/kg) administered orally by gavage twice daily for 7 days. Hematologic parameters were evaluated at baseline and after 7 days of therapy. Both these animals were alive at the end of this treatment.
Measurement of erythrocyte in vivo survival
Histology, electron microscopy, and tissue-iron content studies
Mouse tissues (spleen and liver) were fixed in phosphate-buffered formaldehyde (3.7%) before dehydration and paraffin embedding using standard techniques. Sections were cut at 4 μm and were stained with hematoxylin and eosin or Perl iron stain.
For electron microscopy studies, washed erythrocytes were suspended in 2.5% glutaraldehyde (in Na-cacodylate buffer, pH 7.4), treated with 1% osmium tetroxide solution, and embedded in Epon resin. Thin sections were stained with uranyl acetate and lead citrate for transmission electron microscopy.
Perl-iron-stained kidney sections were visualized under a Nikon Eclipse E600 microscope equipped with a 20 ×/0.50 objective lens (Nikon, Melville, NY) and an RT Slider SPOT 2.3.1 camera using SPOT Advanced 3.5.9 software (Diagnostic Instruments, Sterling Heights, MI).
Statistical analysis
All values are presented as mean plus or minus SD. For each group of mice, the statistical significance of changes in the variables measured after treatment was assessed by one-way analysis of variance (ANOVA) with Tukey test for post hoc comparison of the mean.
Results
Characterization of 4.1-/- erythrocytes: ion content and osmotic fragility
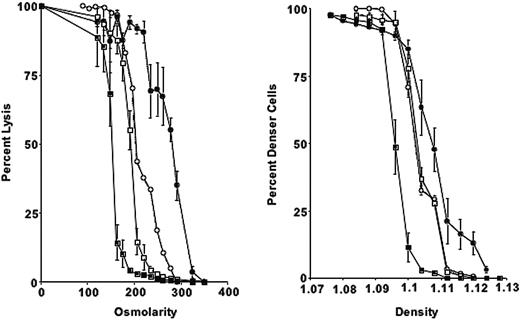
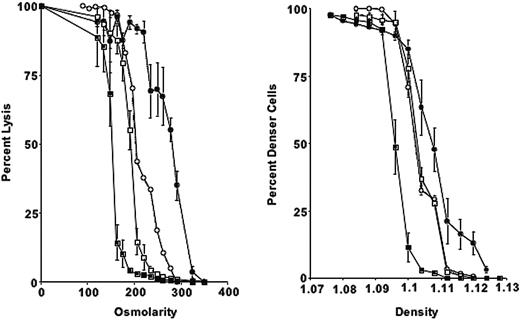
Compared with those of wild-type mice, 4.1-/- erythrocytes exhibited a marked increase in cell sodium and a marked decrease in cell potassium and total cation content (Table 1). Cell dehydration is evident from the increased CHCM (Table 1) and from the right-shifted phthalate density profile (Figure 1). The increased hemoglobin distribution width (HDW) for erythrocyte cell hemoglobin concentration reflects the presence of erythrocytes with reduced and increased hemoglobin concentration. Normal CHCMr and HDWr values of 4.1-/- reticulocytes suggest that fragmentation and dehydration are not present at this stage (Table 1).
Osmotic fragility is increased in 4.1-/- erythrocytes. Compared with mouse strains deficient in other cytoskeletal proteins (4.2 and β-adducin), 4.1-/- erythrocytes show a more pronounced shift toward higher densities and greater osmotic fragility (Figure 1).
Osmotic fragility curves and phthalate density profiles for 4.1-/-, 4.2-/-, β-adducin-/-, and control erythrocytes. (Left) Percentage lysis is plotted compared with osmolarity of incubation medium for 4.1-/- (•), 4.2-/- (○), β-addu-cin-/- (□), and control erythrocytes (▪). (Right) Phthalate density profile for 4.1-/-, 4.2-/-, β-adducin-/-, and control. Symbols are as in panel A. Error bars depict SD.
Osmotic fragility curves and phthalate density profiles for 4.1-/-, 4.2-/-, β-adducin-/-, and control erythrocytes. (Left) Percentage lysis is plotted compared with osmolarity of incubation medium for 4.1-/- (•), 4.2-/- (○), β-addu-cin-/- (□), and control erythrocytes (▪). (Right) Phthalate density profile for 4.1-/-, 4.2-/-, β-adducin-/-, and control. Symbols are as in panel A. Error bars depict SD.
In vitro functional characterization of the Gardos channel activity of 4.1-/- erythrocytes
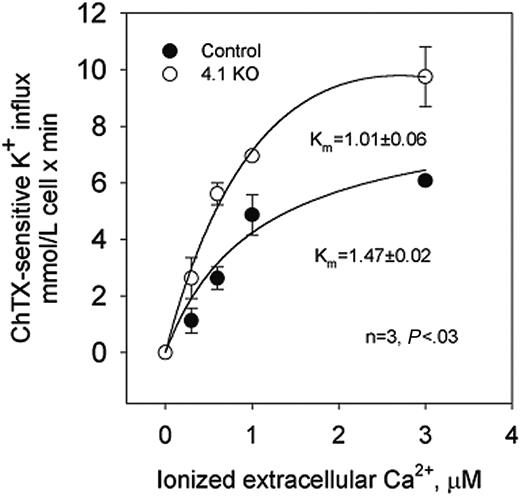
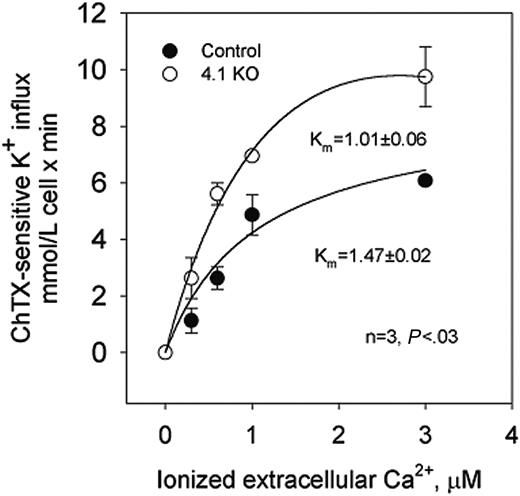
The dependence on extracellular Ca2+ of potassium transport through the Gardos channel was studied in control and 4.1-/- erythrocytes.23 In control erythrocytes, charybdotoxin (ChTX)-sensitive potassium influx increased rapidly and saturated at approximately 5.8 mM cell/min when ionized Ca2+ was increased up to 3 μM (Figure 2).
Nonlinear fitting of the experimental points for a hyperbolic function gave a Vmax of 6.08 ± 0.09 mM cell/min (n = 4). ChTX-sensitive flux kinetic analysis showed a constant affinity for Ca2+ (Km) of 1.47 ± 0.02 μM. In 4.1-/- erythrocytes, similar kinetic analysis revealed the Vmax of the system to be significantly higher (from 6.08 to 9.75 ± 1.06 mM cell/min; n = 3; P < .04) and the affinity constant for Ca2+ to be significantly lower (from 1.47 to 1.01 ± 0.06 μM; n = 3; P < .03) than in control erythrocytes (Figure 2). Thus, in 4.1-/- erythrocytes, the activation of the Gardos channel occurs at a much lower intracellular Ca2+ concentration than in control erythrocytes.
Calcium-activated potassium channel (Gardos channel) in control, 4.2+/-, 4.2-/-, and 4.1-/- mouse erythrocytes. Gardos channel, ChTX (50 nM)-sensitive potassium influx was measured at varying concentrations of extracellular calcium in the presence of A23187. Data are expressed as mean ± SD of 3 separate experiments.
Calcium-activated potassium channel (Gardos channel) in control, 4.2+/-, 4.2-/-, and 4.1-/- mouse erythrocytes. Gardos channel, ChTX (50 nM)-sensitive potassium influx was measured at varying concentrations of extracellular calcium in the presence of A23187. Data are expressed as mean ± SD of 3 separate experiments.
Effects of in vivo Gardos channel inhibition on erythrocytes of 4.1-/- mice
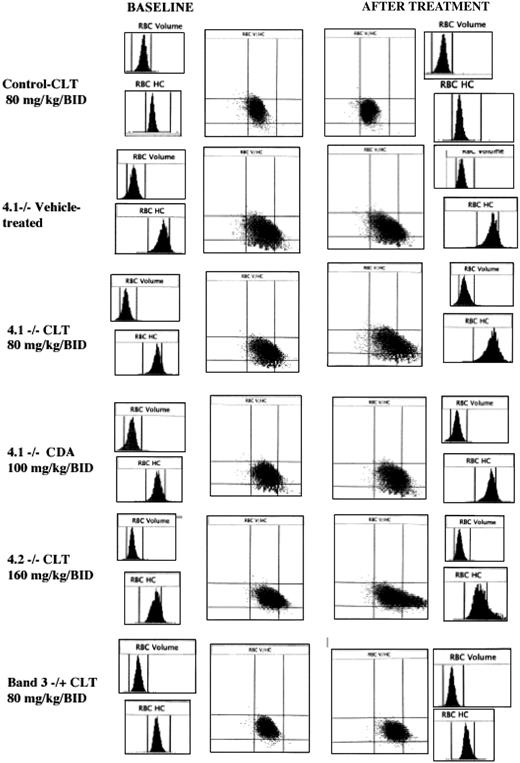
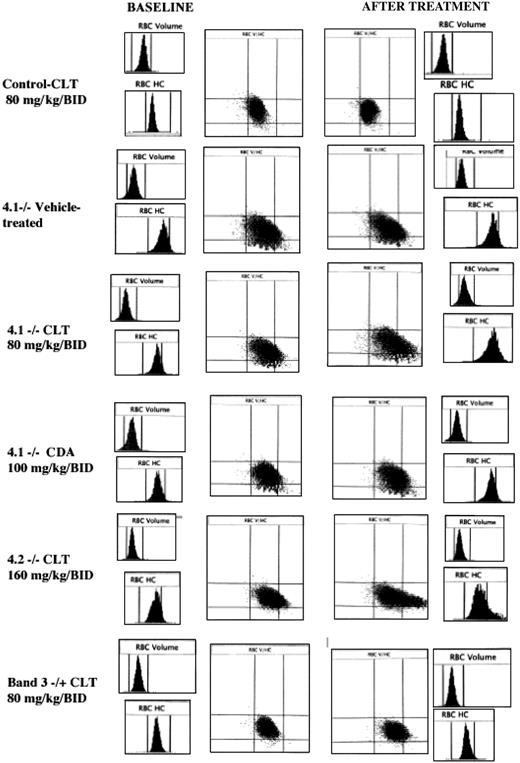
Effects of CLT treatment on 4.1-/- mouse erythrocytes. To determine the in vivo role of the Gardos channel in murine HS, 4.1-/- mice were treated with oral CLT, a powerful Gardos channel blocker, at dosages of 80 mg/kg twice a day for 11 days.27 Although previous studies with CLT in healthy or SAD mice had been associated with no mortality, 2 of the 7 treated animals died at days 4 and 8 of treatment. No deaths were observed in a group of 7 vehicle-treated 4.1-/- mice. In the 5 surviving mice, 11 days of CLT treatment were associated with a significant increase in erythrocyte dehydration, assessed by the percentage of cells with CHCM greater than 37 g/dL (Table 2; Figure 3).
Additional significant changes in CHCM, HDW, reticulocyte distribution width (RDW), reticulocyte count (Table 2), and percentage of immature reticulocytes (from 19.5% ± 1.8% to 28.2% ± 8.0%) were noted, suggesting worsening of anemia/hemolysis and cell dehydration. Cell sodium content was significantly increased after CLT treatment, but no changes were evident in red cell potassium content, most likely because the increase in dense, dehydrated cells with lower potassium content was offset by the increase in reticulocytes, which had higher potassium content (data not shown). Thus, blockade of the Gardos channel in vivo resulted in a paradoxic worsening of dehydration and a marked enhancement of the formation of microspherocytes. A similar treatment schema carried out in 7 healthy control C57BL/6 mice at 80 mg CLT/kg twice a day for 10 days resulted in no mortality or morbidity and no changes in erythrocyte or reticulocyte parameters (Figure 3).
To assess whether these changes could be produced at shorter time intervals, seven 4.1-/- mice were treated with 160 mg CLT/kg twice a day for 48 hours. Such treatment in previous studies had also been well tolerated and resulted in no toxicities or deaths.27 Three animals died before completion of the treatment. High-dose CLT treatment of 4.1-/- mice resulted in significant reductions in hemoglobin, hematocrit, and increases in HDW percentages of hyperchromic erythrocytes and cell sodium. Plasma hemoglobin, LDH, and bilirubin levels increased significantly with CLT administration (Table 3).
Histograms for cell volume and cell hemoglobin concentration at baseline and after treatment with Gardos channel blockers. Histograms for erythrocyte volume (RBC volume) and cell hemoglobin concentration (RBC HC) and plot of RBC HC (x-axis) versus RBC volume (y-axis) are presented at baseline (left side) and after the specified in vivo treatment (right side). Rows from top to bottom: control mouse before and after 11 days of treatment with clotrimazole (CLT, 80 mg/kg twice a day); 4.1-/- mouse before and after 11 days of treatment with the vehicle use for drug administration; 4.1-/- mouse before and after 11 days of treatment with CLT (80 mg/kg twice a day); 4.1-/- mouse before and after 7 days of treatment with CDA (100 mg/kg twice a day); 4.2-/- mouse before and after 6 days of treatment with CLT (160 mg/kg twice a day); and band 3+/- mouse before and after 7 days of treatment with CLT (80 mg/kg twice a day). Data obtained with the Bayer ADVIA 120 hematology analyzer. One representative mouse shown for each condition; similar results were obtained for the other animals.
Histograms for cell volume and cell hemoglobin concentration at baseline and after treatment with Gardos channel blockers. Histograms for erythrocyte volume (RBC volume) and cell hemoglobin concentration (RBC HC) and plot of RBC HC (x-axis) versus RBC volume (y-axis) are presented at baseline (left side) and after the specified in vivo treatment (right side). Rows from top to bottom: control mouse before and after 11 days of treatment with clotrimazole (CLT, 80 mg/kg twice a day); 4.1-/- mouse before and after 11 days of treatment with the vehicle use for drug administration; 4.1-/- mouse before and after 11 days of treatment with CLT (80 mg/kg twice a day); 4.1-/- mouse before and after 7 days of treatment with CDA (100 mg/kg twice a day); 4.2-/- mouse before and after 6 days of treatment with CLT (160 mg/kg twice a day); and band 3+/- mouse before and after 7 days of treatment with CLT (80 mg/kg twice a day). Data obtained with the Bayer ADVIA 120 hematology analyzer. One representative mouse shown for each condition; similar results were obtained for the other animals.
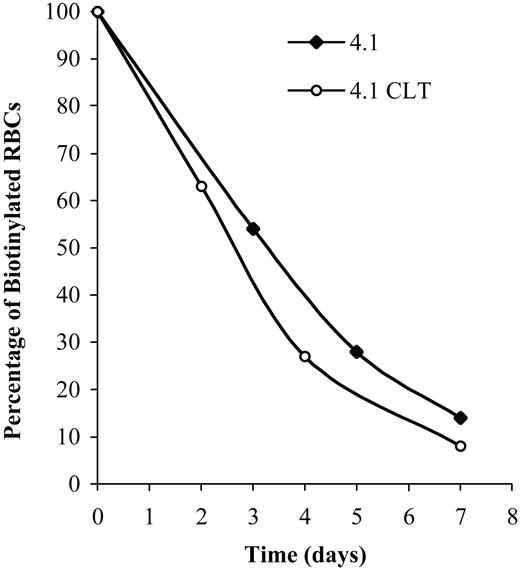
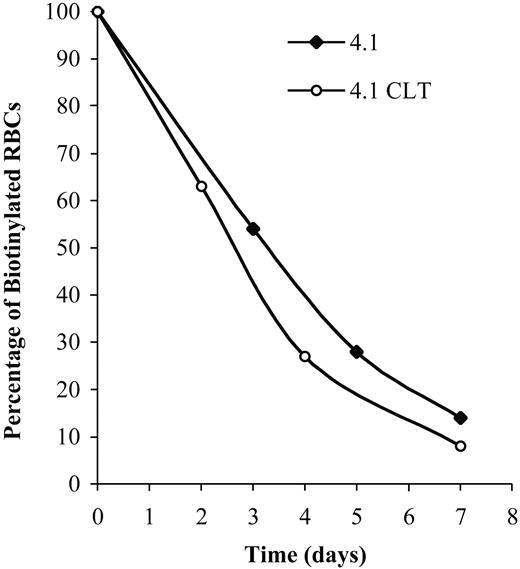
To demonstrate that CLT administration was associated with worsening of hemolysis, erythrocyte survival was measured in 4.1-/- animals treated with 80 mg/kg CLT twice a day for 11 days. Compared with untreated 4.1-/- animals (Figure 4 and Table 4), CLT treatment resulted in a shortened survival of erythrocytes. Changes in plasma levels of LDH, bilirubin, and hemoglobin were also indicative of an increased hemolysis in 4.1-/- mice treated with CLT (Table 3).
Given that CLT has several additional pharmacologic effects not attributed to Gardos channel inhibition but rather to the imidazole moiety of CLT and its cytochrome P450 inhibitor effect,28,29 it was important to determine whether the effects seen in 4.1-/- mice indeed resulted from blockade of the Gardos channel. Therefore, we treated six 4.1-/- mice with a member of a new class of compound that has no imidazole moiety and that has greater in vitro inhibitory potency than CLT on the Gardos channel.30 The compound, CDA, inhibits the Gardos channel in vitro with an IC50 value of 5 nM compared with the CLT IC50 of 60 nM (C.B., unpublished data). This compound is different from that currently being tested in patients with sickle cell disease,31 and it has never been used in mice. Thus, no data are available on its oral bioavailability and pharmacokinetics. Two animals did not survive the treatment, and 4 remaining animals were studied after 7 days of treatment at dosages of 100 mg/kg twice a day. We noted significant reductions in hematocrit and hemoglobin levels and increases in CHCM, percentages of hyperchromic erythrocytes, percentages of hyperchromic microcytes, cell sodium content, and indicators of hemolysis (Figure 3; Tables 2, 3).
Effects of CLT administration on erythrocyte lifespan for 4.1-/- mice. Compared with healthy controls, 4.1-/- erythrocytes have a markedly reduced half-life.20 Mice were treated with CLT at a dose of 80 mg/kg twice a day for 11 days. Biotinylation was carried out as described in “Materials and methods,” and animals were bled at specified times. The percentage of biotinylated erythrocytes was determined by flow cytometry and is shown here for 2 representative animals. Data were obtained from 3 untreated and 4 CLT-treated 4.1-/- mice (7 days of treatment).
Effects of CLT administration on erythrocyte lifespan for 4.1-/- mice. Compared with healthy controls, 4.1-/- erythrocytes have a markedly reduced half-life.20 Mice were treated with CLT at a dose of 80 mg/kg twice a day for 11 days. Biotinylation was carried out as described in “Materials and methods,” and animals were bled at specified times. The percentage of biotinylated erythrocytes was determined by flow cytometry and is shown here for 2 representative animals. Data were obtained from 3 untreated and 4 CLT-treated 4.1-/- mice (7 days of treatment).
To evaluate whether the effects seen in 4.1-/- mice could also be seen in other mouse models of HS, six 4.2-/- animals were treated for 6 days with CLT at dosages of 160 mg/kg twice a day. CLT administration resulted in significant increases in HDW, percentages of hyperchromic erythrocytes, and cell sodium content, again indicating that CLT administration resulted in an increased formation of dense, dehydrated erythrocytes (Table 2; Figure 3).
Because no mice with complete deficiency in erythrocyte band 3 were available for this study, 2 mice heterozygous for band 3 deficiency (band 3+/-) were studied with CLT at dosages of 160 mg/kg twice a day for 48 hours. As in the other mouse strains, band 3+/- animals showed increased cell dehydration and increased cell sodium content with CLT administration (Figure 3).
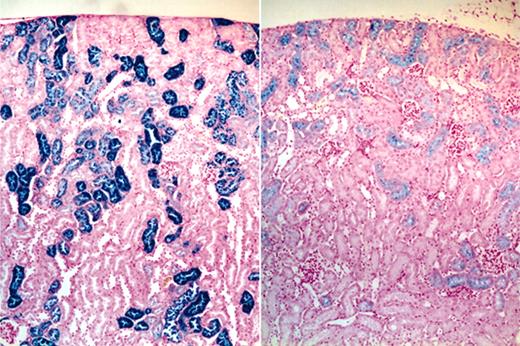
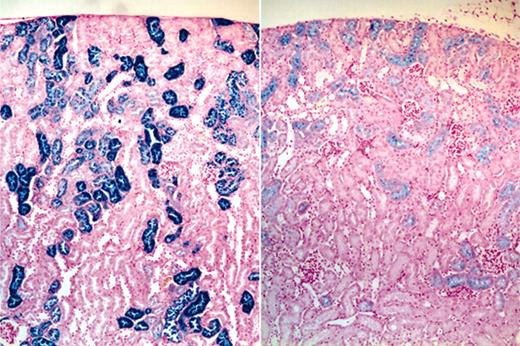
Effects of CLT treatment on liver/spleen and kidney histopathology. Routine histologic analysis of animals that underwent necropsy demonstrated no distinctive features between drug-treated and untreated animals in the liver or spleen in terms of hematoxylin and eosin morphology or in the extent or pattern of distribution of iron staining. By contrast, the kidneys of CLT-treated animals consistently showed a decreased intensity of renal tubular epithelial iron staining; the staining also tended to terminate in more proximal portions of the renal tubules in the drug-treated group (Figure 5). Because our data indicated that intravascular hemolysis was increased by CLT treatment, it is possible that these changes in tissue iron deposition were caused by decreased renal tubular reabsorption of iron in drug-treated animals.
Effects of CLT administration on 4.1-/- mice renal tubular iron accumulation. Micrographs (original magnification, 40 ×) of iron-stained kidney sections of vehicle (left) and CLT-treated (right) 4.1-/- animals demonstrating diminished iron staining in the drug-treated group.
Effects of CLT administration on 4.1-/- mice renal tubular iron accumulation. Micrographs (original magnification, 40 ×) of iron-stained kidney sections of vehicle (left) and CLT-treated (right) 4.1-/- animals demonstrating diminished iron staining in the drug-treated group.
Discussion
We have shown in this report that the Gardos channel plays an important role in modulating the erythrocyte ion content and the hydration state in murine spherocytosis. In vitro studies showed that this channel is functionally up-regulated in 4.1-/- erythrocytes, conferring to 4.1-/- erythrocytes an increased tendency to lose potassium when exposed to conditions resulting in increased intracellular calcium levels. It remains to be established whether this functional up-regulation is specific for 4.1-/- erythrocytes or is a general property of all murine spherocytosis. In vivo experiments were carried out by using specific blockers of the Gardos channel to assess the consequences of a functional blockade of this pathway. Rather than producing cell swelling and an increase in potassium content (as we observed in sickle mice treated with CLT),27 CLT treatment worsened erythrocyte dehydration and increased the number of microspherocytes, suggesting that potassium loss through this channel is crucial in preventing hemolysis when, as a consequence of cytoskeletal instability, membrane surface area is lost. Blockade of the Gardos channel by CLT was associated with signs of increased hemolysis, such as increased LDH, bilirubin, and plasma hemoglobin levels and reticulocyte counts and reduced red cell lifespan. Effects essentially similar to those of CLT were obtained with CDA, a Gardos channel inhibitor devoid of the imidazole moiety, which is responsible for cytochrome P450 inhibition. Therefore, these findings cannot be merely explained by CLT influencing microvesiculation, which occurs throughout the lifespan of 4.1-/- and other defective cytoskeletal erythrocytes. The present data demonstrate for the first time that the Gardos channel plays an important role in balancing the reduction in membrane surface area of HS erythrocytes and ultimately protecting erythrocytes from premature destruction in vivo.
The protective effects of the Gardos channel are not limited to 4.1-/- erythrocytes because they were essentially replicated in other murine cytoskeletal diseases, such as 4.2 (-/-) and band 3 (+/-) deficiencies. This is not the first demonstration of a physiologic role for the otherwise dormant erythrocyte Gardos channel. Halperin et al32,33 showed that in the presence of transient, sublytic complement activation, potassium loss through the Gardos channel was essential in preventing hemolysis caused by colloid-osmotic swelling of the erythrocyte. Ronquist et al34 have recently reported an increased Gardos channel activity in red cells of patients with myopathy and hemolytic anemia resulting from inherited phosphofructokinase (PFK) deficiency. In vitro normal red cells exposed to oxidants or to synthetic prostaglandins (PGE-2) showed abnormal activation of the Gardos channel, resulting in red cell dehydration.35,36
Kidneys of 4.1-/- mice show increased epithelial iron staining, suggestive of chronic intravascular hemolysis, with glomerular filtration of hemoglobin in solution and tubular hemoglobin reabsorption (Figure 5). The marked reduction in iron deposition observed in kidneys of 4.1-/- mice treated with CLT (Figure 5) is an unexpected finding; even assuming that the increased hemolysis caused by CLT treatment is primarily extravascular (splenic), the intraepithelial iron would not be expected to decrease. It is possible that CLT treatment resulted in changes in kidney function or the handling of iron in the kidney tubules. It is also possible that inhibition of the Gardos channel may lead to the formation of microvesicles too large to be filtered through the kidney glomerulus. These effects will have to be further investigated.
In conclusion, 4.1-/- erythrocytes exhibited dehydrated red cells, reduced red cell potassium content, and abnormal Gardos channel activation. In vivo blockade of the Gardos channel is associated with worsening anemia, hemolysis, and erythrocyte fragmentation, indicating that this pathway may play an important role in protecting spherocytic erythrocytes from reaching their critical hemolytic volume. The reported findings imply that potassium and water loss through the Gardos channel may play an important protective role in compensating for the reduced surface membrane area of all forms of HS erythrocytes with various cytoskeletal impairments, thereby reducing hemolysis.
Prepublished online as Blood First Edition Paper, April 26, 2005; DOI 10.1182/blood-2005-01-0368.
Supported by National Institutes of Health grants DK50422, HL64885 (L.L.P.), and HL31579 (N.M.) and by Fondo per gli Investimenti nella Ricerca di Base (FIRB) grant RBNE01XHME-003 (L.D.F.).
An Inside Blood analysis of this article appears in the front of this issue.
The publication costs of this article were defrayed in part by page charge payment. Therefore, and solely to indicate this fact, this article is hereby marked “advertisement” in accordance with 18 U.S.C. section 1734.
We thank Michelle Langlois, Julio Pong, Michelle Rotter, Maria Argos, and Sarah Sheldon for technical assistance.

