Abstract
To study clonal evolution in myeloproliferative disorders, we used stochastic models of hematopoiesis for mouse and cat, species for which the in vivo kinetics of hematopoietic stem cells (HSCs) have been experimentally defined. We determined the consequence if 1 HSC became able to survive without the support of a microenvironmental niche while the rest of its behavior did not change. Neoplastic cells persisted and dominated hematopoiesis in 14% of mice and 17% of cats, requiring mean times of 2.5 ± 0.5 and 7.0 ± 1.2 years, respectively (n = 1000 simulations/species). In both species, when the number of neoplastic HSCs exceeded 0.5% of all HSCs, clonal dominance was inevitable. Our results can explain the absence of clonal myeloproliferative disorders in mice (lifetime, 2 years), are consistent with clinical observations in cats, and provide insight into the progression of chronic myelogenous leukemia (CML) in humans. They also demonstrate that competition for microenvironmental support can lead to the suppression of normal hematopoiesis as neoplasia evolves. Toxic or immunologic suppression of normal HSCs is not required.
Introduction
The human myeloproliferative disorders are a family of diseases that include chronic myelogenous leukemia (CML), polycythemia vera, essential thrombocytosis, and idiopathic myelofibrosis. Although each family member is characterized by increased numbers of specific blood cells, such as granulocytes in CML and red cells in polycythemia vera, all share clinical features, including basophilia, hyperproliferative marrow, slow progression, active hematopoiesis in liver and spleen, and propensity for evolution to acute leukemia.1 These multilineage abnormalities, plus the presence of cytogenetic defects (eg, Philadelphia [Ph] chromosome [bcr-abl translocation] in CML, 20q in polycythemia vera) and skewed X-chromosome inactivation patterns, demonstrate that the diseases result from the neoplastic transformation and clonal expansion of a single hematopoietic stem cell (HSC) or its immediate progeny.1,2 Recent studies showing the presence of a somatic Val617Phe Janus kinase 2 (JAK2) mutation in patients with polycythemia vera, essential thrombocytosis, and idiopathic myelofibrosis document an overlapping molecular pathogenesis (for a review, see Kaushansky3 ).
Although the exact mechanism remains unclear by which neoplastic HSC numbers increase, clonal dominance develops, and normal hematopoiesis is suppressed4-6 , clinical data imply that neoplastic HSCs can survive at geographic sites (ie, liver and spleen) that cannot support normal adult blood cell development. This has led to the presumption that myeloproliferative HSCs ignore the environmental cues that control HSC compartment size during homeostasis.7 It, therefore, seems likely that HSCs in myeloproliferative disorders do not require a marrow microenvironmental niche for survival.
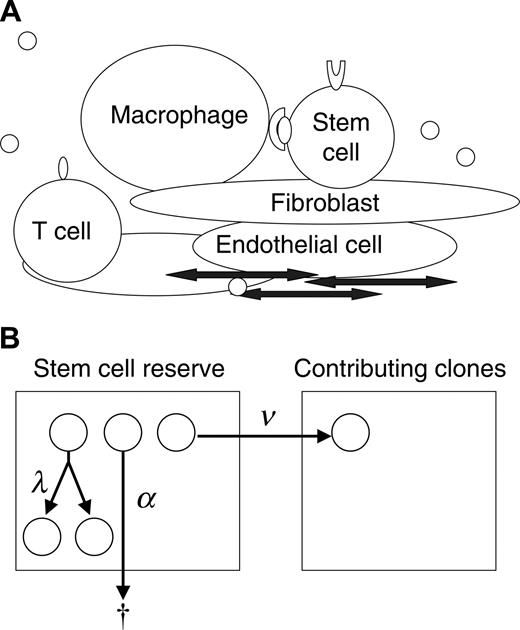
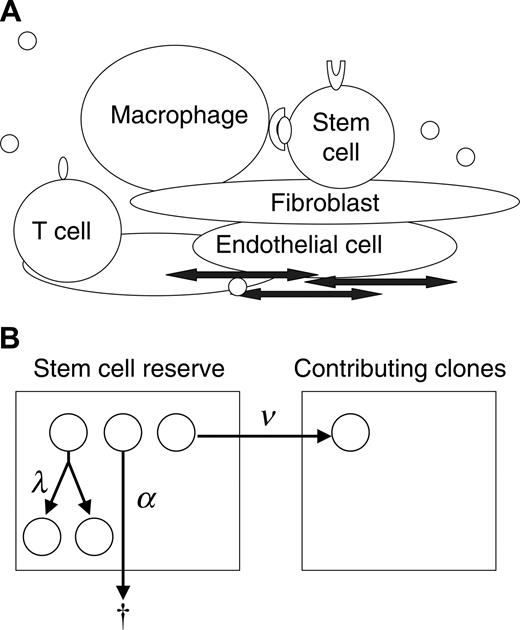
To gain understanding of the progression of the myeloproliferative disorders and the interactions of normal and neoplastic HSCs, we studied this physiology in mouse and cat using simulation and mathematic calculation based on a stochastic model of hematopoiesis. The concept of stochastic differentiation is diagrammed in Figure 1A. Each HSC decides to replicate (self-renew), differentiate, or die (undergo apoptosis) based on its unique intrinsic programming (eg, expression of GATA-2, Hox family proteins, Bmi-1, cell surface receptors, and adhesion determinants) and unique extrinsic (microenvironmental) influences (eg, Wnt, bone morphogenic protein [BMP], sonic hedgehog, notch family members, physical cell-cell interactions).8-11 These interactions are too complex to completely define or quantitate. In addition, the low frequencies and location of the HSCs within the marrow space make direct observation of these cells impossible. Stochastic modeling is an effective method for studying events that cannot be directly observed or quantified. Our approach provides a novel application of stochastic modeling to disease pathogenesis.
Even though the specific fate of individual HSCs cannot be determined, the decisions can be expressed in terms of intensities (Figure 1B). For example, there is a mean time interval (intensity) at which HSCs replicate (termed λ), an intensity of apoptosis (α), and an intensity of differentiation (ν). The hematopoietic system can be completely described with 2 additional parameters, K, the total number of HSCs, and μ, the mean length of time that a clone contributes to blood cell production.Average rates for specified outcomes do not imply or require a particular biologic mechanism (eg, symmetric division, asymmetric division, feedback loop, or age/replication history–dependent decision12-14 ) but rather are properties of the system. This stochastic description of normal hematopoiesis is thus inclusive of all potential molecular and cellular mechanisms.
Data from mice suggest that the size of the HSC compartment (K)is genetically determined,15,16 relatively constant with aging,17,18 and likely reflects the number of supportive microenvironmental niches.9,19 Therefore, when simulating steady state blood cell production, we insert the single assumption that if an HSC replicates when N (the number of HSCs) is greater than or equal to K, one replicant dies. In this report, we determine the consequence should a single neoplastic HSC (and any future progeny of the cell) ignore this constraint. The results provide insight into potential mechanisms of clonal progression and dominance in the myeloproliferative disorders.
Modeling clonal dominance in myeloproliferative disorders. (A) The stem cell microenvironment is a complex cellular network consisting of many cell types, including macrophages, T cells, osteoblasts, endothelial cells, and fibroblasts. These cells modulate stem cell behavior through direct cell-cell interactions and through the secretion of cytokines. In addition, cytokines, chemokines, and other substances transit the marrow sinuses and may concentrate in certain regions (by adherence to extracellular matrix). (B) Depicted is a 2-compartment model for hematopoiesis. The first compartment represents a quiescent pool, or reserve, of stem cells. A cell in the reserve may self-replicate (with intensity, or conditional probability per unit time, λ), die (with intensity α), or initiate differentiation (with intensity ν) by entering the contributing compartment (compartment 2), at which stage cells actively divide and differentiate to contribute progenitor cells (and then mature cells) to marrow (and blood). A clone departing from the contributing compartment is considered to be “exhausted” (which occurs with intensity μ).
Modeling clonal dominance in myeloproliferative disorders. (A) The stem cell microenvironment is a complex cellular network consisting of many cell types, including macrophages, T cells, osteoblasts, endothelial cells, and fibroblasts. These cells modulate stem cell behavior through direct cell-cell interactions and through the secretion of cytokines. In addition, cytokines, chemokines, and other substances transit the marrow sinuses and may concentrate in certain regions (by adherence to extracellular matrix). (B) Depicted is a 2-compartment model for hematopoiesis. The first compartment represents a quiescent pool, or reserve, of stem cells. A cell in the reserve may self-replicate (with intensity, or conditional probability per unit time, λ), die (with intensity α), or initiate differentiation (with intensity ν) by entering the contributing compartment (compartment 2), at which stage cells actively divide and differentiate to contribute progenitor cells (and then mature cells) to marrow (and blood). A clone departing from the contributing compartment is considered to be “exhausted” (which occurs with intensity μ).
Materials and methods
Transformation of an HSC
In our study of myeloproliferative disorders, we assume that a single HSC “transforms” (at time t = 0). Transformed HSCs (and progeny derived by replication events) are insensitive to the environmental cues that limit compartment size to K cells. Therefore, if a transformed HSC replicates when the total number of HSCs (N) is greater than or equal to K, both offspring survive. The intrinsic probabilities (intensities) of HSC replication, apoptosis, differentiation, and (in most analyses) lifespans of differentiating clones are unaffected.
Model parameters
Values for the rate parameters and for the numbers of HSCs per nucleated marrow cells have been estimated by the analysis of limiting dilution competitive repopulation studies in mouse20 and cat,21 and the values for λ, μ, and HSC frequency in mice have been independently confirmed with unrelated methodologies.22-26 K has been estimated by multiplying HSC frequency by the total number of nucleated marrow cells (derived by 59Fe distribution studies), and the value for mouse (11 000-24 000 total HSCs) overlaps the estimate for cat.27
For mouse, the mean lengths of time until each normal and neoplastic HSC replicated, underwent apoptosis, or differentiated were λ = 1 per 2.5, α = 1 per 20, and ν = 1 per 3.4 weeks, respectively, whereas each contributing clone contributed to hematopoiesis for an average of μ = 1 per 6.9 weeks.20 For cat, these values were λ = 1 per 8.3, α = 1 per 50, ν = 1 per 12.5, and μ = 1 per 6.7 weeks.21 K was limited to 10 000 total HSCs (for computational convenience; values as high as 50 000 HSCs minimally affected outcomes [data not shown]).
Simulations
The consequence of HSC transformation was determined in repeated simulations of cat and mouse (n = 8000 per species). Simulations were performed using the C programming language on a Mac OS X operating system and according to the methods of Abkowitz et al.21 Because of the large numbers of neoplastic HSCs, simulations were bounded at total HSC numbers of 200 000 (mouse) and 300 000 (cat) for computational convenience and to ensure that all normal HSCs were exhausted during the time frame of the observations. However, in a few murine simulations, not all normal contributing clones were exhausted by this point, and their subsequent demise was simulated using a pure death process with the parameters described.
Calculating the probabilities of neoplastic HSC survival
Transformed HSCs operate independently of normal HSCs because they are unconstrained by the upper limit on the size of the reserve. Therefore, the probability of transformed HSCs remaining in cat and mouse after the initial transformation event occurred can be estimated by 1 – p0(t), where p0(t) is the probability of extinction in a linear birth-immigration-death process at time t—that is,
The probability of transformed HSCs surviving in the long term is approximated by 1 – p0(∞), where p0(∞) is the probability of ultimate extinction in a linear birth-immigration-death process starting with N0 initial cells—that is,
Results
Survival of neoplastic HSCs
Using simulation and mathematic calculation, we determined the consequence if a single (neoplastic) HSC were able to survive without microenvironmental support and whether this change in HSC behavior was sufficient to explain the clonal progression of myeloproliferative disorders. We assumed that cumulative mutational events resulted in HSC “transformation” (at time t = 0) and caused this HSC and its offspring (derived by replication/self-renewal) to become insensitive to the environmental cues that limit compartment size to K cells. Thus, if a normal HSC replicated when the total number of HSCs was K or larger, one replicant died. However, if a neoplastic HSC replicated when the total number of HSCs was greater than or equal to K, both offspring survived. Conceptually, the extra (neoplastic) HSCs could occupy a niche in spleen or liver that could not support normal HSCs. Other behaviors, including the intrinsic probabilities of HSC replication, apoptosis, and differentiation and the lifespans of differentiating clones, were unaffected.
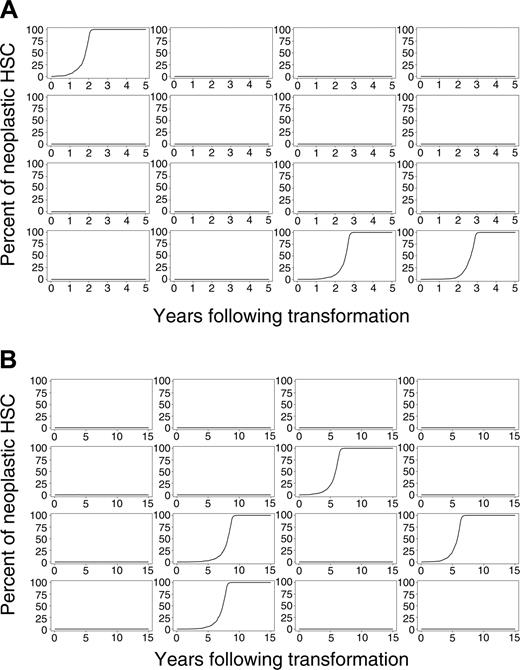
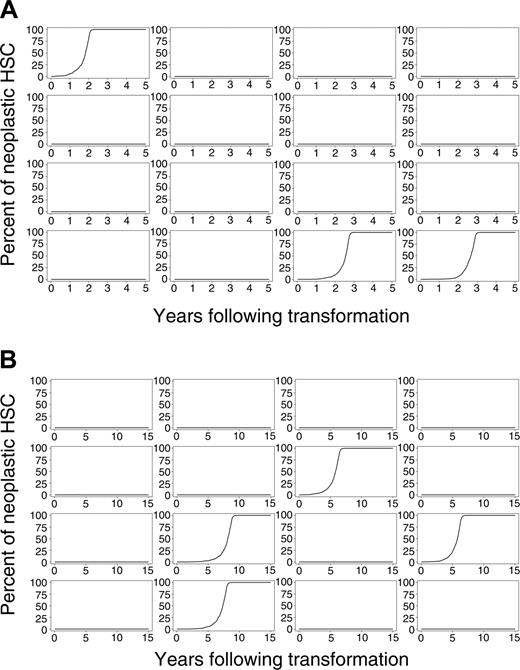
Evolution of neoplasia after initial transformation event. (A) Sixteen simulations of mice and (B) 16 simulations of cats.
Evolution of neoplasia after initial transformation event. (A) Sixteen simulations of mice and (B) 16 simulations of cats.
We simulated this physiology in 8000 virtual mice and 8000 virtual cats. Percentages of neoplastic cells remaining in mouse and cat for a period of 5 (mouse) and 15 (cat) years after the initial transformation event for 16 representative outcomes of mouse and cat are shown in Figure 2A-B. Despite each animal having an identical initial state (1 neoplastic HSC among 10 000 total HSCs), clinical outcomes vastly differed. The neoplastic clone dominated in some animals, yet only small and brief clonal contributions were observed in most virtual mice and cats. In approximately 86% of mice and 83% of cats, the single transformed HSC and its progeny disappeared (refer to equation 1). The time at which the neoplastic clone was exhausted varied between animals and between species (Table 1). In mice, 25% of neoplastic clones were exhausted during the first week after appearance. In cats, 9% were exhausted. These results indicate that transformation events may occur frequently, yet they have no clinical significance should the abnormal clone (by chance) fail to survive or clonally expand.
The results also show that the probability of survival of a neoplastic clone increases as the number of neoplastic HSCs increases. Once the number of neoplastic HSCs increases to 4 (cat) or 5 (mouse), the probability that the neoplastic clone survives is greater than 50% (refer to equation 2). If the number of neoplastic HSCs reaches 0.5% (50 of 10 000) of total HSCs, survival is virtually certain. Estimated probabilities of survival once different proportions of neoplastic HSCs are reached are given in Table 2.
Clonal progression and dominance
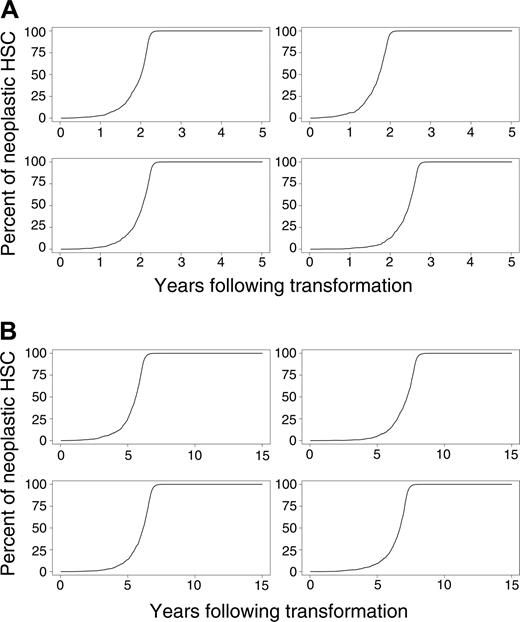
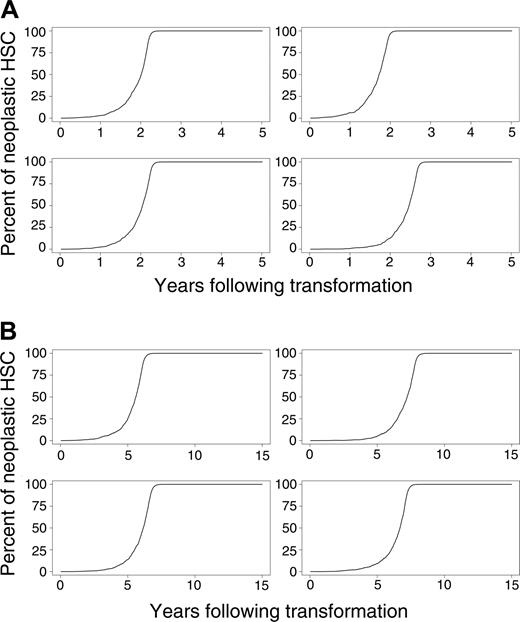
Simulated outcomes (the percentages of differentiating cells derived from the neoplastic clone over time) for 4 randomly selected mice and cats in which the percentage of neoplastic HSCs reaches 1% of total HSCs are shown in Figure 3A-B. As can be seen from these simulations, the rate of disease progression also varies considerably between animals.
To assess the pace of the disease, the first 1000 simulations in which the neoplastic clone eventually dominates (surpassing a level of 50%) were used to estimate means and standard deviations of the time needed to reach various clinical end points (Table 3). In both species, the pace dramatically accelerated when the number of neoplastic HSCs reached 10% of total HSCs. Mean times to clonal dominance were 2.5 ± 0.5 and 7.0 ± 1.2 years in mouse and cat, respectively. Clonal dominance developed more quickly in the virtual mice but required 2 to 3 years from first appearance (Figure 3A), a period longer than a mouse's lifetime.
Effects of compartment 2 kinetics on clinical observations in animals
The preceding calculations determined the numbers and phenotype of neoplastic HSCs within the stem cell reserve (compartment 1). In clinical settings, however, where one is making inferences about stem cell reserve, the contributions of the contributing clones (compartment 2), not the genotype of stem cells, are observed (Figure 1B). There is a minor delay from the time clonal dominance occurs in the reserve until it occurs in the contributing compartment (4-7 weeks in mouse and 3-8 weeks in cat). Typically, there is a wider lag from the time all normal HSCs are exhausted from the reserve until they are exhausted from the contributing compartment. In murine simulations, this lag is an average of 50 ± 21 weeks. In cat simulations, the average lag is 2 ± 16 weeks. This calculation, however, is sensitive to the degree of uncertainty associated with the parameters α and μ.21 Other measurements given in this report are not similarly affected.
More important, contributing clones derived from neoplastic HSCs might have different properties than contributing clones derived from normal HSCs. To determine how this could affect lag time, we considered 2 additional theoretical scenarios and asked what the percentage of neoplastic HSCs (compartment 1 cells) would be at the time that dominance (greater than 50% neoplastic cells) was observed in compartment 2 in these conditions. In simulations in which neoplastic clones behaved normally, on average 71.3% ± 1.9% of murine HSCs were neoplastic when 50% of compartment 2 cells were neoplastic. If neoplastic clones contributed blood cells for 10 times longer than normal clones, on average 37.2% ± 1.9% of murine HSCs were neoplastic when dominance occurred in compartment 2. If neoplastic clones contributed 10 times more blood cells per clone than normal clones (and blood cells, such as granulocytes, were observed as a surrogate measure of compartment 2), on average only 13.0% ± 0.8% of murine HSCs were neoplastic when dominance was clinically observed. In cat, the percentages of neoplastic HSCs when dominance was observed in compartment 2 were 57.3% ± 1.2%, 19.6% ± 1.0%, and 10.4% ± 0.6% in the initial and the 2 additional conditions, respectively. The average lapse between the time dominance occurred in the contributing compartment to the time it occurred among HSCs was 5.9 ± 1.1 weeks (range, 3-11 weeks) in mouse and 47.6 ± 4.0 weeks (range, 37-62 weeks) in cat when contributions of neoplastic clones were 10 times longer than those of normal clones, and they were 24.7 ± 1.9 weeks (range, 19-33 weeks) in mouse and 79.4 ± 5.2 weeks (range, 66-97 weeks) in cat when neoplastic clones contributed 10 times more blood cells than did normal clones. Thus, under the latter 2 scenarios, dominance occurred more quickly among observed cells than among stem cells and would forecast events destined to occur in the HSC compartment.
Evolution of neoplasia where the percentage of neoplastic HSCs reaches 1% or higher. (A) Four murine simulations and (B) 4 cat simulations.
Evolution of neoplasia where the percentage of neoplastic HSCs reaches 1% or higher. (A) Four murine simulations and (B) 4 cat simulations.
Fate of normal HSCs
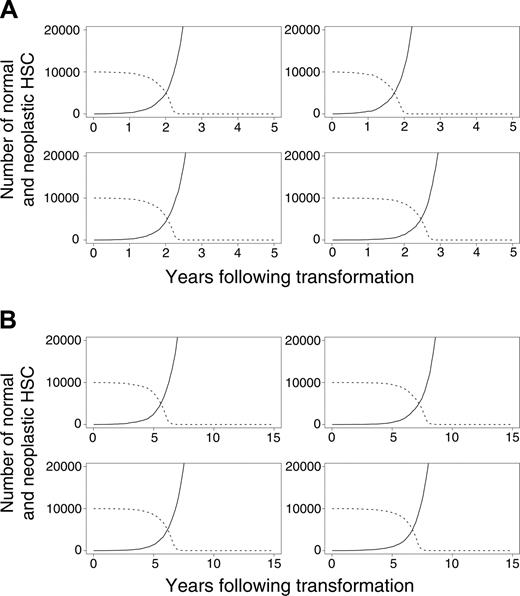
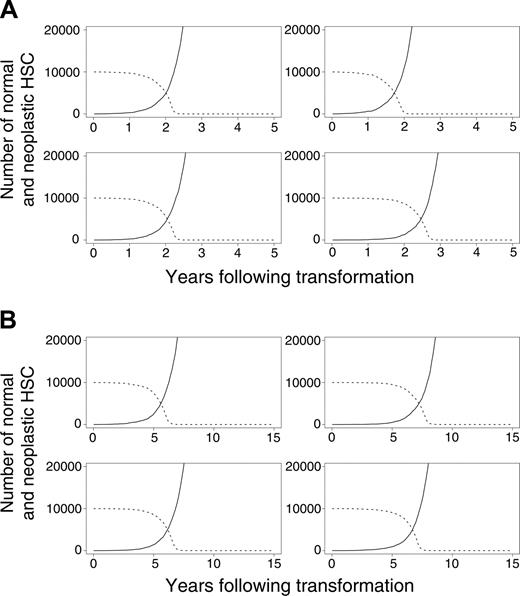
In our initial calculations, we assumed that normal (but not neoplastic) HSCs required microenvironmental support for their survival. This led to the exhaustion of normal HSCs because of excess malignant cells that outcompeted for supportive marrow niches (Figure 4A-B). In additional studies, we explored an alternative mechanism by which the malignant clone might dominate. Specifically, we assumed that neoplastic cells never occupy designated niches but persist within the marrow (and other spaces) without perturbing the survival of normal HSCs. Normal HSCs remain near the upper limit of K, but the neoplastic clone, provided it survives, grows undeterred by resources. Overall results were similar under this alternative hypothesis, indicating that direct competition for limited resources between normal and neoplastic HSCs is not required for neoplastic cells to dominate. This competition is required, however, for the exhaustion of normal HSCs (Figure 4A-B).
In final studies, we evaluated the effect of different constraints on neoplastic HSC growth. We determined outcomes if neoplastic cells could not survive without limitation but could only survive at geographic sites available to all HSCs during fetal development (eg, liver and spleen) and arbitrarily created 10 000 additional sites accessible to neoplastic, but not normal, HSCs. We tested 2 possibilities. The first was that neoplastic HSCs preferentially home to marrow but, when the total number of HSCs reaches K, migrate to spleen or liver. The second was that neoplastic HSCs randomly occupy the available niches in marrow or elsewhere. Under both conditions, results were virtually identical to those shown in Tables 1, 2, and 3. Clonal dominance occurred at similar incidences and within a similar time frame. Thus, normal HSCs are exhausted even when the growth of neoplastic HSCs is constrained.
Discussion
Simulation is a novel approach for understanding the pathogenesis of myeloproliferative diseases. Using stochastic models for mouse and cat hematopoiesis in which one HSC becomes able to survive without the support of a microenvironmental niche, we demonstrated that transformation events can occur often yet have no clinical significance should the neoplastic clone fail to survive. The probability of survival increases as the neoplastic clone expands, and if the number of neoplastic HSCs reaches 0.5% of total HSCs, survival (and eventual clonal dominance) is assured. Still, clonal dominance is predicted in only 14% of mice and 17% of cats.
Evolution of neoplasia where the neoplastic clone eventually dominates. (A) Four murine simulations and (B) 4 cat simulations. (solid lines) Neoplastic HSCs. (dashed lines) Normal HSCs.
Evolution of neoplasia where the neoplastic clone eventually dominates. (A) Four murine simulations and (B) 4 cat simulations. (solid lines) Neoplastic HSCs. (dashed lines) Normal HSCs.
Interestingly, the time from neoplastic transformation until clonal dominance differs in mouse and cat. In virtual cats, clonal dominance took 7.0 ± 1.2 years, a time course of disease progression consistent with observations in clinical veterinary practice.28-30 That clonal dominance in mice required 2 to 3 years, longer than a mouse's lifetime, may explain the absence of experimental murine models in which myeloproliferative disorders develop from a single transformed cell.
Our results prove that clonal dominance (greater than 50% neoplastic), even in large animals such as cats, does not require a direct (or toxic) interaction of neoplastic and normal cells or immune response but can reflect competition for microenvironmental support. Dominance might also develop if the malignant stem cells have an intrinsic advantage in terms of replication, apoptosis, or differentiation intensities.31
Because human HSC parameters have not been determined, the foregoing analyses cannot be extended to humans. However, the results may have conceptual relevance to the development and progression of CML. Others32 have detected low frequencies of bcr-abl translocations in up to 30% of healthy persons using polymerase chain reaction (PCR) assays. Given that the incidence of CML is 1 per 100 000 healthy persons per year, bcr-abl translocations must occur far more frequently than clinical disease does. We hypothesize that competition for geographic niche or microenvironmental support could also explain the disappearance of normal HSCs in these disorders4,5 and could define the long, but not indefinite, window in which therapeutic interventions could restore normal hematopoiesis.
Recent findings of Jamieson et al6 argue that the clinical manifestations of CML progression, such as blast crisis and imatinib mesylate resistance, result from the malignant expansion of granulocyte macrophage–colony-forming unit (CFU-GM)–like subclones, not from relatively quiescent HSCs. Their data suggest that the HSCs present in patients with CML (defined as CD34+, CD38–, CD90+, Thyl+, lineage– cells) are indeed neoplastic (all contain the bcr-abl translocation) yet occur at frequencies similar to the frequencies of HSCs in the marrow of healthy persons. Thus, these results are consistent with the hypothesis that normal and neoplastic HSCs compete for K marrow niches. With the identification of the somatic JAK23 mutation, it is likely that similar data may emerge from comparable studies of the other myeloproliferative disorders.
Stochastic modeling is a powerful and versatile method to study the in vivo behavior of HSCs and the differentiating clones that derive from HSCs. Our data from mathematic calculations and virtual mice and cats argue that the ability of neoplastic HSCs to survive without niche support is sufficient to explain both the clonal progression of myeloproliferative disorders and the disappearance of normal HSCs.
Prepublished online as Blood First Edition Paper, July 7, 2005; DOI 10.1182/blood-2005-03-1240.
Supported by National Institutes of Health grant R01 HL46598.
The publication costs of this article were defrayed in part by page charge payment. Therefore, and solely to indicate this fact, this article is hereby marked “advertisement” in accordance with 18 U.S.C. section 1734.
This work was partially completed while S.N.C. was on sabbatical at the Department of Statistics and Modelling Science at the University of Strathclyde (Glasgow, Scotland).

