Abstract
Major histocompatibility complex class II tetramer staining and activation analysis identified 2 distinct types of antigen-specific CD4+ T cells in the peripheral blood of humans with type 1 (autoimmune) diabetes. T cells with low-avidity recognition of peptide-MHC ligands had low sensitivity to activation and inefficient activation-induced apoptosis. In contrast, high-avidity T cells were highly sensitive to antigen-induced cell death through apoptotic mechanisms, and both apoptosis-resistant high- and low-avidity T cells that survived prolonged tetramer treatment were rendered anergic to restimulation by antigen. In addition, however, apoptosis-resistant high-avidity T cells acquired regulatory features, being able to suppress both antigen-specific and nonspecific CD4+ T-cell responses. This suppression was contact-dependent and correlated with the down-regulation of HLA class II and costimulatory molecules on antigen-presenting cells, including B cells and dendritic cells. T cells face a variety of fates following antigen exposure, including the paradoxic maintenance of high-avidity autoreactive T cells in the peripheral circulation, perhaps due to this capability of acquiring anergic and suppressive properties. Regulation via down-modulation of antigen-presenting cell function, a form of cell-to-cell licensing for suppression, also offers possibilities for the application of peptide-MHC therapeutics. (Blood. 2005;106:2798-2805)
Introduction
β-cell autoimmunity in type 1 diabetes is associated with the presence of both islet antigen (Ag)-specific T cells and autoantibodies, which form the basis for immune prediction and disease-monitoring studies.1,2 Glutamic acid decarboxylase 65 (GAD65) is one of the prevalent islet Ags, and CD4+ T cells targeting its epitopes can be identified and characterized using major histocompatibility complex (MHC) class II tetramers (TMrs).3 TMrs are soluble ligands for the MHC-restricted Ag specificity of the T-cell receptor (TCR), consisting of multimers of recombinant peptide-class II MHC molecules. Analogous to TCR-specific monoclonal antibodies (mAbs), TMrs are also endowed with signaling properties, being capable of activating target T cells and, on prolonged stimulation, of causing activation-induced cell death (AICD).4
This latter outcome represents an appealing therapeutic approach to silence autoreactive T cells and restore tolerance in diabetes.5 MHC-based reagents are therefore being investigated for both immune monitoring and intervention purposes.6 In vivo preclinical models of immunomodulation by peptide-MHC reagents have been reported in a number of animal models of autoimmunity, including experimental allergic encephalomyelitis (EAE)7 and experimental autoimmune myasthenia gravis,8 and in transgenic models of autoimmune diabetes.9,10 Mechanisms at play include AICD,10 anergy,8 T-helper 2 (Th2) immune deviation,11 and induction of interleukin 10 (IL-10)-secreting cells.9,10
One of the key determinants of differential outcomes for both autoimmune and normal T-cell responses is the functional T-cell avidity. The overall T-cell avidity is determined by a number of components, including the intrinsic TCR affinity for the peptide-MHC complex; the expression levels of TCR, CD4, and costimulatory molecules; differential membrane clustering of relevant receptors12 ; and postreceptorial tunable signaling thresholds.13 T-cell avidity provides a mechanism for sensing low- and high-density Ags,12 for determining the hierarchy of epitope spreading,14 for progression of the (auto)immune response,15,16 and for eliminating high-avidity autoreactive T cells through AICD.17 Sufficient T-cell avidity is also crucial for stable binding of MHC class II TMrs, but a significant proportion of autoreactive T cells is selected in the thymus based on low T-cell avidity.18 Therefore, low-avidity T cells can potentially remain undetected by TMr staining and avoid TMr-induced AICD.4 However, AICD is only one of several tolerance mechanisms at work in the periphery, and the relationship between T-cell avidity and the induction of anergy or T regulatory (Treg) polarization is not known.
We tested these various outcomes in GAD-specific CD4+ T cells of high and low avidity from a diabetic patient. MHC class II TMr treatment triggered a gradient of activation and immunomodulatory signals, in which low-avidity T cells were relatively resistant to AICD but acquired an anergic profile. In contrast, high-avidity T cells yielded two populations—one sensitive to AICD and one that expressed not only an anergic phenotype but also additional regulatory properties.
Patient, materials, and methods
MHC class II TMrs
The construction of the expression vectors used to generate soluble biotinylated HLA-DR0404 monomeric molecules has been described elsewhere.19 After loading with peptides, monomers were extensively dialyzed to remove the unbound fraction. The GAD65555-567 epitope (NFFRMVISNPAAT), carrying a 557I substitution to enhance its binding efficiency,3 was used throughout the study. Control TMrs were DR0404 loaded with a mixture of herpes simplex virus 443-455 (FDLEMLGD-VESPS) and influenza virus matrix protein 60-73 (LGFVFTLTVPSERG). All these peptides bind to DR0404 with similar affinities. TMrs were obtained by coupling MHC monomers with phycoerythrin (PE)-labeled streptavidin.19 Staining with TMrs for flow cytometry was performed for 3 hours at 37°C. Saturating concentrations of anti-CD3 mAb (clone UCHT-1; PharMingen/BD, San Diego, CA) were used as positive controls in each assay, determined by titration as the minimal concentrations achieving maximal staining and stimulation. All figures are representative of at least 2 independent experiments on different clones; bar graphs are depicted as mean plus or minus SE of triplicate measurements, unless otherwise indicated.
Derivation of T-cell clones
Peripheral blood mononuclear cells (PBMCs) were obtained from a 17-year-old HLA-DRB1*0404 type 1 diabetic patient 4 years after diagnosis, after informed consent was provided according to the Declaration of Helsinki. Approval for these studies was obtained from the Benaroya Research Institute Institutional Review Board. Cells were expanded in the presence of 10 μg/mL GAD555-567 in RPMI containing 10% pooled human serum for 10 days.3 Cells were subsequently transferred onto wells that had been adsorbed with 8 μg/mL GAD-loaded MHC monomer (HLA-DR 0404) and cultured in the presence of soluble anti-CD28 mAb (1 μg/mL; PharMingen/BD). On day 5, cells were stained with PE-labeled GAD-loaded TMr and fluorochrome-labeled anti-CD25 and anti-CD4 mAbs (PharMingen/BD). CD4+CD25+TMr+ cells were single-cell sorted into 96-well plates using a FACSVantage cell sorter (BD Immunocytometry Systems, San Jose, CA). Clones thus obtained were expanded for 13 days by stimulation with irradiated unmatched PBMCs, 5 μg/mL phytohemagglutinin, and 10 U/mL IL-2 (Chiron, Emeryville, CA). A total of 8 clones (5 with high avidity and 3 with low avidity) were subsequently selected by growth for further expansion and characterization. Four representative clones (2 with high avidity and 2 with low avidity) were finally selected for analysis of regulatory cell function. All T cells were maintained by stimulation at 2-week intervals with GAD555-567-pulsed DR0404+ PBMCs and IL-2 and used at day 10 to 12 after stimulation.
T-cell activation
The irradiated DR0404+ PE117 B-cell line was plated in 96-well round-bottom plates (104 cells/well) and pulsed with GAD555-567 at different concentrations for 2 hours at 37°C. T cells (3 × 10⁴/well) were subsequently added and cocultured for 48 hours, after which 3H-thymidine (3H-TdR) was added (1 μCi [0.037 MBq]/well) for an additional 16 hours before harvesting and counting.
For measurement of interferon γ (IFN-γ), T cells were incubated for 3 hours at 37°C with GAD or control TMr and IFN-γ-secreting cells detected using a fluorescein isothiocyanate (FITC)-labeled capture assay kit (Miltenyi Biotec, Bergisch Gladbach, Germany). For CD69 up-regulation, T cells were incubated with TMrs for 3 hours at 37°C and counterstained with an allophycocyanin-labeled anti-CD69 mAb (PharMingen/BD). The percent increase in CD69+ cells was calculated as (% CD69+ cells - basal % CD69+ cells) divided by (100 - basal % CD69+ cells), where the basal percent CD69+ cells was 53% to 58%.
Apoptosis was evaluated in cells cultured for 12 hours in the presence of GAD or control TMr or anti-CD3 mAb (4 μg/mL). After washing in cold annexin V (Ann-V)-binding buffer,4 cells were stained for 20 minutes on ice with FITC-conjugated Ann-V (PharMingen/BD) along with 1 μg/mL 7-amino actinomycin D (Sigma, St Louis, MO) and analyzed by flow cytometry.
Analysis of regulatory cell function
T cells (0.5-1 × 10⁹) were treated with TMrs as described (see “T-cell activation”) for 24 hours. After treatment, cells were washed in phosphate-buffered saline (PBS) and put back in culture. After resting for 72 hours, cells were washed in Ann-V-binding buffer, stained with Ann-V-cyanin 5 (Cy5; Pharmingen/BD) and the viable fraction sorted, based on both Ann-V- staining and morphology. Sorted GAD TMr-treated and control TMr-treated T cells were plated either alone (3 × 10⁴/well) or together (3 × 10⁴ each/well) and rechallenged on either PE117 DR0404+ B cells (104/well) or dendritic cells (DCs; 0.6-0.3 × 10⁴/well, as indicated). Both types of antigen-presenting cells (APCs) were irradiated and pulsed with 1 μg/mL GAD or control peptide. In some experiments, GAD and control TMr-treated T cells were separated by a Transwell membrane insert (Costar/Corning, Corning, NY). After 48 hours, 50 μL supernatant was removed and used for cytokine measurements using cytometric bead array (PharMingen/BD) and transforming growth factor β1 (TGF-β1) enzymatic immunoassay (Promega, Madison, WI); 1 μCi (0.037 MBq) 3H-TdR was added and incorporation measured after 16 hours and plotted on graphs after subtraction of basal proliferation on control peptide-pulsed APCs.
For phenotypic analysis, sorted T cells were surface stained for CD25, washed, fixed, and permeabilized using Cytofix/Cytoperm (PharMingen/BD) and intracellularly stained for cytotoxic T-lymphocyte antigen 4 (CTLA-4). Western blot analysis of forkhead box P3 (FoxP3) protein expression was performed on sorted Ann-V- T cells (3 × 10⁵), which were washed in PBS, lysed in lysis buffer (25 mM Tris [tris(hydroxymethyl)aminomethane], pH 8.5, 2% lithium dodecyl sulfate, 1 mM EDTA [ethylenediaminetetraacetic acid], 10 mM sodium fluoride, 1 mM sodium orthovanadate, 1 × Complete protease inhibitors (Roche Diagnostics, Indianapolis, IN) and protein content quantified with bicinchoninic acid. Lysates (3-5 μg protein/lane) were separated on 4% to 12% gradient bis-tris gels (Invitrogen, Carlsbad, CA) and transferred to nitrocellulose. Membranes were blocked in Tris-buffered saline/0.1% Tween-20 with 5% nonfat dry milk, probed with a 1:2000 dilution of rabbit anti-FoxP3 antiserum20 overnight at 4°C, and detected by chemiluminescence. For loading controls, blots were stripped and reprobed with an anti-TFIIB antibody (Santa Cruz Biotechnology, Santa Cruz, CA). Positive control lysates were from 293T cells transfected with human FOXP3 cDNA.20 Relative expression levels were measured by volume summation densitometry using ImageQuant (Molecular Dynamics, Sunnyvale, CA).
For Ag-nonspecific suppression assays, a hemagglutinin (HA)307-319-specific T-cell clone (3 × 10⁴/well) was used as responder. DCs (0.3 × 10⁴/well) were pulsed first with 1 μg/mL HA307-319 peptide (PKYVKQNTLKLAT), washed, and pulsed with 1 μg/mL GAD555-567 peptide. T cells were then cultured as described (see “Analysis of regulatory cell function”), either alone (3 × 10⁴/well) or by mixing HA-specific responders (3 × 10⁴/well) at different ratios with control or GAD TMr-treated T cells.
APC conditioning
Monocytes were isolated from DR0404+ healthy donors using CD14 microbeads (Miltenyi Biotec) and immature DCs obtained by culturing CD14+ cells for 7 days in the presence of IL-4 (50 ng/mL) and granulocyte-macrophage colony-stimulating factor (GM-CSF; 5 ng/mL; R&D Systems, Minneapolis, MN). Sorted Ann-V- T cells were incubated with GAD-pulsed B cells or DCs in 96-well plates overnight (T/APC ratio, 3:1) and subsequently stained with the following antibodies: CD80-FITC, HLA-DR-PE, CD3-peridinin chlorophyll protein (PerCP), CD86-allophycocyanin, CD40-FITC, CD83-PE, CD3-PerCP (PharMingen/BD). T cells were gated out by both morphology and CD3 expression and the APC phenotype subsequently analyzed.
Results
GAD-specific T cells display different functional T-cell avidities
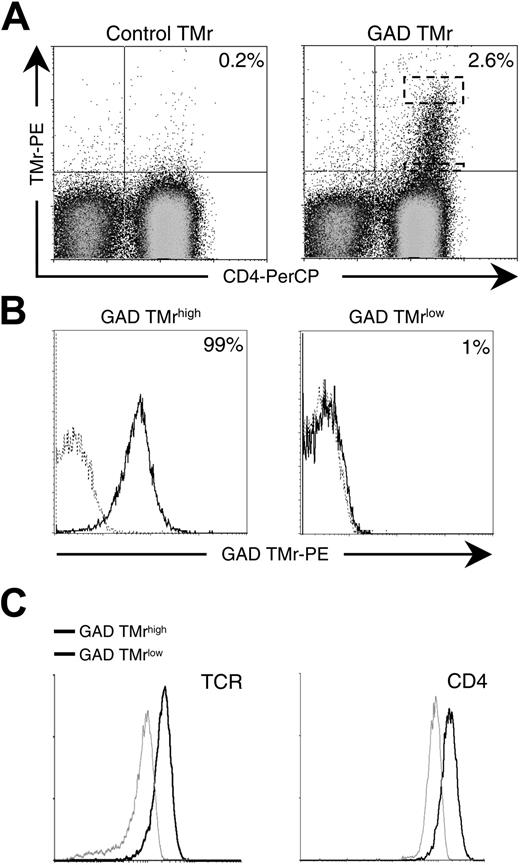
PBMCs from a patient with type 1 diabetes were expanded in vitro by stimulation with a GAD555-567 peptide and by secondary activation on GAD-DR0404 monomers and soluble anti-CD28 mAb. Following these 2 rounds of expansion, a discrete GAD-specific T-cell fraction (2.6% of whole PBMCs) was visualized as a heterogeneous population displaying different degrees of GAD TMr staining (Figure 1A). GAD TMr+ cells at the opposite ends of this avidity spectrum (top and bottom 5% of the upper right quadrant, as shown in Figure 1A) were single-cell sorted and re-expanded in vitro. After sorting, some loss in TMr staining occurred for all T cells on in vitro expansion. Representative T-cell clonal populations obtained are shown in Figure 1B. At the upper end, high-avidity (GAD TMrhigh) T cells were obtained, with 95% or more TMr+ cells. At the lower end, low-avidity (GAD TMrlow) T cells displayed minimal staining (< 5%). A partial contribution to the overall avidity difference between GAD TMrhigh and TMrlow clones was attributable to the different levels of TCR and CD4 expressed (Figure 1C).
GAD-specific T cells display different TCR avidities. (A) PBMCs from a patient with type 1 diabetes were stimulated with 10 μg/mL GAD555-567 peptide for 10 days and subsequently on GAD-loaded plate-bound MHC monomer and soluble anti-CD28 mAb for an additional 5 days. Control and GAD TMr staining of PBMCs after in vitro expansion is shown. Dashed boxes indicate the cytometry gates for high and low tetramer-binding populations. (B) GAD TMrhigh and GAD TMrlow T-cell populations were single-cell sorted from the dashed areas indicated in panel A and further expanded. GAD TMr (black profiles) versus control TMr (dashed profiles) staining of representative clonal populations obtained are shown. Percents of GAD TMr+ cells are indicated. (C) TCR and CD4 expression in GAD TMrhigh (black profiles) and TMrlow (gray profiles) T cells.
GAD-specific T cells display different TCR avidities. (A) PBMCs from a patient with type 1 diabetes were stimulated with 10 μg/mL GAD555-567 peptide for 10 days and subsequently on GAD-loaded plate-bound MHC monomer and soluble anti-CD28 mAb for an additional 5 days. Control and GAD TMr staining of PBMCs after in vitro expansion is shown. Dashed boxes indicate the cytometry gates for high and low tetramer-binding populations. (B) GAD TMrhigh and GAD TMrlow T-cell populations were single-cell sorted from the dashed areas indicated in panel A and further expanded. GAD TMr (black profiles) versus control TMr (dashed profiles) staining of representative clonal populations obtained are shown. Percents of GAD TMr+ cells are indicated. (C) TCR and CD4 expression in GAD TMrhigh (black profiles) and TMrlow (gray profiles) T cells.
Low-avidity T cells are not stained but are activated by GAD-pulsed APCs and soluble GAD TMr. (A) 3H-TdR incorporation was measured on GAD TMrhigh and GAD TMrlow T cells cultured for 60 hours on B cells pulsed with either control peptide (□) or with increasing concentrations of GAD555-567 peptide (▦, ▪). As positive control, anti-CD3 and anti-CD28 mAbs (5 μg/mL each) were added to unpulsed B cells (▧). (B) High-avidity (GAD TMrhigh) and low-avidity (GAD TMrlow) T cells were stimulated with 10 μg/mL GAD (black line) or control (dashed line) TMr for 3 hours at 37°C and IFN-γ secretion measured with a capture assay. Percents of GAD TMr-stimulated IFN-γ+ cells are indicated. (C) T cells were stimulated as described with GAD (▪) or control (□) TMrs and stained with a fluorochrome-conjugated anti-CD69 mAb, and the percent increase in CD69+ cells was calculated. The mean ± SE of 2 independent experiments is shown.
Low-avidity T cells are not stained but are activated by GAD-pulsed APCs and soluble GAD TMr. (A) 3H-TdR incorporation was measured on GAD TMrhigh and GAD TMrlow T cells cultured for 60 hours on B cells pulsed with either control peptide (□) or with increasing concentrations of GAD555-567 peptide (▦, ▪). As positive control, anti-CD3 and anti-CD28 mAbs (5 μg/mL each) were added to unpulsed B cells (▧). (B) High-avidity (GAD TMrhigh) and low-avidity (GAD TMrlow) T cells were stimulated with 10 μg/mL GAD (black line) or control (dashed line) TMr for 3 hours at 37°C and IFN-γ secretion measured with a capture assay. Percents of GAD TMr-stimulated IFN-γ+ cells are indicated. (C) T cells were stimulated as described with GAD (▪) or control (□) TMrs and stained with a fluorochrome-conjugated anti-CD69 mAb, and the percent increase in CD69+ cells was calculated. The mean ± SE of 2 independent experiments is shown.
Despite the low GAD TMr staining of low-avidity T cells, their specificity for GAD was confirmed by the fact that they proliferated in response to GAD-pulsed APCs (Figure 2A). Furthermore, the intensity of GAD TMr staining correlated with the functional T-cell avidity because the dose-dependent proliferative response of GAD TMrlow T cells was lower than that elicited in high-avidity GAD TMrhigh T cells. Stimulation with either control peptide-pulsed or unpulsed APCs did not induce proliferation. The identical proliferative response to saturating anti-CD3 levels of GAD TMrhigh and GAD TMrlow clones (Figure 2A) also indicated that their differential GAD responses were not attributable to their different TCR levels. At high concentrations, both clones responded more to GAD TMr than to anti-CD3, most likely due to the higher efficiency of cross-linking achieved by TMrs as compared to soluble anti-CD3 mAb (approximately 2.6-fold and 1.7-fold, for the high- and the low-avidity clones, respectively).
Low-avidity T cells are not stained but are activated by GAD TMrs
The interaction of MHC class II TMrs with their specific TCR cannot only be visualized as staining, but also can be inferred by the activation elicited on contact; moreover, the requirements for TMr signaling are less stringent than those for TMr binding.4,21 We therefore investigated whether, despite low binding, GAD TMrs could activate T cells of low avidity. To this end, an IFN-γ capture assay was adopted because it allows simultaneous detection of TMr binding and TMr-induced cytokine secretion. Stimulation of high-avidity T cells with GAD TMr for 3 hours induced IFN-γ secretion in all cells, as compared to cells stimulated with control TMr (Figure 2B). All the cells also stained positive with the same GAD TMr reagent, similar to what is shown in Figure 1B. On the other hand, low-avidity T cells were not significantly stained by GAD TMr, but a consistent proportion (∼80%) of cells was induced to produce IFN-γ after stimulation (Figure 2B). As for proliferation on GAD-pulsed APCs (Figure 2A), the degree of activation was proportional to functional T-cell avidity because the IFN-γ response was more robust for high-avidity than for low-avidity T cells. Similar observations were made measuring CD69 up-regulation as a different activation outcome (Figure 2C).
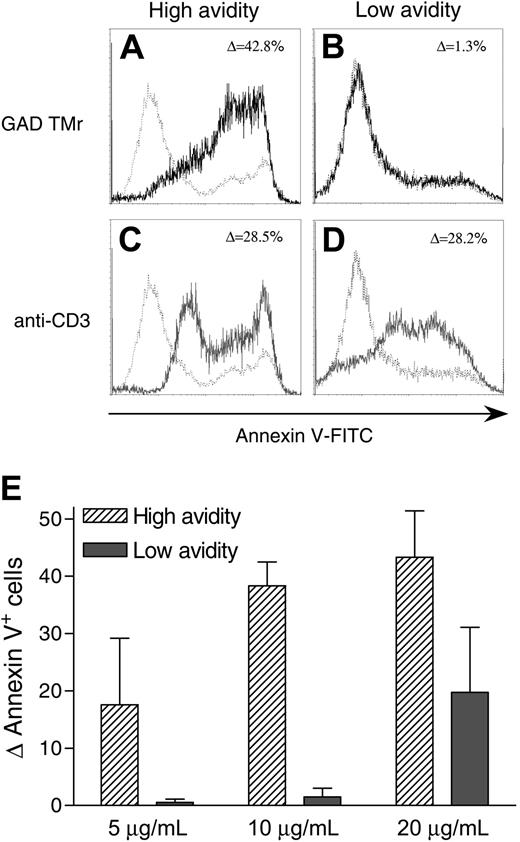
Low-avidity T cells are less susceptible to GAD TMr-induced apoptosis. (A-D) High-avidity (A,C) and low-avidity (B,D) T cells were cultured for 12 hours in the presence of 10 μg/mL GAD TMr (black profiles), 4 μg/mL anti-CD3 mAb (gray profiles), or control TMr (dashed profiles). Ann-V staining profiles are shown and the percent increase in Ann-V+ cells indicated. (E) Percent increase (mean ± SE of 2 independent experiments) in Ann-V+ cells for high- and low-avidity T cells treated at different GAD TMr concentrations.
Low-avidity T cells are less susceptible to GAD TMr-induced apoptosis. (A-D) High-avidity (A,C) and low-avidity (B,D) T cells were cultured for 12 hours in the presence of 10 μg/mL GAD TMr (black profiles), 4 μg/mL anti-CD3 mAb (gray profiles), or control TMr (dashed profiles). Ann-V staining profiles are shown and the percent increase in Ann-V+ cells indicated. (E) Percent increase (mean ± SE of 2 independent experiments) in Ann-V+ cells for high- and low-avidity T cells treated at different GAD TMr concentrations.
Low-avidity T cells are more resistant to GAD TMr-induced apoptosis
We next investigated the sensitivity of T cells to AICD following GAD TMr treatment. Prolonged incubation (12 hours) with GAD TMrs (10 μg/mL) led to a consistent apoptotic effect in high-avidity T cells, with about 40% of the cells becoming Ann-V+ (Figure 3A). Low-avidity T cells displayed a marked resistance to this effect, with no significant increase in the apoptotic fraction as compared to T cells either treated with a control TMr or left untreated (Figure 3B). The observed difference between high- and low-avidity T cells was not due to variability in their intrinsic susceptibility to AICD, but rather to their different T-cell avidities, because prolonged Ag-independent stimulation with an anti-CD3 mAb achieved similar effects in all T cells (Figure 3C-D). Higher GAD TMr concentrations (20 μg/mL) were not more effective in high-avidity T cells, but induced some apoptosis in low-avidity ones (Figure 3E).
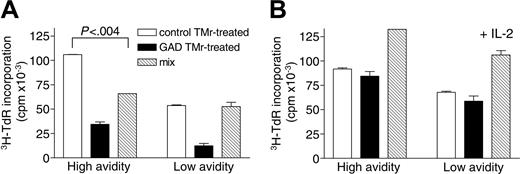
Apoptosis-resistant high- and low-avidity T cells become similarly anergic but acquire differential suppressive properties on GAD TMr treatment. Following 24 hours of treatment with control or GAD TMrs and resting for 72 hours, viable (Ann-V-) T cells were sorted and rechallenged on GAD-pulsed B cells (1 × 10⁴/well), in the absence (A) or presence (B) of IL-2 (10 U/mL). Control and GAD TMr-treated fractions from high- and low-avidity T cells were cultured either separately (3 × 10⁴/well; □ and ▪, respectively) or mixed together (3 × 10⁴ each/well; ▧). 3H-TdR incorporation after 60 hours of culture is shown. P for the comparison between control TMr-treated and mix conditions, as calculated by 2-tailed Student t test, is indicated in panel A. Data are mean ± SE.
Apoptosis-resistant high- and low-avidity T cells become similarly anergic but acquire differential suppressive properties on GAD TMr treatment. Following 24 hours of treatment with control or GAD TMrs and resting for 72 hours, viable (Ann-V-) T cells were sorted and rechallenged on GAD-pulsed B cells (1 × 10⁴/well), in the absence (A) or presence (B) of IL-2 (10 U/mL). Control and GAD TMr-treated fractions from high- and low-avidity T cells were cultured either separately (3 × 10⁴/well; □ and ▪, respectively) or mixed together (3 × 10⁴ each/well; ▧). 3H-TdR incorporation after 60 hours of culture is shown. P for the comparison between control TMr-treated and mix conditions, as calculated by 2-tailed Student t test, is indicated in panel A. Data are mean ± SE.
Apoptosis-resistant high- and low-avidity T cells become similarly anergic but acquire differential suppressive properties on GAD TMr treatment
Following apoptosis induction with GAD TMr, a variable fraction of both high- and low-avidity T cells remained viable (Figure 3). We investigated whether this apoptosis-resistant fraction acquired novel characteristics on TMr treatment. To this end, large numbers of T cells were obtained by in vitro expansion and treated for 24 hours with control or GAD TMrs, washed, and replated in culture for an additional 72 hours without any further stimulation. By 72 hours, TCR surface expression was back to comparable levels between stimulated and unstimulated cells (data not shown). At the end of this resting period, viable (Ann-V-) fractions were sorted and tested for their ability to respond to rechallenge and to exert suppressive activity, using GAD-pulsed B cells as APCs. As shown in Figure 4A, both high- and low-avidity T cells, which had been previously treated with GAD TMr, were similarly hyporesponsive to restimulation as compared to control TMr-treated (as well as untreated) cells. IL-2 production was also abolished in GAD TMr-treated hyporesponsive T cells (data not shown).
When GAD and control TMr-treated T cells were added together, the total level of proliferation was not additive but rather decreased, as compared to the 2 fractions taken separately. This small suppressive effect was seen only for high-avidity T cells (Figure 4A). Both hyporesponsiveness and suppression were abolished when the same experiment was performed in the presence of IL-2 (10 U/mL); GAD and control TMr-treated T cells proliferated similarly and, when added together, displayed additive proliferation levels (Figure 4B).
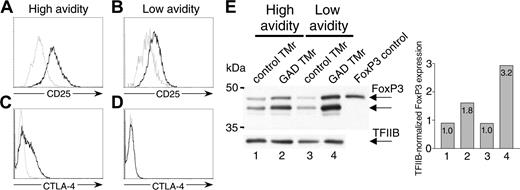
The phenotype of GAD TMr-treated anergic T cells was further characterized (Figure 5). CD25 expression was higher in GAD TMr-treated fractions for both high- and low-avidity T cells, but more so for the high-avidity cells (Figure 5A-B). CTLA-4 expression was up-regulated only in the GAD TMr-treated fraction of high-avidity T cells (Figure 5C-D). FoxP3 protein levels were increased 2- to 3-fold in the GAD TMr-treated fractions in T cells of both avidities (Figure 5E). Human FoxP3 protein migrated as a doublet, as previously observed20 ; one of these 2 bands comigrated with the control protein expressed in 293T cells transfected with a human FOXP3 cDNA. Whereas there was a detectable basal FOXP3 expression that was similar in T cells of either avidity, the increase following GAD TMr stimulation was higher for low-avidity T cells.
Suppression by GAD TMr-treated apoptosis-resistant high-avidity T cells is cell contact-dependent and acts through APC-negative conditioning
Recall and suppression assays on TMr-treated Ann-V- T cells were repeated using DCs as APCs (Figure 6). Also in this case, both high- and low-avidity GAD TMr-treated Ann-V- T cells displayed lower proliferation as compared to cells that had been treated with control TMr (Figure 6A). Whereas the total level of proliferation of the 2 T-cell fractions mixed together was additive for low-avidity T cells, it was not so for high-avidity T cells. This suppressive effect of high-avidity T cells was effective at different T/DC ratios (Figure 6B).
Phenotype of GAD TMr-treated anergic T cells. (A-D) Ann-V- high- and low-avidity T cells were sorted after TMr treatment and analyzed for CD25 and CTLA-4 expression by flow cytometry. Profiles of control and GAD TMr-treated T cells are shown in gray and black, respectively. (E) Western blot of FoxP3 expression in high- and low-avidity T cells. The membrane was probed with an anti-FoxP3 antiserum (top) and subsequently with an anti-TFIIB Ab (bottom) to verify equal loading of lanes. The band obtained from FoxP3-transfected 293T cells is shown as control in the last lane. Bar graph shows densitometric analysis of FoxP3 bands normalized to TFIIB bands detected in each lane.
Phenotype of GAD TMr-treated anergic T cells. (A-D) Ann-V- high- and low-avidity T cells were sorted after TMr treatment and analyzed for CD25 and CTLA-4 expression by flow cytometry. Profiles of control and GAD TMr-treated T cells are shown in gray and black, respectively. (E) Western blot of FoxP3 expression in high- and low-avidity T cells. The membrane was probed with an anti-FoxP3 antiserum (top) and subsequently with an anti-TFIIB Ab (bottom) to verify equal loading of lanes. The band obtained from FoxP3-transfected 293T cells is shown as control in the last lane. Bar graph shows densitometric analysis of FoxP3 bands normalized to TFIIB bands detected in each lane.
Moreover, Transwell experiments demonstrated that the mechanism at play was contact-dependent (Figure 6C); GAD TMr-treated high-avidity T cells had a suppressive effect only when in contact with control TMr-treated counterparts, whereas this effect was abolished when the 2 fractions were separated by a Transwell insert. In agreement with this contact-dependent mechanism, production of the regulatory cytokines IL-10 and TGF-β1, as well as IL-4, was not enhanced, but rather decreased, following GAD TMr treatment in both high- and low-avidity T-cells (data not shown), ruling out suppression mediated by T regulatory 1 (Tr1) or Th2 polarization.
Suppression by GAD TMr-treated apoptosis-resistant high-avidity T cells is dependent on cell contact. (A) Ann-V- T cells were sorted after control (□) or GAD TMr (▪) treatment and rechallenged on GAD-pulsed DCs (T/DC, 5:1), either alone (□ and ▪) or mixed together (▧). P for the comparison between control TMr-treated and mix conditions, as calculated by 2-tailed Student t test, is indicated. (B) Ann-V- high-avidity T cells rechallenged as described at different T/DC ratios. (C) Ann-V- high-avidity T cells were rechallenged as described (T/DC ratio, 10:1), with the cocultured control and GAD TMr-treated fractions (▧) either kept in contact or separated by a Transwell membrane, as indicated. 3H-TdR incorporation after 60 hours of culture is shown. Data are mean ± SE.
Suppression by GAD TMr-treated apoptosis-resistant high-avidity T cells is dependent on cell contact. (A) Ann-V- T cells were sorted after control (□) or GAD TMr (▪) treatment and rechallenged on GAD-pulsed DCs (T/DC, 5:1), either alone (□ and ▪) or mixed together (▧). P for the comparison between control TMr-treated and mix conditions, as calculated by 2-tailed Student t test, is indicated. (B) Ann-V- high-avidity T cells rechallenged as described at different T/DC ratios. (C) Ann-V- high-avidity T cells were rechallenged as described (T/DC ratio, 10:1), with the cocultured control and GAD TMr-treated fractions (▧) either kept in contact or separated by a Transwell membrane, as indicated. 3H-TdR incorporation after 60 hours of culture is shown. Data are mean ± SE.
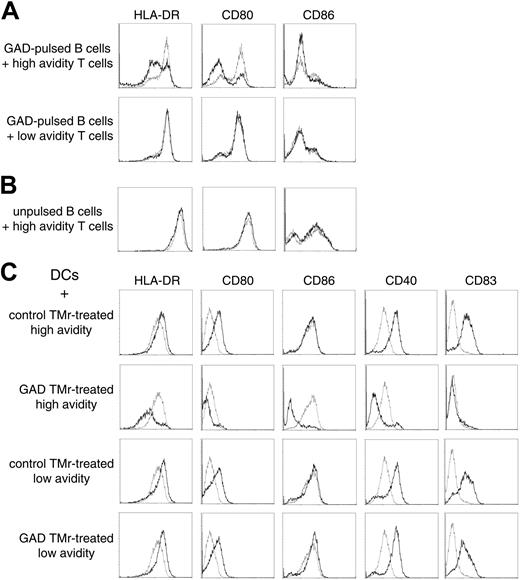
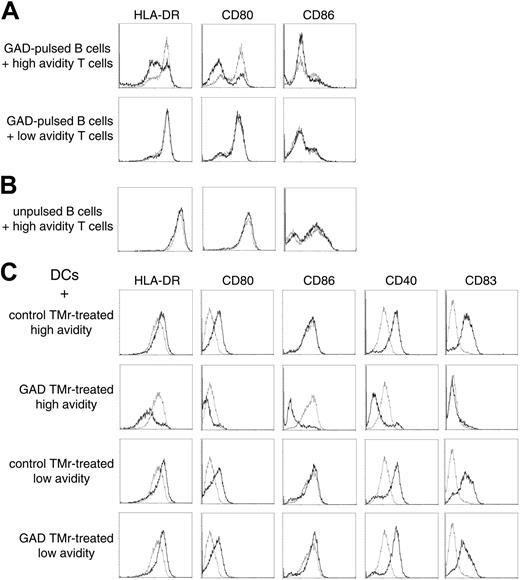
We hypothesized that suppression could be acting through a negative signal delivered through APC-T-cell rather than T-T-cell contact. Indeed, when GAD-pulsed B cells were incubated for 12 hours with high-avidity Ann-V- T cells previously treated with the GAD TMr, down-regulation of HLA-DR and of the CD80 (B7.1) and CD86 (B7.2) costimulatory molecules was observed, as compared with B cells that had either been cultured alone or cocultured with control TMr-treated Ann-V- T cells (Figure 7A). In contrast, low-avidity T cells previously treated with either TMr had no effect on B cells. The down-regulatory effect observed with the high-avidity cells required their activation because the same experiment performed with unpulsed B cells did not show any effect (Figure 7B).
Similar observations were repeated using DCs as APCs (Figure 7C). Differently from B cells, DCs can be induced to mature on cognate contact with newly activated T cells.22 Indeed, when control TMr-treated Ann-V- high-avidity T cells were cultured on GAD-pulsed DCs, they became activated (as demonstrated by
3H-TdR incorporation; Figure 6) and subsequently induced the maturation of DCs, as shown by the up-regulation of HLA-DR, of the costimulatory molecules CD80 and CD40, and of the maturation marker CD83 (Figure 7C first row). No significant CD86 up-regulation was induced. In sharp contrast, the same Ann-V- high-avidity T cells, which had been treated with GAD TMr, not only failed to induce DC maturation, but further down-regulated the expression of all of the mentioned molecules, including CD86 (Figure 7C second row). Low-avidity Ann-V- T cells were instead capable of inducing maturation of DCs regardless of the previous TMr treatment (Figure 7C third and fourth row). The larger difference in the HLA-DR and costimulation display between negatively conditioned and matured DCs as compared to B cells incubated with different T cells (Figure 7) correlated with the higher suppressive activity observed when DCs rather than B cells were used as APCs (Figures 4 and 6).
Suppression by GAD TMr-treated apoptosis-resistant high-avidity T cells is Ag-nonspecific and is effective at different suppressor-responder ratios
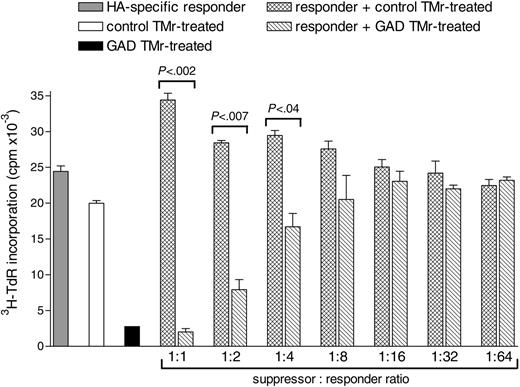
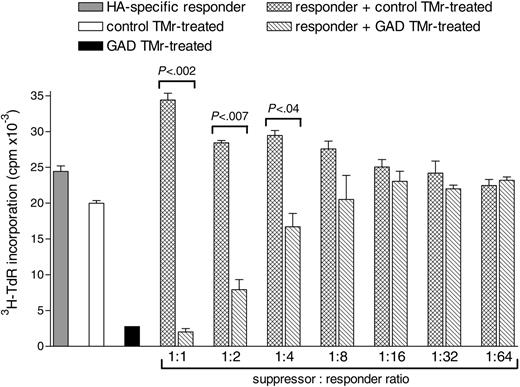
We next investigated whether GAD TMr-treated apoptosis-resistant high-avidity T cells could suppress the proliferation of T cells with a different specificity. For this analysis, an HA307-319-specific T-cell clone was selected as responder and cultured alone or in the presence of different numbers of either GAD or control TMr-treated high-avidity Ann-V- T cells (1:1 to 1:64 suppressor-responder ratios), using DCs pulsed with both the HA and the GAD peptide as APCs (Figure 8). Coculturing of HA-specific responders with control TMr-treated T cells gave additive levels of proliferation over a range of suppressor-responder ratios, as compared to the 2 populations cultured alone. On the other hand, a suppressive effect was observed when the same HA responders were cocultured with anergic GAD TMr-treated T cells. This suppressive effect maintained statistical significance for suppressor-responder ratios as low as 1:4. Thus, the regulatory properties of GAD TMr-treated apoptosis-resistant high-avidity T cells suppress not only T cells responding to the GAD epitope, but also bystander T cells of different specificity.
APC conditioning by high- and low-avidity T cells. (A) GAD-pulsed B cells were incubated for 12 hours with sorted Ann-V- high- or low-avidity T cells that had been previously treated with either control TMr (dashed lines) or GAD TMr (black lines). B cells were subsequently gated and analyzed by flow cytometry. (B) The same experiment was performed with unpulsed B cells. (C) GAD-pulsed DCs were incubated as described with sorted Ann-V- high- or low-avidity T cells that had been previously treated with either control or GAD TMr, as indicated. Flow cytometry analysis of gated DCs incubated with the indicated T cells (black lines) is shown in comparison with gated DCs cultured alone (dashed lines).
APC conditioning by high- and low-avidity T cells. (A) GAD-pulsed B cells were incubated for 12 hours with sorted Ann-V- high- or low-avidity T cells that had been previously treated with either control TMr (dashed lines) or GAD TMr (black lines). B cells were subsequently gated and analyzed by flow cytometry. (B) The same experiment was performed with unpulsed B cells. (C) GAD-pulsed DCs were incubated as described with sorted Ann-V- high- or low-avidity T cells that had been previously treated with either control or GAD TMr, as indicated. Flow cytometry analysis of gated DCs incubated with the indicated T cells (black lines) is shown in comparison with gated DCs cultured alone (dashed lines).
Discussion
Both high- and low-avidity T cells specific for the same foreign or self Ags coexist in the peripheral blood of healthy subjects19,23 and of patients with type 1 diabetes.18 Using direct binding of soluble peptide-MHC tetramers, we were able to isolate distinct high- and low-avidity CD4+ T cells with the same autoantigen specificity, in which functional avidity, as evaluated by several activation responses, correlated with the intensity of GAD TMr staining. As expected, low-avidity T cells were less susceptible to AICD, presumably contributing to their persistence in vivo, and anergy could be promptly induced in both high- and low-avidity populations surviving AICD. Notably, cells within the high-avidity pool, which did not undergo AICD, acquired not only an anergic, but also a regulatory phenotype. This regulation was characterized, in part, by a type of conditioning in which APCs were down-regulated by contact with the high-avidity T cells and displayed a subsequent suppressive phenotype that was Ag-nonselective.
Suppression by GAD TMr-treated apoptosis-resistant high-avidity T-cells is Ag-nonspecific and is effective at different suppressor-responder ratios. HA-specific responder T cells and control or GAD TMr-treated Ann-V- high-avidity T cells were cultured on HA/GAD-pulsed DCs either alone (▦, □, and ▪, respectively) or mixed together as indicated ( and ▧ at different ratios, maintaining the number of HA-specific responders constant. P values for the indicated comparisons are shown, as calculated by 2-tailed Student t test. Data are mean ± SE.
Suppression by GAD TMr-treated apoptosis-resistant high-avidity T-cells is Ag-nonspecific and is effective at different suppressor-responder ratios. HA-specific responder T cells and control or GAD TMr-treated Ann-V- high-avidity T cells were cultured on HA/GAD-pulsed DCs either alone (▦, □, and ▪, respectively) or mixed together as indicated ( and ▧ at different ratios, maintaining the number of HA-specific responders constant. P values for the indicated comparisons are shown, as calculated by 2-tailed Student t test. Data are mean ± SE.
In animal models, T cells have been shown to undergo “avidity maturation” during immune responses, in which low-avidity T cells are more abundant at earlier stages, whereas high-avidity T cells are progressively enriched.15 Avidity maturation has been documented in the progression from insulitis to diabetes in nonobese diabetic mice16 ; however, the relative contribution of high- and low-avidity cells to pathogenesis or regulation is not known. Several in vitro and in vivo models have suggested that Ag-specific stimulation of T cells can be exploited to induce therapeutically advantageous outcomes in pathogenic T cells. Such stimulation induces a first phase of expansion, followed by AICD of the majority of responding T cells. However, there usually remains a fraction of apoptosis-resistant T cells that becomes unresponsive24-27 and, in some cases, acquires suppressive activity or IL-10 secretion or both.10,28
Stimulation of T cells with GAD TMrs deletes a substantial proportion of cells by AICD. Because low-avidity T cells are less sensitive to Ag-specific activation, they are also less sensitive to the cell death induced by such activation.4 These observations have 2 implications. (1) They suggest that low-avidity T cells could have a survival advantage in chronic autoimmune pathology, being more likely to escape AICD; however, this prediction would be at variance with the avidity maturation model.15,16 (2) They suggest that low-avidity T cells would be relatively unaffected by TMr treatment, possibly leading to an only partial therapeutic effect. AICD is not the only peripheral tolerance mechanism and, although TMr-induced apoptosis is an avidity-dependent effect,4 the same rule does not apply to TMr-induced anergy, where this effect is similarly induced regardless of the functional T-cell avidity. However, the additional acquisition of regulatory features in our study preferentially involved high-avidity T cells. This suggests that quantitative differences in signals may have importance also in the induction of anergic/suppressor phenotypes. Indeed, different levels of T-cell anergy have been shown to be induced by different strengths of stimulation29 ; low strength stimulation can induce hyporesponsiveness but not suppressive properties, as is the case for low-avidity T cells. Signals of higher intensity are effective at inducing both hyporesponsiveness and suppression, as observed for high-avidity T cells.
The degree of anergy and suppression observed in our experiments was sometimes incomplete, possibly reflecting the presence of a population mixed with normally responding effector cells. However, at least a fraction of GAD TMr-treated Ann-V- high-avidity T cells was rendered anergic and suppressive. The CD25high CTLA-4+ phenotype and IL-2-reversible, contact-dependent suppression resemble those of naturally occurring CD4+CD25+ Treg cells. Although it is generally accepted that naturally occurring CD4+CD25+ Treg cells act through T-T-cell contact,30,31 some reports suggest that an additional APC-T-cell contact component might be at play.32-34 Suppression through APC-T-cell contact has also been observed for anergic T cells in earlier reports,35-38 although the difference between these cells and Treg cells might only be semantic, reflecting changes in nomenclature. APC-T-cell contact-dependent suppression has been shown to act through inhibition of DC maturation,32-34,37,38 similar to what we observed in our system. Lack of suppression of an HA-specific response when GAD TMr-treated Ann-V- high-avidity T cells were substituted with control TMr-treated ones in the mixed wells ruled out a mechanism of mere competition for limited APC resources. As for naturally occurring CD4+CD25+ Treg cells, the nature of the molecular interaction responsible for the observed contact-dependent suppression remains elusive. In our system, the regulatory effect was not mediated by CTLA-4 nor by Fas ligand, because blocking of these 2 molecules with specific mAbs did not inhibit suppression. Moreover, surface-bound TGF-β1 expression did not differ between anergic high- and low-avidity T cells (data not shown). The Treg phenotype as well as the suppressive potency observed here are similar to those we described on activation of human CD4+CD25- T cells,20,39 and generation of both effector and regulatory populations might be part of any immune response. FOXP3 up-regulation on GAD TMr treatment was found in both high- and low-avidity anergic T cells and was higher in low-avidity cells. This observation may suggest a possible role for FOXP3 independent of suppression in the maintenance of the anergic state.40-43 Alternatively, and unlike what has been described in the mouse,42,43 FOXP3 expression might simply reflect the recent activation of GAD TMr-treated T cells.20,44 The fact that some basal FOXP3 expression was detectable in the T-cell clonal populations used (which had been previously expanded in vitro) is consistent with this hypothesis. Indeed, T-cell clones and lines of different specificities have been found to express FOXP3 regardless of their suppressive activity.44 Moreover, we and others have repeatedly observed faint bands for FoxP3 expression by Western blot following activation of purified peripheral blood CD4+CD25- T cells.39,45
The avidity-dependent gradient of tolerogenic responses we describe here may be a general physiologic mechanism rather than being limited to autoreactive T cells. Nonetheless, this mechanism could be therapeutically enhanced to silence autoreactive T cells. Indeed, the rationale of MHC-based therapeutics is to boost physiologic peripheral tolerance mechanisms. This is conceptually analogous to current Ag-nonspecific therapies using OKT3γ1 (AlaAla), a nonactivating humanized form of anti-CD3 mAb, a treatment that led to transient improvement in β-cell function in new-onset type 1 diabetes.46 The effect is likely achieved through a combination of AICD, Th2 polarization with IL-10 production,46,47 or induction of TGF-β-secreting CD4+CD25+ Treg cells.5,48,49 Several in vitro and mouse in vivo studies with MHC class II reagents suggest the feasibility of a similar approach, in which multimers are used to target only discrete Ag-responsive T cells—a much higher degree of specificity compared to use of anti-CD3 mAbs.9,10,50 AICD, anergy, and active regulatory mechanisms induced by MHC-based reagents could synergize to quench pathogenic T cells.6 A functional imbalance between autoreactive pathogenic and regulatory T cells, with a predominance of the former, is increasingly observed in autoimmunity.51-53 If this is the case, immune interventions could either aim at selectively eliminating pathogenic T cells through AICD and anergy or at broadly potentiating regulatory mechanisms. Concomitant deletion of pathogenic T cells and Ag-specific induction of Treg cells with broad suppressive properties through peptide-MHC multimers may provide a mechanism to exploit both of these opportunities in a selective way. The potential of self-Ag-specific Treg cells in blocking autoimmune diabetes by suppression of polyclonal autoreactive pathogenic T cells has been recently documented in the nonobese diabetic mouse model.45,54 Ag-specific induction of Treg cells could maximize the therapeutic potential of these cells by selectively delivering generalized suppression to the disease site expressing the target Ag.
These studies also underscore the challenges for monitoring autoreactive CD4+ T cells in patients with autoimmune disease. Functional assays reflect a balance between activation, anergy, and regulation, and therefore reveal little about the details of each. TMr-binding assays identify high-avidity cells but are inefficient by themselves at detecting low-avidity populations, which are likely the dominant players at early stages of autoimmunity.15,16 In our study, T cells of low avidity (GAD TMrlow), which can easily escape detection by TMr staining, can instead be identified by measuring GAD TMr-induced activation outcomes. A readout of functional interaction (ie, GAD TMr-induced activation) combined with that of a structural interaction (ie, GAD TMr binding) could therefore increase the sensitivity of detection for low-avidity T cells. A similar observation has been reported in an EAE model, where TMrs containing a myelin proteolipid epitope induced Ca2+ release in a fraction of T cells larger than that identified by TMr staining.55 Most likely, a combination of binding and functional assays will be most informative for patient monitoring and will be required to assess whether the presence of regulatory, high-avidity T cells is predictive for particular clinical outcomes.
Prepublished online as Blood First Edition Paper, July 19, 2005; DOI 10.1182/blood-2004-12-4848.
Supported by grants from the American Diabetes Association and the Juvenile Diabetes Research Foundation and by grant P01 DK 53004 from the National Institutes of Health. R.M. was recipient of a mentor-based Postdoctoral Fellowship Award from the American Diabetes Association.
The publication costs of this article were defrayed in part by page charge payment. Therefore, and solely to indicate this fact, this article is hereby marked “advertisement” in accordance with 18 U.S.C. section 1734.





 and ▧ at different ratios, maintaining the number of HA-specific responders constant. P values for the indicated comparisons are shown, as calculated by 2-tailed Student t test. Data are mean ± SE.