Abstract
The lifespan of circulating red blood cells (RBCs) produced in bone marrow is determined by their elimination through phagocytosis by splenic macrophages. The mechanism by which RBC elimination is regulated has remained unclear, however. The surface glycoprotein SHPS-1, a member of the immunoglobulin superfamily, is abundant in macrophages. We have now examined the regulation of RBC turnover with the use of mice that express a mutant form of SHPS-1 lacking most of its cytoplasmic region. The mutant mice manifested mild anemia as well as splenomegaly characterized by expansion of the red pulp. The numbers of erythroid precursor cells in the spleen and of circulating reticulocytes were also increased in the mutant mice. In contrast, the half-life of circulating RBCs was reduced in these animals, and the rate of clearance of injected opsonized RBCs from the peripheral circulation was increased in association with their incorporation into splenic macrophages. Phagocytosis of opsonized RBCs by splenic macrophages from mutant mice in vitro was also increased compared with that observed with wild-type macrophages. These results suggest that SHPS-1 negatively regulates the phagocytosis of RBCs by splenic macrophages, thereby determining both the lifespan of individual RBCs and the number of circulating erythrocytes.
Introduction
The lifespan of circulating red blood cells (RBCs) is approximately 120 and 40 days in humans and mice, respectively, and is determined by their production in bone marrow (BM) and their clearance from the peripheral circulation, predominantly in the spleen and liver.1-3 The production of RBCs is controlled by the primary erythropoietic regulator erythropoietin,2,4 whereas clearance of old RBCs by the spleen is achieved mostly as a result of their specific recognition and phagocytosis by splenic macrophages.5,6 The precise molecular mechanism by which splenic macrophages recognize senescent RBCs for phagocytosis is largely unknown, however.1-3
Src homology 2 domain-containing protein tyrosine phosphatase substrate-1 (SHPS-1),7,8 also known as signal-regulatory protein α,9 brain immunoglobulin (Ig)-like molecule with tyrosine-based activation motifs,10 and p84 neural adhesion molecule,11 is a transmembrane protein that is especially abundant in macrophages.12-14 The putative extracellular region of SHPS-1 comprises 3 Ig-like domains, and its cytoplasmic region contains 4 tyrosine phosphorylation sites that mediate the binding of Src homology 2 domain-containing protein tyrosine phosphatases designated SHP-1 and SHP-2.7,9 Tyrosine phosphorylation of SHPS-1 is regulated by various growth factors and cytokines as well as by integrin-mediated cell adhesion to extracellular matrix proteins.7,9,15-18 SHPS-1 thus functions as a docking protein to recruit and activate SHP-1 or SHP-2 at the cell membrane in response to extracellular stimuli. In macrophages, tyrosine-phosphorylated SHPS-1 binds SHP-1,12,19,20 which is implicated in negative regulation of the functions of a variety of hematopoietic cells.21-23 The complex of SHPS-1 and SHP-1 is thus thought to regulate macrophage functions in a negative manner.
CD47 is a ligand for the extracellular region of SHPS-1.24,25 This protein, which was originally identified in association with αvβ3 integrin, is also a member of the Ig superfamily, possessing an Ig-V-like extracellular domain, 5 putative membrane-spanning segments, and a short cytoplasmic tail.26 CD47 and SHPS-1 constitute a cell-cell communication system (the CD47-SHPS-1 system) that plays important roles in a variety of cellular processes including cell migration,27,28 adhesion of B cells,29 and T-cell activation.14,30 In addition, the CD47-SHPS-1 system is implicated in negative regulation of phagocytosis by macrophages. CD47 is highly expressed on the surface of RBCs, where it associates with the Rh protein complex instead of with integrins.31 The rate of clearance of CD47-deficient RBCs from the bloodstream was found to be markedly increased compared with that of wild-type (WT) cells.6,32 Furthermore, the phagocytosis of CD47-deficient RBCs by splenic or BM-derived macrophages was greatly enhanced in an in vitro assay.6,32 In addition, the phagocytic response is enhanced in “motheaten variable” mice, in which the activity of SHP-1 is reduced compared with that apparent in WT mice.32 Together, these observations suggest that the interaction of CD47 (on RBCs) with SHPS-1 (on macrophages) inhibits the phagocytosis of the former cells by the latter in a manner dependent on SHP-1. It has remained unclear, however, whether SHPS-1 indeed participates in such negative regulation of phagocytosis in macrophages. Moreover, the molecular mechanism whereby the binding of CD47 to SHPS-1 might inhibit phagocytosis by these cells is unknown.
We previously generated mice that express a mutant version of SHPS-1 that lacks most of the cytoplasmic region of the protein.33,34 This mutant protein does not undergo tyrosine phosphorylation nor does it form a complex with SHP-1 or SHP-2. Furthermore, the abundance of the mutant protein in cells of the mutant mice is markedly reduced compared with that of the full-length protein in cells of WT mice. We recently showed that peritoneal macrophages from the mutant mice phagocytose RBCs more effectively than do those from WT animals.35 With the use of these SHPS-1 mutant mice, we have now investigated the role of SHPS-1 in regulation of RBC turnover and its molecular mechanism.
Materials and methods
Antibodies and reagents
Hybridoma cells producing the rat P84 monoclonal antibody (mAb) to SHPS-1 were kindly provided by C. F. Lagenaur (University of Pittsburgh, Pittsburgh, PA). Rabbit polyclonal antibodies (pAbs) to SHPS-1 were obtained from ProSci (Poway, CA). Normal rat IgG, Cy3-conjugated goat antibodies to rat IgG, and horseradish peroxidase-conjugated secondary antibodies were from Jackson Immunoresearch Laboratories (West Grove, PA). A phycoerythrin (PE)-conjugated rat mAb to mouse CD71, a PE-conjugated rat mAb to mouse Gr-1 (Ly-6G and Ly-6C), a biotin-conjugated mouse IgG to trinitrophenol (TNP), and fluorescein isothiocyanate (FITC)-conjugated streptavidin were from BD PharMingen (San Jose, CA). Rabbit pAbs to mouse RBCs were from Cedarlane (Hornby, ON, Canada). A rat mAb to Fcγ receptor III/II (2.4G2) was prepared from the culture supernatant of hybridoma cells. A PE-conjugated rat mAb to F4/80 and a biotin-conjugated rat mAb to F4/80 were obtained from Caltag Laboratories (Burlingame, CA). Alexa 647-conjugated streptavidin was kindly provided by S. Hirose (Juntendo University, Tokyo, Japan). An FITC-conjugated rat mAb to mouse Ter-119, an FITC-conjugated rat IgG to TNP, and a PE-conjugated rat IgG to TNP were from eBioscience (San Diego, CA). Collagenase for tissue digestion was obtained from Wako Pure Chemical Industries (Tokyo, Japan), 7-amino-actinomycin D (7-AAD) was from Beckman Coulter (Marseille, France), and 5-(and-6)-carboxyfluorescein diacetate succinimydyl ester (CFSE) was from Molecular Probes (Eugene, OR).
Animals
The generation of mice that express a mutant version of SHPS-1 that lacks most of the cytoplasmic region was described previously.33 Mice were bred and maintained in the Institute of Experimental Animal Research of Gunma University under specific pathogen-free conditions. The mice were backcrossed onto the C57BL/6N background for 5 generations. Female mice were used for all experiments unless otherwise indicated.
Histologic and immunofluorescence analyses of the spleen
The spleen was fixed in 4% paraformaldehyde in phosphate-buffered saline (PBS), embedded in paraffin, sectioned, and stained with Mayer hematoxylin-eosin as described.34 The presence and localization of hemosiderin were determined by staining with Berlin blue. Immunohistofluorescence analysis was performed essentially as described.36 Conventional fluorescence images were obtained with an AX-70 microscope equipped with epifluorescence optics (Olympus, Tokyo, Japan). Microscopic images were recorded with a cooled charge-coupled device camera (PXL 1400; Photometrics, Tucson, AZ) and analyzed with IPLab Spectrum software (Scanalytics, Vienna, VA).
Preparation and counting of splenocytes
Splenocytes were prepared as described by gentle grinding of the spleen with autoclaved frosted glass slides in PBS.37 The numbers of mononuclear cells and RBCs in the spleen were counted with a Burker-Turk counting chamber (Erma, Tokyo, Japan).
Determination of surface expression of SHPS-1 on F4/80-positive splenic macrophages
To examine the surface expression of SHPS-1 on F4/80-positive splenic macrophages, splenocytes were obtained as described38 with minor modification. The surface expression of SHPS-1 on F4/80-positive splenic macrophages was thereafter examined by flow cytometry as described.39 In brief, cells (1 × 10⁶) were incubated for 30 minutes on ice with rat mAb 2.4G2 to the Fcγ receptor (1 μg/mL), washed 3 times with ice-cold PBS, and incubated for 30 minutes on ice with biotinylated P84 mAb to SHPS-1 (1 μg/mL) and a PE-conjugated mAb to F4/80 (0.3 μg/mL). The cells were then incubated with FITC-conjugated streptavidin (0.2 μg/mL) and analyzed by 2-color flow cytometry with a FACSCalibur instrument (Becton Dickinson, Franklin Lakes, NJ) and CellQuest software (Becton Dickinson).
Peripheral-blood analysis
Peripheral-blood samples were obtained from the retro-orbital plexus of anesthetized mice. The peripheral-blood cell counts were then analyzed with an Advia 120 hematology system (Bayer Medical, Tarrytown, NY). Serum iron and the unsaturated iron binding capacity (UIBC) were also measured with a Clinical Analyzer 7180 (Hitachi Science Systems, Hitachi, Japan). Serum erythropoietin concentration was measured with an enzyme-linked immunosorbent assay (ELISA) kit for mouse erythropoietin (R&D Systems, Minneapolis, MN).
Quantification of myeloid and erythroid cells in BM
BM was flushed from femurs with PBS, and BM cells were then suspended in PBS. The number of BM cells per femur was first determined with a Burker-Turk counting chamber. Cells (1 × 10⁶) were then incubated for 30 minutes on ice with a PE-conjugated rat mAb to mouse Gr-1 (10 ng/mL) and an FITC-conjugated rat mAb to mouse Ter-119 (0.5 μg/mL). After washing 3 times with PBS, the cells were analyzed by flow cytometry. Mature RBCs (with low forward scatter and low side scatter) were excluded from analysis.
Quantification of erythroid precursors in the spleen
Quantification of erythroid precursors in the spleen was performed as described.40 In brief, freshly isolated splenocytes (1 × 10⁶) were washed with ice-cold PBS, incubated for 30 minutes on ice with an FITC-conjugated rat mAb to mouse Ter-119 (1 μg/mL), washed with ice-cold PBS, and incubated for 30 minutes on ice with a PE-conjugated rat mAb to CD71 (0.2 μg/mL). After 3 washes with ice-cold PBS, the cells were incubated with 7-AAD (0.4 μg/mL) for 30 minutes at room temperature to identify dead cells (7-AAD positive), suspended in PBS, and analyzed by 3-color flow cytometry. Dead cells (7-AAD positive) and mature RBCs (with low forward scatter and low side scatter) were excluded from analysis.
Preparation of opsonized RBCs
In vivo clearance of RBCs
In vivo clearance of RBCs was determined as described previously6,32 with minor modifications. In brief, RBCs from WT or SHPS-1 mutant mice were labeled with CFSE, washed 3 times with sterile PBS, and resuspended (at a density of 1 × 10⁹ cells in 250 μL) in sterile PBS. Mice were injected intravenously with the CFSE-labeled RBCs (IgG-opsonized or unopsonized), and blood samples (5 μL) were collected from a tail vein at the indicated times thereafter and subjected to analysis by flow cytometry. The fraction of fluorescent RBCs per total number of recipient RBCs (100 000/sample) was determined.
Assay of RBC uptake by F4/80-positive splenocytes in vivo
CFSE-labeled RBCs were opsonized with pAbs to mouse RBCs as described in “Preparation of opsonized RBCs.” Recipient mice were injected intravenously with the RBCs and the spleen was removed 8 hours thereafter. Splenocytes were isolated and stained with a biotin-conjugated mAb to F4/80 and subsequently incubated with PE-conjugated streptavidin. After washing 3 times with PBS, the cells were incubated with 7-AAD (0.4 μg/mL) for 30 minutes at room temperature to identify dead cells. F4/80-positive splenic macrophages that had ingested CFSE-labeled RBCs were then detected by 3-color flow cytometry.
In vitro assay of phagocytosis
Splenic macrophages were isolated as described previously.6 Splenic macrophages were allowed to adhere to the dish for 16 hours at 37°C, after which IgG-opsonized RBCs from WT mice (3 × 10⁸ cells in 8 mL of RPMI-1640 supplemented with 10% fetal bovine serum) were overlaid on the adherent cells. After incubation for the indicated times, the cells were washed with PBS. Phagocytosis was detected by phase-contrast light microscopy and quantified as a phagocytic index (the percentage of macrophages that had engulfed RBCs, determined by scoring of 100 cells per field).
Statistical analysis
Data are presented as means plus or minus SE. Statistical analysis was performed by Student t test with the use of Stat View 5.0 software (SAS Institute, Cary, NC). A P value of less than .05 was considered statistically significant.
Results
SHPS-1 mutant mice manifest anemia and splenomegaly
To investigate the role of SHPS-1 in regulation of RBC turnover, we backcrossed mice of mixed C57BL/6 × 129Sv genetic background that were heterozygous for a mutant SHPS-1 allele33,34 to the C57BL/6 background for 5 generations. The resulting WT and homozygous mutant littermates were used in the present study.
We first examined expression of the mutant SHPS-1 protein in lysates of splenocytes by immunoblot analysis (Supplemental Figure S1, available at the Blood website; click on the Supplemental Materials link at the top of the online article). We confirmed that the mutant SHPS-1 protein indeed lacked most of the cytoplasmic region of SHPS-1 and that abundance of the mutant SHPS-1 protein was also markedly reduced compared with that of the WT protein in splenocytes, as previously shown in peritoneal macrophages.34,35 The amounts of SHP-1 and SHP-2 in splenocytes from the SHPS-1 mutant mice were similar to those in splenocytes from WT animals (data not shown).
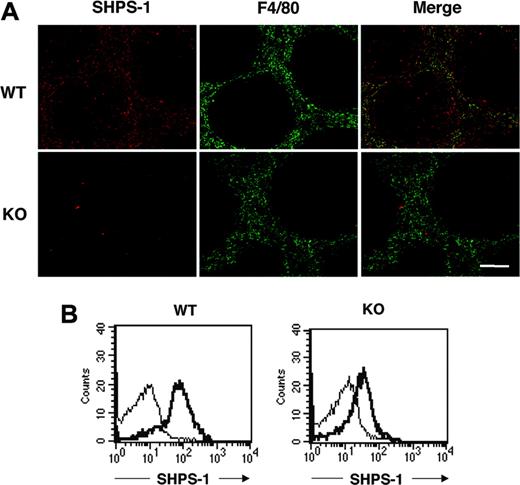
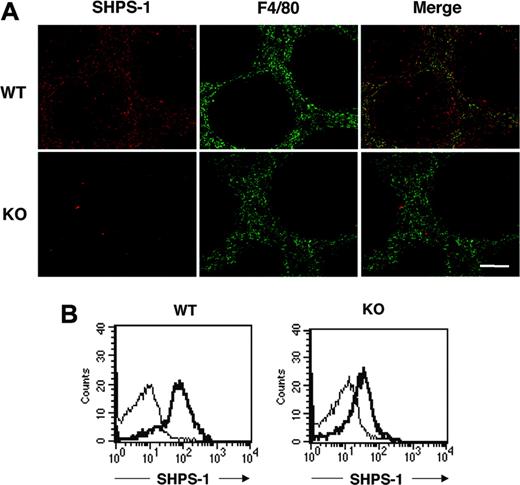
SHPS-1 was previously shown to be abundant in macrophages.12-14 The spleen contains different types of macrophages, however, with each type residing in a specific region of the spleen and having a distinct function.41,42 Most macrophages positive for the F4/80 antigen, which are thought to be responsible for phagocytosis and digestion of circulating RBCs,5,6 are thus present in the red pulp area. Immunohistofluorescence analysis of the spleen from WT mice with the P84 mAb revealed that SHPS-1 immunoreactivity was largely restricted to the red pulp area, where staining for F4/80 was also detected (Figure 1A), suggesting that SHPS-1 is expressed in F4/80-positive macrophages. SHPS-1 immunoreactivity was also detected in the white pulp, however. Immunoreactivity for SHPS-1 in both red and white pulp areas was markedly reduced in the spleen of mutant mice (Figure 1A).
We further examined the expression of SHPS-1 on F4/80-positive splenic macrophages by 2-color flow cytometric analysis with the P84 mAb and a mAb to F4/80. SHPS-1 immunoreactivity was indeed detected on the surface of F4/80-positive splenic macrophages from WT mice, and the abundance of SHPS-1 was substantially reduced on the surface of F4/80-positive splenic macrophages from SHPS-1 mutant mice (Figure 1B).
We have previously shown that the SHPS-1 mutant mice at 4 weeks of age manifest thrombocytopenia.34 We confirmed this observation again by analysis of peripheral-blood cell counts for the homozygous mutant mice and their WT littermates used in this study at 4 weeks of age (Supplemental Table S1). In addition, the number of circulating RBCs as well as the hemoglobin content and hematocrit in the female (but not male) mutant animals at 4 weeks was reduced by approximately 7% compared with that in age-matched WT littermates. By contrast, analysis of the homozygous mutant mice and their WT littermates at 6 or 13 weeks of age revealed that the number of circulating RBCs in the mutant animals at both ages was reduced by approximately 5% to 10% compared with that in sex- and age-matched WT littermates (Supplemental Table S1). Similarly, the hemoglobin content and hematocrit were reduced by approximately 7% to 12%, whereas the number of reticulocytes was increased by approximately 22% to 45% in the SHPS-1 mutant mice. Microscopic examination showed that circulating RBCs from the mutant mice were morphologically normal and did not exhibit fragmentation (Supplemental Figure S2). Furthermore, Coombs test was negative for the mutant animals at 6 weeks of age (data not shown), suggesting that immune-mediated intravascular hemolysis does not occur. The amount of iron in serum was decreased and the UIBC was increased in the mutant mice at 13 weeks of age compared with WT littermates; both values were similar in WT and mutant mice at 6 weeks of age (Supplemental Table S1).
Expression of a mutant form of SHPS-1 that lacks most of the cytoplasmic region in splenocytes. (A) Frozen spleen sections from WT or SHPS-1 mutant (KO) mice at 6 weeks of age were stained both with the P84 mAb to SHPS-1 (red) and with a mAb to F4/80 (green). The SHPS-1 and F4/80 images are also shown merged. Scale bar, 100 μm. Images were visualized using an AX-70 microscope equipped with a 10×/0.4 objective lens (Olympus, Tokyo, Japan) and a PXL 1400 camera (Photometrics, Tucson, AZ). Images were analyzed with IPLab Spectrum software (Scanalytics, Fairfax, VA) and were processed with Adobe Photoshop 8.0 software (Adobe Systems, San Jose, CA). (B) Splenocytes prepared from WT and SHPS-1 mutant mice at 6 weeks of age were stained with a PE-conjugated mAb to F4/80 and biotinylated mAb P84 (thick trace) or with isotype control mAbs (thin trace) and were then incubated with FITC-conjugated streptavidin. The expression of SHPS-1 on F4/80-positive splenic macrophages was then examined by 2-color flow cytometric analysis. All results are representative of 3 separate experiments.
Expression of a mutant form of SHPS-1 that lacks most of the cytoplasmic region in splenocytes. (A) Frozen spleen sections from WT or SHPS-1 mutant (KO) mice at 6 weeks of age were stained both with the P84 mAb to SHPS-1 (red) and with a mAb to F4/80 (green). The SHPS-1 and F4/80 images are also shown merged. Scale bar, 100 μm. Images were visualized using an AX-70 microscope equipped with a 10×/0.4 objective lens (Olympus, Tokyo, Japan) and a PXL 1400 camera (Photometrics, Tucson, AZ). Images were analyzed with IPLab Spectrum software (Scanalytics, Fairfax, VA) and were processed with Adobe Photoshop 8.0 software (Adobe Systems, San Jose, CA). (B) Splenocytes prepared from WT and SHPS-1 mutant mice at 6 weeks of age were stained with a PE-conjugated mAb to F4/80 and biotinylated mAb P84 (thick trace) or with isotype control mAbs (thin trace) and were then incubated with FITC-conjugated streptavidin. The expression of SHPS-1 on F4/80-positive splenic macrophages was then examined by 2-color flow cytometric analysis. All results are representative of 3 separate experiments.
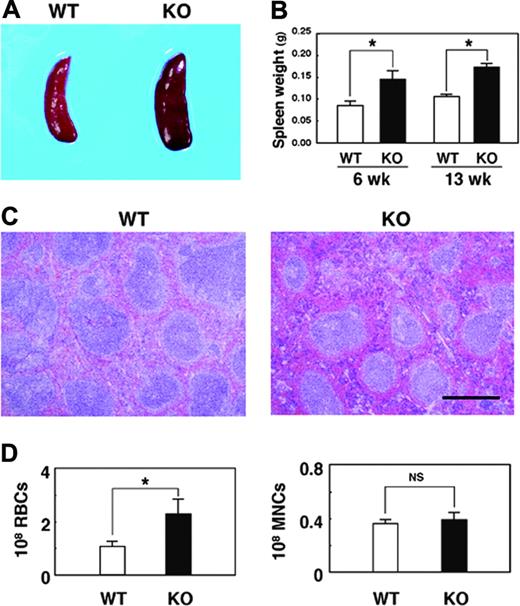
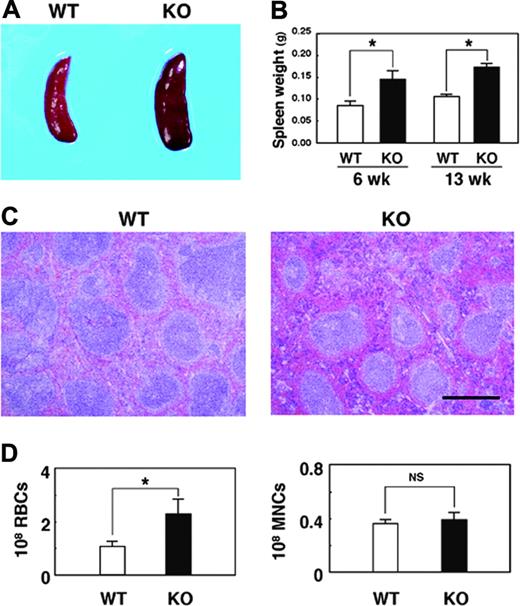
We also found that the SHPS-1 mutant mice manifested mild splenomegaly (Figure 2A). At either 6 or 13 weeks of age, the weight of the spleen of the mutant mice was approximately 1.5 times that apparent for WT animals (Figure 2B). By contrast, the weight of the body, liver, or kidney at 6 weeks of age did not differ substantially between WT and SHPS-1 mutant mice (data not shown). Histologic analysis revealed that the red pulp was markedly expanded in the spleen of SHPS-1 mutant mice compared with that of WT mice (Figure 2C). In addition, the intensity of staining with eosin, which reflects the number of RBCs, was greatly increased in the red pulp of SHPS-1 mutant mice compared with that of WT mice (Figure 2C). Indeed, the number of RBCs present in the spleen of the mutant mice was increased about 2-fold relative to that apparent for WT animals, whereas the number of mononuclear cells was unaltered (Figure 2D). The color of the enlarged spleen of SHPS-1 mutant mice was also a darker red than that of the WT spleen (Figure 2A), possibly as a result of the expanded red pulp area and increased number of RBCs. These data suggest that the splenomegaly of SHPS-1 mutant mice is attributable, at least in part, to the increased number of RBCs and consequent expansion of the red pulp.
Macroscopic and microscopic analyses of the spleen of SHPS-1 mutant mice. (A) Spleens of WT and homozygous SHPS-1 mutant (KO) mice at 7 weeks of age. (B) Weight of the spleen of WT and SHPS-1 mutant mice at 6 or 13 weeks of age. Data are means ± SE of values from 5 mice of each group. *P < .05. (C) The spleen of WT or SHPS-1 mutant mice at 6 weeks of age was fixed and stained with Mayer hematoxylin-eosin. Data are representative of 3 independent experiments. Scale bar, 0.5 mm. Images were visualized using a BX50 microscope equipped with a 4×/0.16 objective lens (Olympus), captured with a DP70 camera (Olympus) and analyzed with Adobe Photoshop 8.0 software (Adobe Systems). (D) The numbers of RBCs and mononuclear cells (MNCs) in the spleen of WT or SHPS-1 mutant mice at 6 weeks of age were counted. Data are means ± SE of values from 5 mice of each genotype. NS indicates not significant; *P < .05.
Macroscopic and microscopic analyses of the spleen of SHPS-1 mutant mice. (A) Spleens of WT and homozygous SHPS-1 mutant (KO) mice at 7 weeks of age. (B) Weight of the spleen of WT and SHPS-1 mutant mice at 6 or 13 weeks of age. Data are means ± SE of values from 5 mice of each group. *P < .05. (C) The spleen of WT or SHPS-1 mutant mice at 6 weeks of age was fixed and stained with Mayer hematoxylin-eosin. Data are representative of 3 independent experiments. Scale bar, 0.5 mm. Images were visualized using a BX50 microscope equipped with a 4×/0.16 objective lens (Olympus), captured with a DP70 camera (Olympus) and analyzed with Adobe Photoshop 8.0 software (Adobe Systems). (D) The numbers of RBCs and mononuclear cells (MNCs) in the spleen of WT or SHPS-1 mutant mice at 6 weeks of age were counted. Data are means ± SE of values from 5 mice of each genotype. NS indicates not significant; *P < .05.
Erythropoiesis in the BM and spleen of SHPS-1 mutant mice
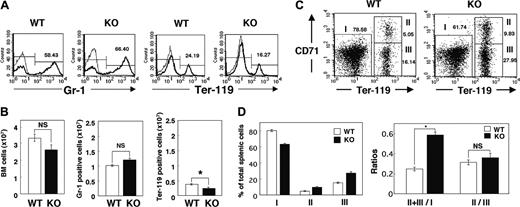
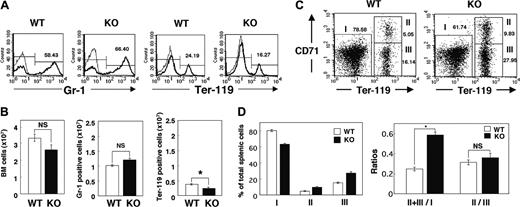
The increased number of reticulocytes in the peripheral blood of SHPS-1 mutant mice suggested that the anemia apparent in these animals was not the result of impaired proliferation or maturation of the erythroblast-erythrocyte lineage. Rather, the proliferation of erythroid precursor cells might be enhanced to compensate for the anemia of the mutant mice. We examined the numbers of myeloid and erythroid cells in BM by determination of the numbers of cells positive for Gr-1 (myeloid differentiation antigen) or Ter-119 (erythroid-specific antigen), respectively, as described previously.43 The total cell number and the number of Gr-1-positive myeloid cells in BM did not differ substantially between WT and SHPS-1 mutant mice (Figure 3A-B). In contrast, the cell number of Ter-119-positive erythroid cells in BM was decreased in SHPS-1 mutant mice compared with those of WT mice (Figure 3A-B).
The increase in erythropoiesis induced by erythropoietin in rodents occurs predominantly in the spleen.44,45 The splenomegaly and expansion of the red pulp apparent in SHPS-1 mutant mice suggested that the increase in erythropoiesis in compensation for the persistent anemia of these animals also occurs in the spleen. We therefore examined the percentage of erythroid cells among total splenic cells as well as the maturation stage of differentiating erythroblasts in the spleen by determination of the surface expression of both Ter-119 and CD71 (transferrin receptor) as described previously.40 All erythroid precursors subsequent to the proerythroblast stage express Ter-119 at a high level.40 The ratio of Ter-119high cells (erythroid cells, regions II and III) to Ter-119low cells (nonerythroid cells such as myeloid and lymphoid cells, region I) differed between SHPS-1 mutant and WT mice at 6 weeks of age (0.58 ± 0.03 versus 0.25 ± 0.02, respectively; means ± SE, n = 3, P < .01; Figure 3C-D). In contrast, CD71, although not erythroid specific, is expressed at high levels by early erythroid precursors, principally proerythroblasts and early basophilic erythroblasts, and its abundance decreases with erythroid maturation.40 The ratio of early (Ter-119highCD71high, region II) to late (Ter-119 highCD71low, region III) erythroblasts in the mutant mice was similar to that in WT mice (0.36 ± 0.04 versus 0.31 ± 0.02, respectively; means ± SE, n = 3; Figure 3C-D), suggesting that the differentiation of erythroblasts was not impaired in the SHPS-1 mutant animals. Reticulocytes also express CD71 and the Ter-119 highCD71low population (region III) might contain these cells as well as late erythroblasts. These results therefore indicate that the number of erythroid precursor cells in the spleen is markedly increased in SHPS-1 mutant mice. The serum concentration of erythropoietin was below detectable levels in both WT and SHPS-1 mutant mice (data not shown).
Shortened lifespan of circulating RBCs in SHPS-1 mutant mice
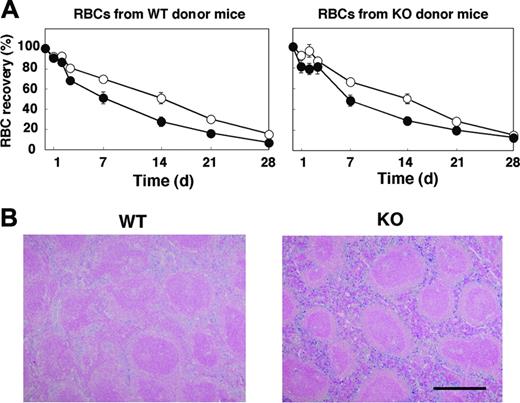
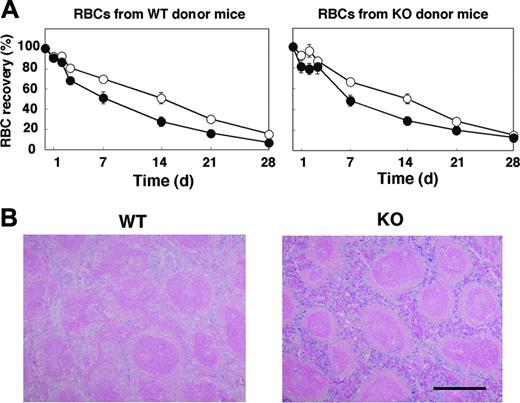
Given that the anemia apparent in SHPS-1 mutant mice did not seem to result from impaired proliferation or maturation of the erythroblast-erythrocyte lineage, we examined whether the rate of clearance of circulating RBCs was increased in the mutant animals. We transfused CFSE-labeled RBCs from WT donor mice into either WT or SHPS-1 mutant recipients and determined the number of labeled RBCs remaining in peripheral blood at various times thereafter (Figure 4A). The time course of the reduction in the percentage of CFSE-labeled RBCs in peripheral blood revealed that the lifespan of RBCs in WT mice was approximately 40 days (data not shown), consistent with previous observations.1,46,47 Whereas the half-life of transfused RBCs in WT mice was 330 ± 31 hours, it was only 180 ± 32 hours in SHPS-1 mutant mice (means ± SE, n = 5, P < .05). Transfusion of CFSE-labeled RBCs from SHPS-1 mutant donor mice revealed that the half-life of the labeled RBCs in WT recipients (326 ± 32 hours, n = 5) was similar to that of WT donor cells in WT recipients. The half-life of the labeled RBCs from mutant donor mice in mutant recipient mice (203 ± 26 hours, n = 5, P < .05) was again significantly shorter than the corresponding value for WT recipients (Figure 4A). These data suggest that the lifespan of RBCs in the mutant mice is shorter than that in WT mice and that this phenotype of the mutant animals is not attributable to a change in the properties of RBCs themselves.
Erythropoiesis in BM and the spleen of SHPS-1 mutant mice. (A) BM cells freshly isolated from the femur of WT or homozygous SHPS-1 mutant (KO) mice at 6 weeks of age were labeled with a PE-conjugated mAb to Gr-1 (thick traces) and an FITC-conjugated mAb to Ter-119 (thick traces). The specific mAb (to Gr-1 or to Ter-119) was replaced with rat IgG to TNP as a negative control (thin traces). The cells were then analyzed by flow cytometry. Mature RBCs (with low forward scatter and low side scatter) were excluded from analysis. The relative numbers of Gr-1-positive or Ter-119-positive cells were expressed as a percentage of all BM cells, as indicated on each histogram. Data are representative of 3 separate experiments. (B) The total BM-cell number (including mature RBCs) per femur was determined with a Burker-Turk counting chamber for WT and SHPS-1 mutant mice (left). The total BM-cell number excluding mature RBCs was calculated according to the density plot of FACS analysis for gating out of mature RBCs. Data similar to those shown in panel A were used to determine the absolute values for Gr-1-positive myeloid cells and Ter-119-positive erythroid cells (middle and right, respectively) by multiplying the percentage of Gr-1-positive myeloid cells or Ter-119-positive erythroid cells by the total BM-cell numbers excluding mature RBCs. Results are means ± SE of values from 3 mice of each genotype. *P < .05. (C) Freshly isolated splenic cells from WT or SHPS-1 mutant mice at 6 weeks of age were labeled with a PE-conjugated mAb to CD71, an FITC-conjugated mAb to Ter-119, and 7-AAD. They were then subjected to 3-color flow cytometry, with dead cells (7-AAD positive) and mature RBCs (with low forward scatter and low side scatter) being excluded from the analysis. Without gating out of mature RBCs, the proportion of region III (which represents Ter-119highCD71low cells) becomes extremely high (53.42%, without gating out vs 16.14%, with gating out) in the WT animal for instance, suggesting that gating out of mature RBCs is effective and thus essential for the analysis. Results are presented as density plots of all viable splenocytes; axes represent relative fluorescence units for FITC (Ter-119) and PE (CD71). Regions I to III were selected as indicated. The relative numbers of cells in each region were expressed as a percentage of all viable splenocytes, as indicated on each plot. Data are representative of 3 separate experiments. (D) Data similar to those shown in panel C were used to determine the percentages of nonerythroid cells (Ter-119 low, region I) as well as the percentages of early erythroblast (Ter-119highCD71high, region II) and the percentages of late erythroblast (Ter-119 highCD71low, region III) among total splenocytes for WT and SHPS-1 mutant mice (left). The ratio of Ter-119high cells (regions II and III) to Ter-119low cells (region I) and that of early (region II) to late (region III) erythroblasts are shown in the right panel. Results are means ± SE of values from 3 mice of each genotype. *P < .01.
Erythropoiesis in BM and the spleen of SHPS-1 mutant mice. (A) BM cells freshly isolated from the femur of WT or homozygous SHPS-1 mutant (KO) mice at 6 weeks of age were labeled with a PE-conjugated mAb to Gr-1 (thick traces) and an FITC-conjugated mAb to Ter-119 (thick traces). The specific mAb (to Gr-1 or to Ter-119) was replaced with rat IgG to TNP as a negative control (thin traces). The cells were then analyzed by flow cytometry. Mature RBCs (with low forward scatter and low side scatter) were excluded from analysis. The relative numbers of Gr-1-positive or Ter-119-positive cells were expressed as a percentage of all BM cells, as indicated on each histogram. Data are representative of 3 separate experiments. (B) The total BM-cell number (including mature RBCs) per femur was determined with a Burker-Turk counting chamber for WT and SHPS-1 mutant mice (left). The total BM-cell number excluding mature RBCs was calculated according to the density plot of FACS analysis for gating out of mature RBCs. Data similar to those shown in panel A were used to determine the absolute values for Gr-1-positive myeloid cells and Ter-119-positive erythroid cells (middle and right, respectively) by multiplying the percentage of Gr-1-positive myeloid cells or Ter-119-positive erythroid cells by the total BM-cell numbers excluding mature RBCs. Results are means ± SE of values from 3 mice of each genotype. *P < .05. (C) Freshly isolated splenic cells from WT or SHPS-1 mutant mice at 6 weeks of age were labeled with a PE-conjugated mAb to CD71, an FITC-conjugated mAb to Ter-119, and 7-AAD. They were then subjected to 3-color flow cytometry, with dead cells (7-AAD positive) and mature RBCs (with low forward scatter and low side scatter) being excluded from the analysis. Without gating out of mature RBCs, the proportion of region III (which represents Ter-119highCD71low cells) becomes extremely high (53.42%, without gating out vs 16.14%, with gating out) in the WT animal for instance, suggesting that gating out of mature RBCs is effective and thus essential for the analysis. Results are presented as density plots of all viable splenocytes; axes represent relative fluorescence units for FITC (Ter-119) and PE (CD71). Regions I to III were selected as indicated. The relative numbers of cells in each region were expressed as a percentage of all viable splenocytes, as indicated on each plot. Data are representative of 3 separate experiments. (D) Data similar to those shown in panel C were used to determine the percentages of nonerythroid cells (Ter-119 low, region I) as well as the percentages of early erythroblast (Ter-119highCD71high, region II) and the percentages of late erythroblast (Ter-119 highCD71low, region III) among total splenocytes for WT and SHPS-1 mutant mice (left). The ratio of Ter-119high cells (regions II and III) to Ter-119low cells (region I) and that of early (region II) to late (region III) erythroblasts are shown in the right panel. Results are means ± SE of values from 3 mice of each genotype. *P < .01.
Lifespan of circulating RBCs and accumulation of hemosiderin in the spleen of SHPS-1 mutant mice. (A) WT (○) or homozygous SHPS-1 mutant (•) mice were injected intravenously with CFSE-labeled RBCs derived from WT (left) or homozygous SHPS-1 mutant (right) mice. Blood samples (5 μL) were collected from a tail vein at the indicated times thereafter, and the fraction of fluorescent RBCs among recipient RBCs (100 000 per sample) was determined by flow cytometry. Data are expressed as a percentage of the value determined 5 minutes after injection and are means ± SE of values from 5 recipients per group. The percentage of CFSE-positive RBCs at 5 minutes after injection was 7% to 10% of total RBCs determined. (B) Spleen sections from WT or SHPS-1 mutant mice at 6 weeks of age were fixed with paraformaldehyde and stained with Berlin blue. Scale bar, 0.5 mm. Image acquisition performed as described for Figure 2C.
Lifespan of circulating RBCs and accumulation of hemosiderin in the spleen of SHPS-1 mutant mice. (A) WT (○) or homozygous SHPS-1 mutant (•) mice were injected intravenously with CFSE-labeled RBCs derived from WT (left) or homozygous SHPS-1 mutant (right) mice. Blood samples (5 μL) were collected from a tail vein at the indicated times thereafter, and the fraction of fluorescent RBCs among recipient RBCs (100 000 per sample) was determined by flow cytometry. Data are expressed as a percentage of the value determined 5 minutes after injection and are means ± SE of values from 5 recipients per group. The percentage of CFSE-positive RBCs at 5 minutes after injection was 7% to 10% of total RBCs determined. (B) Spleen sections from WT or SHPS-1 mutant mice at 6 weeks of age were fixed with paraformaldehyde and stained with Berlin blue. Scale bar, 0.5 mm. Image acquisition performed as described for Figure 2C.
We next examined the accumulation of hemosiderin, which is generated by the metabolism of heme, in the spleen. In WT mice, the accumulation of hemosiderin was observed predominantly in the red pulp, where the phagocytosis of old RBCs occurs (Figure 4B). Hemosiderin accumulation in the spleen of SHPS-1 mutant mice was markedly increased compared with that apparent in WT animals, suggesting that the anemia apparent in SHPS-1 mutant mice may be attributable, at least in part, to an increased rate of uptake and subsequent clearance of circulating RBCs by the spleen.
Increased clearance of opsonized RBCs and their uptake by F4/80-positive splenic macrophages in SHPS-1 mutant mice
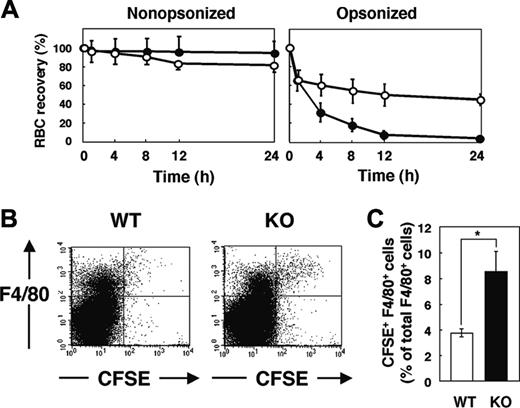
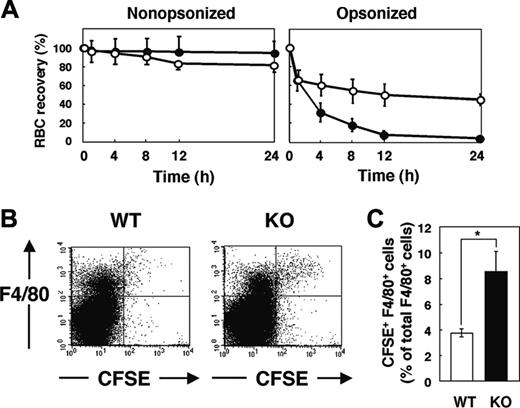
We next examined the clearance of IgG-opsonized RBCs in WT and SHPS-1 mutant mice. RBCs obtained from WT donor mice were opsonized with IgG, labeled with CFSE, and transfused into WT and mutant recipients. Minimal clearance of CFSE-labeled nonopsonized RBCs from the peripheral circulation was apparent in either WT or SHPS-1 mutant mice within 24 hours (Figure 5A). In contrast, IgG-opsonized RBCs were efficiently eliminated from the peripheral circulation of WT mice, and the rate of clearance of these cells was even greater in the mutant animals (Figure 5A).
Clearance of opsonized RBCs and their uptake by F4/80-positive splenic macrophages in SHPS-1 mutant mice. (A) WT (○) or homozygous SHPS-1 mutant (•) mice at 7 weeks of age were injected with CFSE-labeled RBCs (from WT mice) that had been opsonized with IgG (right) or not (left). Clearance of the injected RBCs was determined at the indicated times thereafter as in Figure 4A. (B) Splenocytes were isolated from WT or SHPS-1 mutant (KO) mice 8 hours after transfusion of IgG-opsonized, CFSE-labeled RBCs (from WT mice) as in panel A. The splenocytes were stained with a biotin-conjugated mAb to F4/80, PE-conjugate streptavidin, and 7-AAD, after which live F4/80-positive splenic macrophages that had ingested RBCs were detected by 3-color flow cytometry. Each panel shows a density plot of all viable splenocytes; axes indicate relative fluorescence units for CFSE and PE (F4/80). Results are representative of 3 independent experiments. (C) Among all F4/80-positive cells, the percentage of cells that had ingested CFSE-labeled RBCs was determined for WT and SHPS-1 mutant recipients in experiments similar to that shown in panel B. Data are means ± SE of values from 5 mice of each group and are representative of 3 independent experiments. *P < .05
Clearance of opsonized RBCs and their uptake by F4/80-positive splenic macrophages in SHPS-1 mutant mice. (A) WT (○) or homozygous SHPS-1 mutant (•) mice at 7 weeks of age were injected with CFSE-labeled RBCs (from WT mice) that had been opsonized with IgG (right) or not (left). Clearance of the injected RBCs was determined at the indicated times thereafter as in Figure 4A. (B) Splenocytes were isolated from WT or SHPS-1 mutant (KO) mice 8 hours after transfusion of IgG-opsonized, CFSE-labeled RBCs (from WT mice) as in panel A. The splenocytes were stained with a biotin-conjugated mAb to F4/80, PE-conjugate streptavidin, and 7-AAD, after which live F4/80-positive splenic macrophages that had ingested RBCs were detected by 3-color flow cytometry. Each panel shows a density plot of all viable splenocytes; axes indicate relative fluorescence units for CFSE and PE (F4/80). Results are representative of 3 independent experiments. (C) Among all F4/80-positive cells, the percentage of cells that had ingested CFSE-labeled RBCs was determined for WT and SHPS-1 mutant recipients in experiments similar to that shown in panel B. Data are means ± SE of values from 5 mice of each group and are representative of 3 independent experiments. *P < .05
F4/80-positive macrophages in the red pulp are responsible for phagocytosis of RBCs5,6 and they express SHPS-1 (Figure 1B). We thus compared the uptake of transfused CFSE-labeled RBCs by F4/80-positive cells between WT and SHPS-1 mutant mice. Opsonized and CFSE-labeled RBCs from WT donor mice were transfused into WT or mutant recipients and splenocytes were subsequently prepared for flow cytometric analysis. The incorporation of CFSE-labeled RBCs into F4/80-positive cells was more pronounced in SHPS-1 mutant mice than in WT animals (Figure 5B-C). The enhanced clearance of opsonized RBCs in SHPS-1 mutant mice is thus likely attributable to the increased uptake of these cells by F4/80-positive macrophages in the spleen.
Enhanced phagocytosis of opsonized RBCs by isolated splenic macrophages from SHPS-1 mutant mice
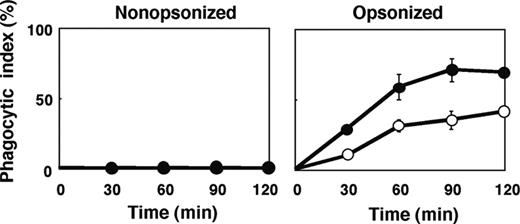
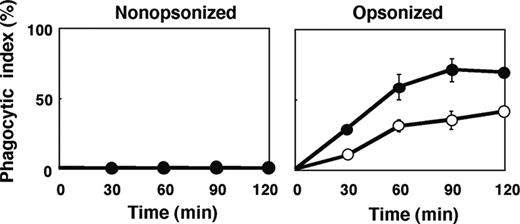
The number of F4/80-positive macrophages per spleen in SHPS-1 mutant mice ([6.24 ± 0.63] × 106 cells, n = 8) was greater than that for WT mice ([4.39 ± 0.23] × 106 cells, n = 8, P < .05) at 6 weeks of age. It was thus possible that this increase might explain, at least in part, the increased clearance of opsonized RBCs apparent in SHPS-1 mutant mice. However, we also examined phagocytosis by isolated splenic macrophages derived from WT or SHPS-1 mutant mice in an in vitro assay. Little phagocytosis of nonopsonized RBCs from WT donor mice was apparent with splenic macrophages from either WT or mutant animals during the 120-minute incubation (Figure 6). In contrast, IgG-opsonized RBCs underwent phagocytosis to a marked extent by splenic macrophages from WT mice and to an even greater extent by macrophages from SHPS-1 mutant mice (Figure 6).
Discussion
We have now shown that mice expressing a mutant version of SHPS-1, which lacks most of the cytoplasmic region of the protein, manifest mild anemia and enlargement of the spleen. The spleen of the mutant mice was characterized by expansion of the red pulp and an increase in the number of RBCs. In addition, the number of erythroid precursor cells in the spleen and the number of circulating reticulocytes were markedly increased, but differentiation of erythroid precursor cells in the spleen was not impaired in the SHPS-1 mutant mice. Furthermore, no apparent morphologic abnormality of circulating RBCs was evident in the mutant animals. Thus, neither impaired production nor differentiation of erythroid precursor cells nor immune-mediated intravascular hemolysis appears to be the primary cause of the anemia observed in SHPS-1 mutant mice.
In contrast, the half-life of circulating RBCs was greatly reduced and the accumulation of hemosiderin in the spleen was markedly increased in SHPS-1 mutant mice compared with WT mice. Moreover, the clearance of IgG-opsonized RBCs was also accelerated in SHPS-1 mutant mice. F4/80-positive splenic macrophages are primarily responsible for the ingestion of circulating RBCs in the spleen.5,6 Indeed, the uptake of transfused RBCs (IgG-opsonized) by F4/80-positive splenic macrophages was increased in the mutant mice compared with that apparent in WT animals. The anemia of SHPS-1 mutant mice is thus likely attributable to increased uptake of circulating RBCs by F4/80-positive splenic macrophages and the consequent reduced half-life of these circulating cells. In addition, the splenomegaly in the mutant animals might be attributable, at least in part, to the combination of erythrophagocytosis by splenic macrophages and a compensatory response to the anemia.
Consistent with this conclusion, an in vitro assay revealed that the extent of phagocytosis of opsonized RBCs by splenic macrophages derived from SHPS-1 mutant mice was greater than that apparent with macrophages from WT mice. We showed that F4/80-positive splenic macrophages express SHPS-1 and that such expression is markedly reduced in cells from the mutant mice. SHPS-1 is implicated in the recruitment and activation of SHP-1 at sites near the plasma membrane in response to cytokines or integrin-mediated cell adhesion in macrophages.12,19,20 The mutant form of SHPS-1 lacks most of the cytoplasmic region of the protein and is thus unable to bind SHP-1,34,35 a protein tyrosine phosphatase that negatively regulates multiple functions of hematopoietic cells including macrophages.21-23 It is thus likely that the enhanced phagocytic activity of macrophages from SHPS-1 mutant mice is attributable to both a loss of SHPS-1 expression and deletion of the cytoplasmic region. Furthermore, our results suggest that SHPS-1 negatively regulates phagocytosis in splenic macrophages through its formation of a complex with SHP-1.
Phagocytosis of opsonized RBCs by isolated splenic macrophages from SHPS-1 mutant mice. Adherent splenic macrophages derived from WT (○) or homozygous SHPS-1 mutant (•) mice were assayed for their phagocytic responses in vitro with nonopsonized (left) or IgG-opsonized (right) RBCs from WT donor mice. The phagocytic index was determined after incubation of cells for the indicated times at 37°C. Data are means ± SE of values from 3 independent experiments.
Phagocytosis of opsonized RBCs by isolated splenic macrophages from SHPS-1 mutant mice. Adherent splenic macrophages derived from WT (○) or homozygous SHPS-1 mutant (•) mice were assayed for their phagocytic responses in vitro with nonopsonized (left) or IgG-opsonized (right) RBCs from WT donor mice. The phagocytic index was determined after incubation of cells for the indicated times at 37°C. Data are means ± SE of values from 3 independent experiments.
The rate of clearance of transfused CD47-deficient RBCs from the bloodstream is greater than that for WT cells.6,32 In addition, the phagocytosis of CD47-deficient RBCs by splenic or BM-derived macrophages was found to be markedly enhanced in an in vitro assay.6,32 The binding of CD47 on RBCs to SHPS-1 on macrophages is thus thought to inhibit the phagocytosis of the former cells by the latter. We now provide further evidence in support of this model. We recently showed that phagocytosis of IgG- or complement-opsonized RBCs by peritoneal macrophages derived from SHPS-1 mutant mice was markedly enhanced compared with that apparent with WT macrophages.35 This effect was not observed either with CD47-deficient RBCs as the phagocytic target or in the presence of blocking antibodies to SHPS-1,35 suggesting that negative regulation of phagocytosis by SHPS-1 is attributable predominantly to its interaction with CD47 on target RBCs. Consistently, the clearance of transfused CD47-deficient RBCs (IgG-opsonized) in WT recipients was almost comparable to that apparent in SHPS-1 mutant recipients (T.I.-S. and T.M., unpublished data, July 2005).
Several phenotypic differences between CD47-deficient mice and SHPS-1 mutant mice are apparent, however. CD47-deficient mice6 show normal RBC parameters without apparent splenomegaly (P. A. Oldenborg, Umeå University; personal e-mail communication, January 2005), whereas SHPS-1 mutant mice manifest mild anemia and thrombocytopenia with splenomegaly. The reason for these differences is unclear. It is possible that the increased uptake of circulating RBCs by F4/80-positive splenic macrophages of SHPS-1 mutant mice is partly attributable to a loss of SHPS-1 function unrelated to CD47. Another phenotypic difference between the 2 types of mutant mice is that the clearance of transfused CD47-deficient RBCs, even without opsonization, in WT recipients was greatly increased 8 hours after transfusion compared with that apparent with WT RBCs.6 In addition, in vitro phagocytosis of nonopsonized CD47-deficient RBCs by WT splenic macrophages was also greater than that observed with WT RBCs.6 In contrast, we found that the clearance of transfused nonopsonized WT RBCs was minimal within 24 hours in both WT and SHPS-1 mutant recipients, although the half-life of the transfused WT RBCs was shorter in the latter mice. In addition, enhancement of in vitro phagocytosis by splenic macrophages from SHPS-1 mutant mice was observed only with opsonized RBCs. It is possible that CD47 deficiency in RBCs results in a loss of negative regulation by the CD47-SHPS-1 system of phagocytosis in macrophages as well as in stimulation of phagocytosis by an unknown mechanism.
Anemia was not present in the SHPS-1 mutant mice even at 4 weeks of age (either male or female) from the previous study by Yamao et al.34 In addition, they observed enhanced phagocytosis by peritoneal exudate macrophages (PEMs) of nonopsonized RBCs from SHPS-1 mutant mice compared with that from WT mice.34 Such differences between the previous work and the present study could be, in part, attributable to the fact that the previous study by Yamao et al34 used mice those were not backcrossed on C57BL/6 mice. In SHPS-1 mutant mice, the amount of serum iron was decreased at 13 weeks (Supplemental Table S1) and 64 weeks (U.N. and T.M., unpublished data, July 2005) of age but not 4 weeks and 6 weeks of age (Supplemental Table S1). Thus, the decrease in the amount of serum iron might be age dependent and SHPS-1 could participate in the metabolism of iron.
Overall, our present results suggest that SHPS-1, through its interaction with CD47 on RBCs, regulates the phagocytic activity of splenic macrophages for RBCs in a negative manner, thereby determining the lifespan of individual RBCs and controlling the number of circulating RBCs. It remains largely unknown how macrophages are able to distinguish young and normal RBCs from damaged or senescent RBCs.1-3 However, the CD47-SHPS-1 system potentially participates in such regulation. In addition, enhancement of CD47-SHPS-1 signal would be useful for the therapy of various types of anemia such as hemolytic anemia, which is caused by enhanced destruction of RBCs in the spleen.
Prepublished online as Blood First Edition Paper, September 1, 2005; DOI 10.1182/blood-2005-05-1896.
Supported by a Grant-in-Aid for Scientific Research on Priority Areas Cancer; a Grant-in-Aid for Scientific Research (B); a Grant-in-Aid for Young Scientists (B); a grant from the 21st Century Center of Excellence Program from the Ministry of Education, Culture, Sports, Science, and Technology of Japan; and a Grant-in-Aid from the Ministry of Health, Labor, and Welfare of Japan.
The online version of this article contains a data supplement.
The publication costs of this article were defrayed in part by page charge payment. Therefore, and solely to indicate this fact, this article is hereby marked “advertisement” in accordance with 18 U.S.C. section 1734.
We thank C. F. Lagenaur and S. Hirose for reagents as well as H. Kobayashi, Y. Hayashi, Y. Niwayama, and R. Koitabashi for technical assistance. We also thank P. A. Oldenborg for valuable suggestion and discussion.

