Abstract
Natural killer (NK) cells are thought to develop from common lymphoid progenitors in the bone marrow. However, immature thymocytes also retain NK potential. Currently, the contribution of the thymus-dependent pathway in normal steady-state NK-cell development is unknown. Here, we show that TCRγ genes are rearranged in approximately 5% of neonatal and 1% of adult mouse splenic NK cells, and similar levels are detected in NK cells from TCRβ,δ double-knockout mice, excluding the possibility of T-cell contamination. NK-cell TCRγ gene rearrangement is thymus dependent because this rearrangement is undetectable in nude mouse NK cells. These results change the current view of NK-cell development and show that a subset of NK cells develops from immature thymocytes that have rearranged TCRγ genes.
Introduction
Natural killer (NK) cells have unique phenotypes and functions. They are characterized as large granular lymphocytes, and they do not express antigen-specific receptors. Instead, they express multiple inhibitory receptors for major histocompatibility complex (MHC) class I1 as well as stimulatory receptors recognizing stress-induced molecules.2 These receptors enable NK cells to recognize and kill a wide range of tumors and virus-infected cells but not normal cells. Because of their unique phenotype and function, they are considered to form a distinct population of lymphocytes different from T and B cells. Currently, the developmental relationship among the 3 populations of lymphocytes is still unclear. It is generally thought that hematopoietic stem cells initially differentiate into common myeloid progenitors3 and common lymphoid progenitors (CLPs)4 in the bone marrow (BM). CLPs that give rise to T, B, and NK cells on transplantation into irradiated recipients have been defined as Lin–c-kitloSca-1loIL-7Rα+ BM cells.4 Although CLPs were assumed to also migrate to the thymus and develop into mature T cells, one study has suggested that early T-lineage progenitors (ETPs) independent of CLPs may be responsible for sustained production of T cells in the thymus.5 Unlike CLPs, ETPs retain some myeloid potential, have unique phenotype (c-kithiIL-7Rneg/lo), do not respond to IL-7, and exist in near-normal number in Ikaros-deficient mice.5 Thus, the contribution of CLPs in T-cell development is still unclear.
In the adult, it appears that NK cells share a close developmental pathway in the BM with B cells. A population of cells with NK-restricted, B-restricted, and NK/B bipotent progenitors has been characterized as Lin–c-kitloFlt3+IL-7Rα+/–.6 Also, Ikaros deficiency results in much-reduced numbers of CLPs, B cells, and NK cells, whereas T-cell numbers are not greatly affected.7 Therefore, B and NK cells may develop from CLPs, whereas T cells may develop independent of CLPs. Committed NK progenitors with the surface phenotype of Lin–CD122+ have also been identified in the BM.8 They do not yet express mature NK-cell markers, but they have lost potential for all other cell lineages. The developmental pathway of NK-lineage–restricted progenitors in the BM to mature NK cells has been studied in detail.9
Although NK cells may share a common precursor with B cells in the adult BM, this does not seem to be the case in the fetal environment. The dichotomy between myeloid and lymphoid lineages is not evident, and an equivalent CLP population has not been found in the fetal environment. The closest population in the fetal environment shows some myeloid potential.10 Numerous studies have shown that T-cell precursors possess NK lineage potential. A bipotent T/NK-cell precursor (TNKP) is present in the fetal liver, spleen, and blood. The earliest TNKP is B220loc-kit+CD19– and is found in the fetal liver (FL).11 They reconstitute the T-cell and NK-cell compartments on transplantation into mice lacking T, B, and NK cells. These cells have been shown to be truly bipotent, because a single cell gives rise to both T and NK cells in a fetal thymic organ culture (FTOC). This bipotent population represents 70% of the cells that seed the thymus.11 The earliest prethymic T-cell progenitors in the fetal blood12 and the first cells to colonize the fetal thymus13 both have T-, NK-, and dendritic-cell potential. Of 40 cells examined from the fetal thymic anlage, 7 cells gave rise to T cells, and all of these 7 cells also gave rise to NK cells. Four of these cells produced dendritic cells as well.13 Subpopulations of immature CD4–CD8– (DN) thymocytes in adult mice also possess NK-cell potential. In a recent study, the heterogenous adult DN1 (CD44+CD25–) thymocyte population was divided into several subpopulations, only 2 of which represent true T-cell precursors. These populations, termed DN1a (CD44+CD25–c-kit+CD24+) and DN1b (CD44+CD25–c-kit+CD24lo), show a precursor-progeny relation.14 When cultured on an OP9 stroma, DN1a, DN1b, and DN2 (CD44+CD25+) cells all gave rise to some NK1.1+ cells.14 The other subpopulations of DN thymocytes did not have NK-cell potential. NK-cell potential of DN1 thymocytes was also shown by Balciunaite et al.15 Adult DN1 c-kit+ cells, as well as DN2 cells, on culturing on OP9 cells developed into functional NK cells. Limiting dilution analysis showed that 1 in 15 DN1 cells and 1 in 7 DN2 cells developed into NK cells.15
Currently, the relation between CLP-derived NK cells and immature DN thymocyte-derived NK cells is unclear. In adult mice, the BM microenvironment is thought to be critical for NK-cell development, because treatment of the BM with 89Sr16 or by oestradiol17 results in NK-cell deficiencies. Similarly, osteopetrotic mice that have severely affected BM have much reduced NK cells.18 Also, NK-cell numbers appear normal in Nu/Nu mice or in euthymic mice,19,20 suggesting that the thymus is not essential for NK-cell development. It is possible that a subset of NK cells develops from TNKP in a thymus-dependent manner only in the fetal environment. In this regard, it is of interest that NK cells in fetal and neonatal mice are different from those in adult mice. The former express CD94/NKG2 that recognize nonclassical MHC class I Qa-1b and Ly49E but not other Ly49 receptors that recognize classical MHC class I, whereas the latter express a full repertoire of NK-cell receptors.21
In this study, we compared gene expression patterns between adult and neonatal NK cells to look for differences that may suggest different pathways of NK-lineage commitment in neonatal and adult mice. Unexpectedly, we found that a subpopulation of NK cells expresses rearranged TCRγ genes and that expression is higher in neonatal NK cells than in adult NK cells. These studies suggest that a subset of NK cells develops in the thymus from immature thymocytes that have rearranged TCRγ genes.
Materials and methods
Mice
C57BL/6 (B6) mice were bred in our animal facility. Adult mice used in this study were 6 to 10 weeks old, and neonatal mice were 1 to 3 days old. Rag2–/–HY TCR transgenic mice were also bred from breeders purchased from Taconic Farms (Germantown, NY). Adult TCRβ/TCRδ double-knockout (B6.129P2-Tcrbtm1MomTcrdtm1Mom/J) mice were purchased from Jackson Laboratories (Bar Harbor, ME). Heterozygous nude (B6.Cg-Foxn1nu) mice were purchased from Jackson Laboratories and were mated, and athymic nude neonatal mice (3 days old) were used.
Antibodies
Phycoerythrin (PE)–conjugated isotype control mouse IgG2a antibody; FITC-conjugated isotype control hamster IgG1 antibody; PE-conjugated anti-NK1.1 (PK136) and CD3 (145-2C11); FITC-conjugated anti-CD3ϵ (145-2C11); APC-labeled anti–mouse NK1.1 (PK136); biotin anti–mouse γδ T-cell receptor (GL3); CD19, CD3 (145-2C11), and CD4; streptavidin APC, PE, and FITC were purchased from BD-Biosciences (Mississauga, ON).
Staining and sorting of cells
Single-cell suspensions were prepared from thymuses for thymocyte controls. The murine fibroblast L cells were cultured in DMEM plus 10% FCS, L-glutamine, penicillin, streptomycin, and 5 × 10⁻⁵ M 2-mercaptoethanol. For purification of NK cells, splenocytes, thymocytes, or BM cells from adult (6-10 weeks old) or neonatal (1-3 days old) mice were passed through a 70-μm filter to generate a single-cell suspension, red blood cells were lysed with ammonium chloride solution, cells were washed with 2% PBS, and Fc receptors were blocked with 2.4G2 hybridoma supernatant. Splenocytes were stained with anti–NK1.1-PE, and NK1.1+ cells were enriched by an EasySep PE Positive Selection kit (StemCell Technologies, Vancouver, BC). Thymocytes were stained with biotinylated anti-CD4 and anti-CD3 antibodies plus streptavidin-FITC, positive cells were removed by EasySep FITC Positive Selection kit (StemCell Technologies), and remaining cells were stained with NK1.1 APC and CD3 PE. Splenocytes and BM cells were stained with NK1.1 PE and CD3-FITC, and finally propidium iodide was added to 5 μg/mL. NK cells (NK1.1+CD3– and in some cases TCRγδ–) were purified by 2 rounds of cell sorting by a fluorescence-activated cell sorting (FACS) Caliber (BD, Mountain View, CA). In some experiments, splenic, thymic, and BM NK cells were cultured with 1000 U/mL IL-2 (PeproTech, Rocky Hill, NJ) to expand the population. Cells were incubated in tissue culture dishes for 3 hours at 37°C, and the nonadherent cells were cultured for 7 days in RPMI1640 media containing 10% FCS, L-glutamine, penicillin, streptomycin, and 5 × 10⁻⁵ M 2-mercaptoethanol. After the cultures, cells were stained with anti–NK1.1-PE and anti–CD3ϵ-FITC, and NK cells were purified by 2 rounds of cell sorting. To isolate B cells, bulk splenocytes from adult and newborn mice were stained with anti–CD19-biotin plus streptavidin-PE and anti–CD3-FITC, and CD19+CD3– cells were purified by cell sorting. All sorted cells were checked for purity.
Microarray sample preparation and analysis
Total RNA was isolated by using the RNeasy Mini Kit (QIAGEN, Mississauga, ON). Double-stranded cDNA was synthesized from total RNA with the Superscript double-stranded cDNA kit (Invitrogen, Carlsbad, CA). The Enzo BioArray high-yield RNA transcript labeling kit (Affymetrix, Santa Clara, CA) produced biotin-labeled cRNA which was fragmented and hybridized to Affymetrix GeneChip Mouse Genome U74Av2 arrays. The first 2 microarray experiments were performed at the DNA Array Laboratory, Wine Research Centre, University of British Columbia, and the third experiment was performed at the Affymetrix GeneChip Facility at the Michael Smith Genome Sciences Centre, British Columbia Cancer Agency. All data analysis was performed with Genespring version 7 (Silicon Genetics, Redwood City, CA). Expression values were background corrected, normalized, and summarized by using the default settings of the program package.
Genomic PCR
To isolate genomic DNA, cells were divided into 106-cell aliquots, lysed with 50 μL dH2O and vigorous pipetting, placed at 98°C for 10 minutes, and then 5μL of 1 mg/mL proteinase K was added and incubated at 55°C for 2 hours followed by incubation at 98°C for 10 minutes. DNA thus isolated was used as a template for polymerase chain reaction (PCR). Forward primers Vγ2, Vγ3, Vγ4, and Vγ5 were as follows: Vγ2, 5′-TGGACATGGGAAGTTGGAG-3′; Vγ3, 5′-GATCAGCTCTCCTTTACCC-3′; Vγ4, 5′-CTGGGGTCATATGTCATCAA-3′;Vγ5, 5′-GCTAACCTACCATTCTCTGT-3′; and reverse primer derived from Jγ1 was 5′-CAGAGGGAATTACTATGAGC-3′. The genomic PCR design was based on that by Itohara et al.22 The reaction volume was 50 μL, containing 5 μL of 10 × PCR buffer, 1.5 μL of 50 mM MgCl2, 1 μL of 10 mM dNTPs, 1.25 μL each of 10 μM primers, and 0.5 μL of 5 U/μL Taq DNA polymerase. Thermocycling conditions were as follows: 3 minutes at 94°C followed by 30 cycles of 45 seconds at 94°C, 2 minutes at 55°C, 1 minute at 72°C, and finally 7 minutes at 72°C. PCR products (10 μL) mixed with 1 μL 10 × loading buffer were analyzed on a 1% agarose gel. The gel was alkaline blotted to BioRad's (Hercules, CA) Zeta-Probe membrane. The Southern blot was probed with a biotin-labeled oligonucleotide and visualized by Pierce's (Rockford, IL) North2South Chemiluminescent Nucleic Acid Hybridization and Detection kit. The oligonucleotide probe was labeled with 3′ end labeling DNA with biotin-14-dATP Invitrogen protocol. The probe sequence was as follows Jγ1, 5′-TGCAAATACCTTGTGAAAACCTGAG-3′. For determining the percentage of NK cells that had TCRγ gene rearrangement, DNA templates were first quantitated using Pico Green dsDNA quantitation kit (Molecular Probe; Invitrogen), and the fluorescence was measured with a CytoFluor 2300 Fluorescence Measurement System (Millipore, Billerica, MA). TCRβ PCR was as described by Ikawa et al,23 and TCRδ PCR was described by Capone et al.24 Nkg2a primers used as a positive control for presence of DNA were forward primer, CCTTCTCAGGAGCATCCCTGGAT, and reverse primer, GACAAAACAGATGAGGCCCAGGG, and the PCR conditions were the same as those for TCRγ genes.
RT-PCR
RNA was isolated from cells with QIAGEN's RNeasy Mini Kit and reversed transcribed into cDNA with QIAGEN's Omniscript Reverse Transcription kit. The cDNA samples for reverse transcriptase (RT)–PCR templates were equal to 100 ng RNA. Forward primers for Vγ2, Vγ3, Vγ4, and Vγ5 were paired with a reverse primer for a constant region sequence that is shared by all TCRγ clusters (Cγ1, Cγ2, and Cγ4). Their sequences are as follows: Vγ2, 5′-CCTTGGAGGAAGAAGACGA-3′; Vγ3, 5′-CATCGGATGAAGCCACGTA-3′; Vγ4, 5′-AGTGACAGAAGAGGACACG-3′; Vγ5, 5′-CGATTCTGCTCTGTACTACT-3′; and constant region reverse, 5′-CTTATGGAGATTTGTTTCAGC 3′. The reaction volume was 50 μL, containing 5 μLof10 × PCR buffer, 1.5 μL of 50 mM MgCl2, 1 μL of 10 mM dNTPs, 1.25 μL each of 10 μM forward and reverse primers, and 0.5 μL of 5 U/μL Taq DNA polymerase. Thermocycling conditions were as follows: 5 minutes at 96°C followed by 32 cycles of 15 seconds at 96°C, 40 seconds at 50°C, 1 minute at 72°C, and finally 10 minutes at 72°C. PCR product (1 μL) was analyzed on a 1% agarose gel. The Southern blot was performed as described for genomic PCR. The same oligonucleotide probes as the genomic PCR were used for the southern hybridization.
Sequencing of PCR products
RT-PCR products from thymocytes, IL-2–activated adult NK, and newborn NK cells were purified using Wizard PCR preps DNA purification from Promega (Madison, WI). The PCR products were ligated into the PGEM-T easy vector (Promega). The plasmid clones were sequenced at the NAPS Sequencing Service (University of British Columbia, Vancouver, BC). Study protocols were approved by the animal care committee of the University of British Columbia.
Results
Microarray analysis reveals expression of TCRγ gene in NK cells
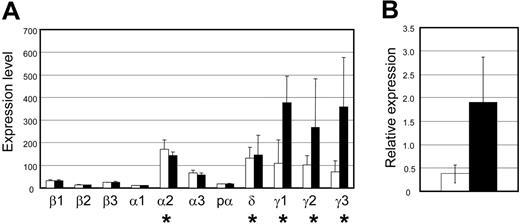
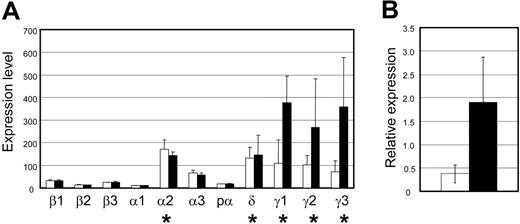
To examine whether adult and neonatal NK cells follow different pathways of lineage commitment, global gene expression of IL-2–activated NK cells which were purified by 2 rounds of cell sorting (greater than 99% NK1.1+CD3–) were compared by performing triplicate microarray experiments on Affymetrix MG-U74Av2 chips. The genes were normalized and then filtered on expression, confidence, and fold change. A parametric Student t test with a P value cut-off of .05, and a Benjamini and Hochberg false discovery rate multiple testing correction was applied. The results of the analyses are shown in Figure S1 (available at the Blood website; see the Supplemental Figure link at the top of the online article). Of 12 488 genes on the chip, 12 had statistically significant differences in expression between the 2 samples. As expected, 7 of the 12 differences in gene expression were from Ly49 genes with high expression in adult NK cells and low or absent in neonatal NK cells with the exception of Ly49e. Ly49e is known to be highly expressed on neonatal NK cells.25 The most striking and unexpected result was the expression of TCRγ genes in both adult and neonatal NK cells. An analysis of various TCR gene expression in NK cells showed that only TCRγ genes were consistently detected in both neonatal and adult NK cells (Figure 1A). TCRδ gene expression was detectable at a lower level, and the probe identification describes it as germ line TCRδ expression. TCRβ gene expression was undetectable. Only 1 of 3 TCRα gene probes detected positive expression, but it appears overall that the TCR gene expression in NK cells is limited to the TCRγ. Not only was TCRγ gene expression in NK cells detected, but its expression was also shown to be significantly higher in neonatal NK cells than in adult NK cells with a Student t test P value of .047 (Figure 1B).
Detection of TCRγ gene expression in NK cells by microarray analysis. (A) Gene expression patterns of purified IL-2–activated adult and neonatal NK cells were analyzed in triplicate using Affymetrix GeneChip Mouse Genome U74Av2 arrays. Expression of α, β, γ, and δ TCR genes ± SD are shown. ▪ indicates neonatal NK cells; □, adult NK cells. The expression values (0-700 on the graph) are based on raw values after default normalization of the 6 chips, with the 3 adult samples grouped together and the 3 neonatal samples grouped together. For Affymetrix gene chips, each gene is represented by a probe set of 10 to 25 oligonucleotide pairs, each pair consisting of a perfectly matching probe and a probe with one nucleotide mismatch in the middle of the sequence. The detection call of whether a gene is present (expressed) or absent (not expressed) is based on binding to the perfect match and mismatch pairs. Therefore, an expression value can be assigned, but it does not necessarily mean the gene will be called present. * indicates that the gene is present and that the expression values are valid. The Affymetrix probe numbers for these genes are β1, 101311; β2, 94202; β3, 99798; α1, 101823; α2, 97944; α3, 97945; pα (preTα), 98354; δ, 92328; γ1, 102745; γ2, 102685; and γ3, 102744. (B) Significant difference in expression levels of TCRγ gene (probe 102744) in IL-2–activated adult NK cells (□) and neonatal NK cells (▪) determined by a 1-way ANOVA (P < .05). The values represent the log ratio, which is the intensity ratio (adult NK cell sample gene divided by the neonatal NK-cell sample gene) log transformed (log2). Error bars represent the standard deviation.
Detection of TCRγ gene expression in NK cells by microarray analysis. (A) Gene expression patterns of purified IL-2–activated adult and neonatal NK cells were analyzed in triplicate using Affymetrix GeneChip Mouse Genome U74Av2 arrays. Expression of α, β, γ, and δ TCR genes ± SD are shown. ▪ indicates neonatal NK cells; □, adult NK cells. The expression values (0-700 on the graph) are based on raw values after default normalization of the 6 chips, with the 3 adult samples grouped together and the 3 neonatal samples grouped together. For Affymetrix gene chips, each gene is represented by a probe set of 10 to 25 oligonucleotide pairs, each pair consisting of a perfectly matching probe and a probe with one nucleotide mismatch in the middle of the sequence. The detection call of whether a gene is present (expressed) or absent (not expressed) is based on binding to the perfect match and mismatch pairs. Therefore, an expression value can be assigned, but it does not necessarily mean the gene will be called present. * indicates that the gene is present and that the expression values are valid. The Affymetrix probe numbers for these genes are β1, 101311; β2, 94202; β3, 99798; α1, 101823; α2, 97944; α3, 97945; pα (preTα), 98354; δ, 92328; γ1, 102745; γ2, 102685; and γ3, 102744. (B) Significant difference in expression levels of TCRγ gene (probe 102744) in IL-2–activated adult NK cells (□) and neonatal NK cells (▪) determined by a 1-way ANOVA (P < .05). The values represent the log ratio, which is the intensity ratio (adult NK cell sample gene divided by the neonatal NK-cell sample gene) log transformed (log2). Error bars represent the standard deviation.
TCRγ genes are rearranged and expressed in NK cells
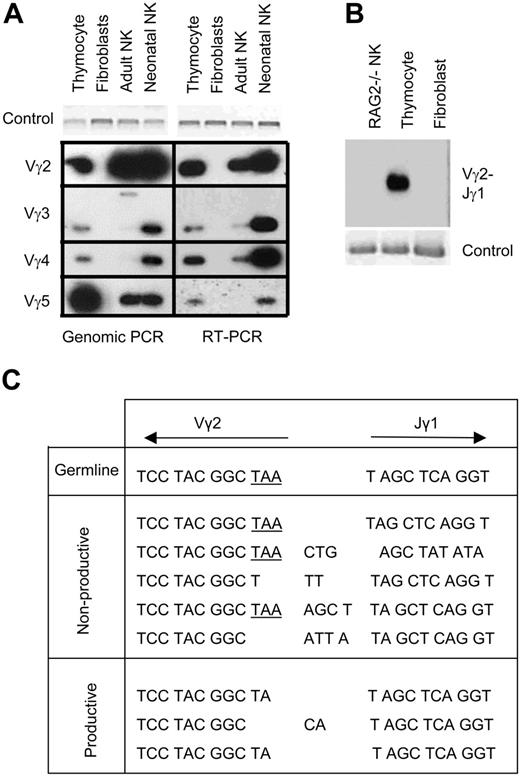
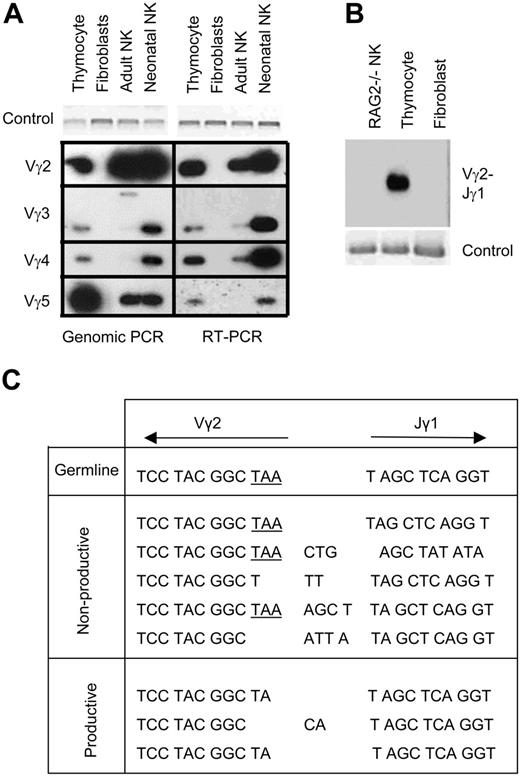
The microarray data illuminated TCRγ gene expression in NK cells. However, the probes for the TCRγ genes on the microarrays were specific for the 3′ end of the transcripts, and the results did not reveal whether the microarray data were detecting germ line expression or expression of rearranged TCRγ segments that resulted from VJ recombination. In addition, if it was detecting rearrangement, the microarray data did not show the extent of possible rearrangement combinations that were expressed. There are 4 clusters in the murine TCRγ locus, each containing variable (V), joining (J), and constant (C) regions. Cluster 1, which is the most commonly studied, consists of 4 V segments (Vγ2, Vγ3, Vγ4, and Vγ5), one J segment (Jγ1), and one constant region (Cγ1). During T-cell development, one V segment is recombined with the respective J segment by RAG enzymes. To further characterize the TCRγ gene expression in NK cells, genomic PCR was performed to determine whether TCRγ genes are rearranged in NK cells. Forward primers specific to the V segments in the locus (Vγ2, Vγ3, Vγ4, Vγ5) and the reverse primers specific to their respective J segment (Jγ1) were used. The genomic PCR was designed so that if the locus was in germ line configuration, the V and J primers would bind to segments too far apart from each other to produce a PCR product. However, if the V and J segments were rearranged, the primers would be close enough to each other to produce a PCR product of about 350 bp. IL-2–activated NK cells from adult and neonatal mouse spleen were purified as above and analyzed by genomic PCR. Southern blot analysis of the PCR products hybridized to Jγ-specific oligonucleotide probes determined that neonatal NK cells exhibited rearrangement of all possible V-J combinations that were examined, whereas adult NK cells had some of the possible rearrangements (Figure 2A, left). The identity of the larger band seen for the adult NK cell Vγ3-Jγ1 PCR is unknown. These results showed that TCRγ gene rearrangement with multiple V-J combinations does occur in NK cells. To determine whether the rearranged TCRγ genes are expressed in NK cells, RT-PCR was performed using the primers specific to the V segments and their corresponding C region. Consistent with the genomic PCR results, neonatal NK cells expressed all of the possible combinations, whereas adult NK cells expressed only some (Figure 2A, right). The genomic and RT-PCR experiments were also performed with freshly isolated NK cells without culturing with IL-2, and the results were the same to those with IL-2–activated NK cells (data not shown).
To confirm the specificity of the PCR analysis, NK cells from adult Rag2–/– mice were sorted and tested by the genomic PCR. As expected, no TCRγ gene rearrangement was detected in these NK cells (Figure 2B). The specificity of the RT-PCR was also confirmed by cloning and sequencing the PCR products from thymocytes, purified adult and neonatal NK cells. The sequences showed that PCR cross-amplified nonspecific TCRγ genes. However, Southern hybridization to Vγ-specific oligonucleotide probes detected only the specific sequences (data not shown). Because Vγ2-Jγ1 recombination was most prominent among NK cells, it was further analyzed. Vγ2 has an in-frame stop codon at the 3′ end, which can be removed during the VJ gene recombination process. Of the Vγ2-Jγ1 rearrangements that were sequenced, 4 of 9 (44%) were in-frame, productive rearrangements in adult NK cells and 3 (37.5) of 8 were in-frame, productive rearrangements in neonatal NK cells (Figure 2C). These are similar to the expected frequencies (33%) of random unselected rearrangements.
TCRγ gene rearrangement and expression in NK cells. (A) Southern hybridization with Jγ1-specific oligonucleotide probe of genomic PCR (left) or RT-PCR (right) of IL-2–activated adult and neonatal NK cells to test for rearrangement of TCRγ locus and expression of rearranged TCRγ genes. Thymocytes are the positive control, and fibroblasts (L cells) are the negative control. Nkg2a PCR and glyseraldehyde-3-phosphate dehydrogenase (Gapdh) RT-PCR were used as control. (B) NK-cell DNA from adult Rag2–/– was tested by genomic PCR for Vγ2-Jγ1 rearrangement as in panel A. (C) Sequences of neonatal NK-cell RT-PCR products for Vγ2-Cγ1 transcripts. Only the sequences at the junction of Vγ2-Jγ1 are shown. The in-frame stop codon in Vγ2 is underlined.
TCRγ gene rearrangement and expression in NK cells. (A) Southern hybridization with Jγ1-specific oligonucleotide probe of genomic PCR (left) or RT-PCR (right) of IL-2–activated adult and neonatal NK cells to test for rearrangement of TCRγ locus and expression of rearranged TCRγ genes. Thymocytes are the positive control, and fibroblasts (L cells) are the negative control. Nkg2a PCR and glyseraldehyde-3-phosphate dehydrogenase (Gapdh) RT-PCR were used as control. (B) NK-cell DNA from adult Rag2–/– was tested by genomic PCR for Vγ2-Jγ1 rearrangement as in panel A. (C) Sequences of neonatal NK-cell RT-PCR products for Vγ2-Cγ1 transcripts. Only the sequences at the junction of Vγ2-Jγ1 are shown. The in-frame stop codon in Vγ2 is underlined.
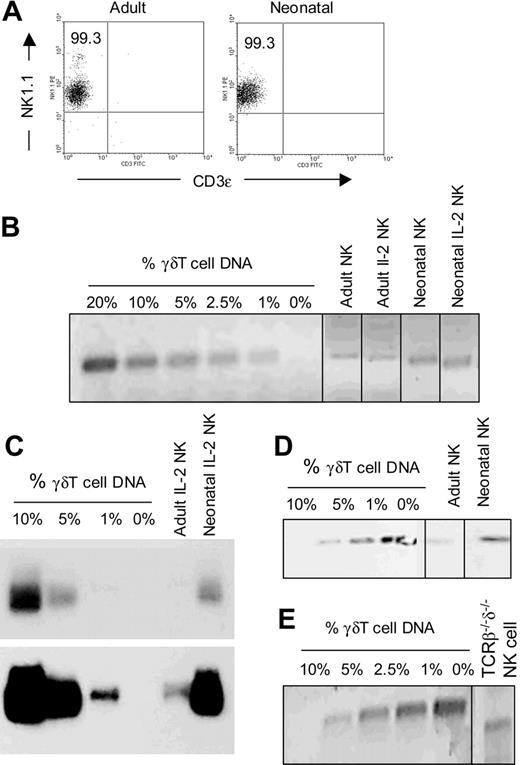
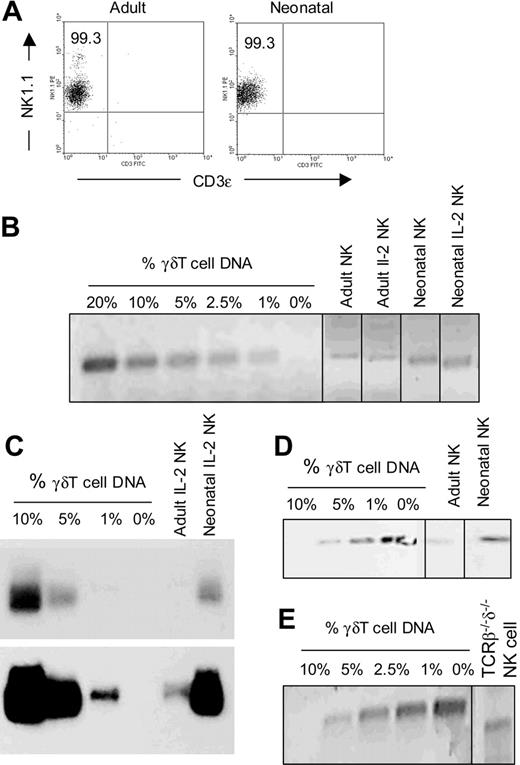
Low frequency of NK cells with rearranged TCRγ genes. (A) Purity of IL-2–activated NK-cell samples from adult and neonatal mice after 2 rounds of cell sorting. The numbers show the percentages of NK cells (NK1.1+CD3–). (B) Genomic PCR (Vγ2-Jγ1) performed with γδT-cell DNA and fibroblast DNA mixed at various ratios and with fresh and IL-2–activated adult and neonatal NK cells. The PCR products were analyzed by agarose gel electrophoresis and stained with ethidium bromide. (C) Southern hybridization to Jγ1 probe of the genomic PCR products generated from IL-2–activated NK cells from adult and neonatal mice in panel B. The top panel shows a short exposure of the Southern blot, whereas the bottom panel shows a long exposure to visualize rearranged Vγ2-Jγ1 in adult NK cells. (D) Southern blot of genomic PCR, as in panel C, but with freshly isolated adult and neonatal cell DNA. (E) The frequency of IL-2–activated NK cells from TCRβ–/–δ–/– mice with Vγ2-Jγ1 rearrangement was estimated by genomic PCR and ethidium bromide staining of agarose gel as in panel B. Gels divided by lines are groupings of images from different parts of the same gel.
Low frequency of NK cells with rearranged TCRγ genes. (A) Purity of IL-2–activated NK-cell samples from adult and neonatal mice after 2 rounds of cell sorting. The numbers show the percentages of NK cells (NK1.1+CD3–). (B) Genomic PCR (Vγ2-Jγ1) performed with γδT-cell DNA and fibroblast DNA mixed at various ratios and with fresh and IL-2–activated adult and neonatal NK cells. The PCR products were analyzed by agarose gel electrophoresis and stained with ethidium bromide. (C) Southern hybridization to Jγ1 probe of the genomic PCR products generated from IL-2–activated NK cells from adult and neonatal mice in panel B. The top panel shows a short exposure of the Southern blot, whereas the bottom panel shows a long exposure to visualize rearranged Vγ2-Jγ1 in adult NK cells. (D) Southern blot of genomic PCR, as in panel C, but with freshly isolated adult and neonatal cell DNA. (E) The frequency of IL-2–activated NK cells from TCRβ–/–δ–/– mice with Vγ2-Jγ1 rearrangement was estimated by genomic PCR and ethidium bromide staining of agarose gel as in panel B. Gels divided by lines are groupings of images from different parts of the same gel.
TCRγ+ NK cells represent a small population of total NK cells
To determine the percentage of splenic NK cells with TCRγ rearrangement, fresh and IL-2–activated NK cells from adult and neonatal mice were purified by 2 rounds of cell sorting. The purity of the NK cell samples used in this experiment were always greater than 99% with 0% to 0.05% CD3+ or TCRγδ+ (Figure 3A). DNA was isolated from the purified NK cells and subjected to genomic PCR analysis for TCR Vγ2-Jγ1 rearrangement. To determine the frequency of Vγ2-Jγ1 rearrangements among NK cells, DNA was also isolated from purified γδT cells and mixed with fibroblast (L cell) DNA at various ratios, and genomic PCR was performed in the same way. The intensity of the bands for adult and neonatal NK cells was compared with the various control percentages. To ensure that the starting amount of DNA was identical for each sample, the DNA was first measured with PICO green staining. Results consistently showed that about 5% of neonatal NK cells and about 1% of adult NK cells had Vγ2-Jγ1 gene rearrangements (Figure 3B-C). The frequency was the same with freshly isolated NK cells and IL-2–activated NK cells, because the PCR bands were of similar intensity (Figure 3B,D).
Because these percentages are low, it was important to rule out the possibility of T-cell contamination in the NK-cell samples. The same experiment was also performed with NK-cells from TCRβ–/–δ–/– mice which have no T cells in the spleen. TCRγ gene rearrangement was still observed in these NK-cell samples, thus ruling out the possibility of T-cell contamination (Figure 3E).
Thymus is required for the development of TCRγ+ NK cells
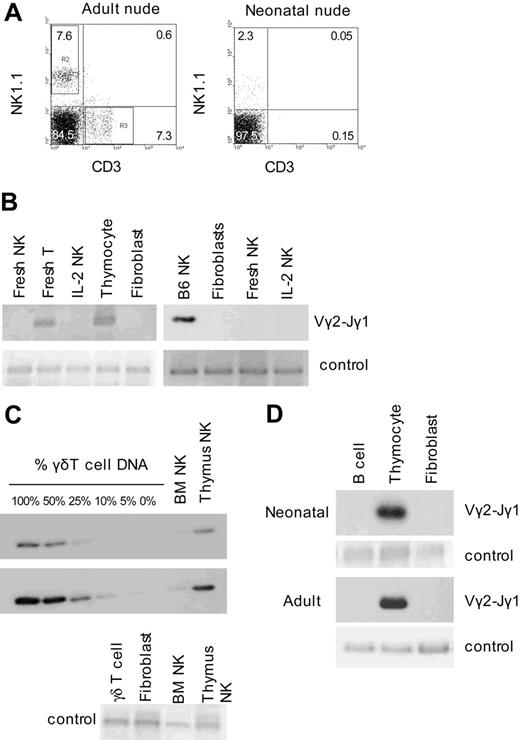
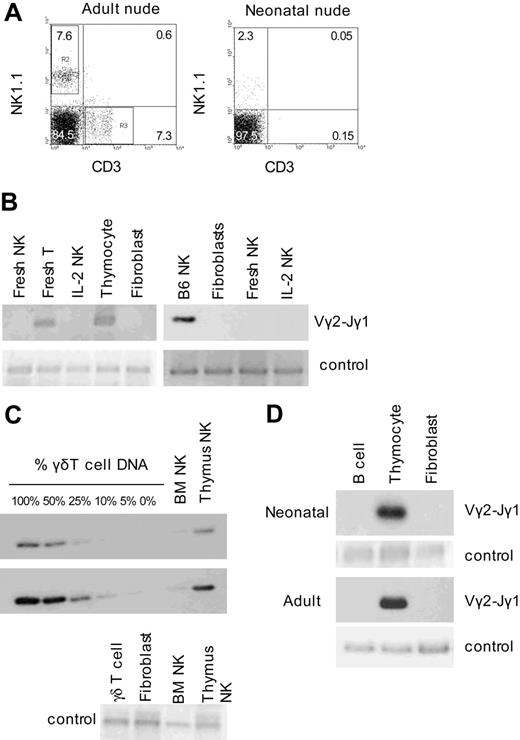
The TCR gene rearrangement in NK-cell subsets suggested that they develop in the thymus, because this is the location where the majority of T cells undergo TCR V(D)J recombination. To examine whether the TCRγ+ NK cells develop in the thymus, NK cells were isolated from nude mice, which lack a proper thymic environment and lack conventional T cells. Only extrathymic T cells accumulate in the spleen of older nude mice (up to 5.4% of splenocytes) (Figure 5A). It was known that NK cells were present at normal or elevated levels in adult nude mice, but the NK-cell status of neonatal nude mice was not known. Normal number of NK cells was found in the spleen of neonatal (3 days old) nude mice. Genomic PCR analysis of freshly isolated NK cells and IL-2–activated NK cells from nude mice showed no Vγ2-Jγ1 rearrangement in NK cells from nude mice (Figure 5B). It should be noted that extrathymic T cells, which accumulate in the spleen of old nude mice, had rearranged TCRγ genes, but NK cells isolated from the same mice did not (Figure 5B), demonstrating that the TCR rearrangement can still occur in these mice, and the absence of it in NK cells is due to the lack of the thymus. Furthermore, genomic PCR analysis of highly purified fresh and IL-2–activated NK cells from the BM and thymus showed that TCRγ gene rearrangement is present in at least half of thymic NK cells, whereas very low (∼ 5% or less) rearrangement was detected in BM NK cells (Figure 5C). Therefore, the thymus seems to be required for the development of NK cells with rearranged TCRγ genes.
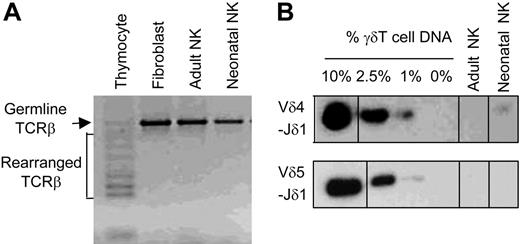
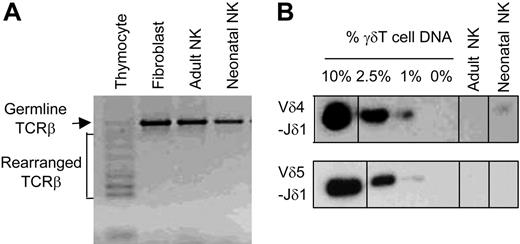
TCRβ and TCRδ gene rearrangements in NK cells. DNA from purified IL-2–activated adult and neonatal NK cells was tested by genomic PCR for TCRβ (A) or TCRδ (B) rearrangement. (A) Genomic PCR using primers specific to Dβ2 and Jβ2.6 genes was analyzed by agarose gel electrophoresis and stained with ethidium bromide. The largest band represents nonrearranged germ line TCRβ locus, whereas multiple smaller bands represent TCRβ gene rearrangements. Thymocyte DNA was used as positive control, and fibroblast DNA was used as negative control. (B) Genomic PCR (Vδ4-Jδ1 or Vδ5-Jδ1) performed with γδT-cell DNA and fibroblast DNA mixed at various ratios and with fresh and IL-2–activated adult and neonatal NK cells. The PCR products were analyzed by agarose gel electrophoresis, blotted, and hybridized to Jδ1-specific oligonucleotide probe. Gels divided by lines are groupings of images from different parts of the same gel.
TCRβ and TCRδ gene rearrangements in NK cells. DNA from purified IL-2–activated adult and neonatal NK cells was tested by genomic PCR for TCRβ (A) or TCRδ (B) rearrangement. (A) Genomic PCR using primers specific to Dβ2 and Jβ2.6 genes was analyzed by agarose gel electrophoresis and stained with ethidium bromide. The largest band represents nonrearranged germ line TCRβ locus, whereas multiple smaller bands represent TCRβ gene rearrangements. Thymocyte DNA was used as positive control, and fibroblast DNA was used as negative control. (B) Genomic PCR (Vδ4-Jδ1 or Vδ5-Jδ1) performed with γδT-cell DNA and fibroblast DNA mixed at various ratios and with fresh and IL-2–activated adult and neonatal NK cells. The PCR products were analyzed by agarose gel electrophoresis, blotted, and hybridized to Jδ1-specific oligonucleotide probe. Gels divided by lines are groupings of images from different parts of the same gel.
Lack of TCRγ gene rearrangement in nude mouse NK cells and B6 mouse B cells. (A) Percentages of NK (NK1.1+CD3–) cells and T (NK1.1–CD3+) cells in the spleen of 1-year-old (left) and 3-day-old (right) nude mice. (B) Agarose gel electrophoresis and ethidium bromide staining of genomic PCR (Vγ2-Jγ1) of IL-2–activated and fresh NK cells from adult and neonatal nude mice. T cells that accumulate in aged nude mice were also isolated from spleen of the same adult mouse by cell sorting. Thymocytes were used as positive control and fibroblasts (L cells) were used as negative control. Genomic PCR for a part of Nkg2a gene confirms that comparative amounts of template DNA was used for all the genomic PCR. (C) Southern blot with Jγ1 probe of genomic PCR products generated from IL-2–activated NK cells from adult thymuses and BM and γδ T-cell and fibroblast DNA mixed at various ratios. The middle panel is a longer exposure of the same membrane. The bottom panel shows control Nkg2a PCR confirming that comparable amounts of DNA were used for the analysis. (D) Southern blot with Jγ1 probe of genomic PCR (Vγ2-Jγ1) of B6 adult and neonatal splenic B (CD19+CD3–). Genomic PCR for a part of Nkg2a gene confirms the presence of B-cell DNA.
Lack of TCRγ gene rearrangement in nude mouse NK cells and B6 mouse B cells. (A) Percentages of NK (NK1.1+CD3–) cells and T (NK1.1–CD3+) cells in the spleen of 1-year-old (left) and 3-day-old (right) nude mice. (B) Agarose gel electrophoresis and ethidium bromide staining of genomic PCR (Vγ2-Jγ1) of IL-2–activated and fresh NK cells from adult and neonatal nude mice. T cells that accumulate in aged nude mice were also isolated from spleen of the same adult mouse by cell sorting. Thymocytes were used as positive control and fibroblasts (L cells) were used as negative control. Genomic PCR for a part of Nkg2a gene confirms that comparative amounts of template DNA was used for all the genomic PCR. (C) Southern blot with Jγ1 probe of genomic PCR products generated from IL-2–activated NK cells from adult thymuses and BM and γδ T-cell and fibroblast DNA mixed at various ratios. The middle panel is a longer exposure of the same membrane. The bottom panel shows control Nkg2a PCR confirming that comparable amounts of DNA were used for the analysis. (D) Southern blot with Jγ1 probe of genomic PCR (Vγ2-Jγ1) of B6 adult and neonatal splenic B (CD19+CD3–). Genomic PCR for a part of Nkg2a gene confirms the presence of B-cell DNA.
Rag genes have been shown to be activated in CLPs in the BM,26,27 and about 5% of adult NK cells have been shown to have rearranged immunoglobulin heavy chain gene.26 Therefore, whether TCRγ genes are also rearranged in B cells in neonatal and adult mice was tested. Genomic PCR analysis of purified B cells detected no Vγ2-Jγ1 rearrangement in B cells (Figure 5D). These results suggest that a subpopulation of NK cells develop from thymic T/NK bipotential progenitors that have rearranged TCRγ genes and lost B-cell potential.
Discussion
This study has revealed a thymic pathway of NK-cell lineage commitment that includes TCR rearrangement. TCRγ genes are rearranged and expressed in a subpopulation of NK cells. This work is significant because it shows that NK cells follow at least 2 separate pathways of lineage commitment, one in the thymus shared with developing T cells and another pathway in the BM. It is important to know that the BM pathway is not representative of all NK cells in steady-state NK-cell development. Many studies have demonstrated that some immature thymocytes in adult mice have potential for both the T-cell and the NK-cell lineages,14,15,28,29 and in fetal mice TNKPs exist in the liver, blood, and thymus.11,12,23,30-32 However, NK potential of these cells was shown by either in vitro cultures23,31,32 or transplantation into irradiated hosts,11 and the contribution of this pathway in steady-state NK-cell development has been unclear. Because athymic mice have normal numbers of NK cells with normal phenotype and function,19,20 it is commonly assumed that all NK cells develop in the BM, regardless of the NK-cell potential demonstrated in T-cell progenitors. Our study changes this view.
The presence of TCRγ gene rearrangement in NK cells does not necessarily prove that a subset of NK cells develop in the thymus because RAG enzymes are also expressed in CLPs in the BM.26,27 Rag expression in CLPs does appear to affect NK cells because about 5% of adult NK cells have rearranged immunoglobulin heavy chain genes.26 However, B cells, which arise from CLPs, do not have TCRγ gene rearrangement. This suggests the TCR rearrangement in NK cells does not occur as a result of Rag expression in the BM progenitors. Also, the rearrangement is absent in NK cells from nude mice. This implies that the TCRγ rearrangement in these NK cells is thymus dependent, and they follow a separate pathway of lineage commitment from the BM-derived NK cells. In addition, to confirm that the absence of NK cells in nude mice is not due to the defective FoxN1 gene instead of the lack of a thymus, we show that thymic NK cells have TCRγ rearrangement, whereas BM NK cells do not. It is likely that the small percentage of BM NK cells that are TCRγ+ are circulating NK cells. The thymic NK cells that do not have Vγ2-Jγ1 rearrangement may have other Vγ rearrangements or they may be NK cells that arise from DN1 progenitors before V(D)J recombination begins. NK cells that develop in vitro from DN1 progenitors lack TCRγ rearrangement, whereas the majority of DN2-derived NK cells have TCRγ rearrangement (L.L.V. and F.T., unpublished data, October 2005).
It is most likely that TCRγ+ NK cells arise from DN2 T-cell precursors because this is the stage that TCRγ gene rearrangement begins.33 TCRγ and TCRδ gene rearrangements occur at least one full stage ahead of TCRβ gene rearrangement. Specifically, Vγ2-Jγ1 rearrangements are clearly seen at the DN2 stage, and maximal rearrangement is reached by the DN3 and DN4 stages. This is similar for TCRδ. Although a few complete TCRγ and TCRδ gene rearrangements can be detected at DN2, TCRβ locus is mainly in germ line form.33 The possibility that TCRγ+ NK cells arise from DN2 thymocytes is in line with what has been described about TNKP development in the fetal thymus as well.23 Fetal DN1 cells include both TNKPs and NK progenitors, whereas DN2 cells, however, have a large number of T progenitors as well as TNKP and NK progenitors. By the DN3 stage, there is not much progenitor activity left except for a limited number of T progenitors.23 In our current study, TCRβ gene rearrangements are undetectable in NK cells, suggesting that there may be a narrow window of opportunity for TNKPs in the thymus to rearrange TCRγ genes and still retain NK potential. It is likely that once thymocytes rearrange both TCRγ and TCRδ or TCRβ genes, they likely become committed for the T lineage and lose NK potential. Our results suggest that TCRγ gene rearrangement may initiate earlier than TCRδ because multiple Vγ-Jγ recombinations can be detected in NK cells whereas TCRδ gene rearrangement seems very rare, but our microarray results do show germ line TCRδ expression. Although only Vδ4-Jδ1 and Vδ5-Jδ1 recombinations were examined in our study, they are commonly found in most γδT cells. Our results also dispute the common assumption that TCR rearrangement marks the final irreversible commitment of cells to the T-cell lineage because NK cells can still arise after TCR VJ recombination has begun.
In this study, we primarily focused on Vγ2-Jγ1 recombination because it was most prominent among several possible Vγ-Jγ recombinations. Because other Vγ-Jγ rearrangements are also detectable in NK cells, albeit at lower levels, the frequency of NK cells with any TCRγ gene rearrangement may be higher than 5%. Also, additional NK cells likely arise from DN1 cells, but, because they are not expected to have rearranged TCRγ genes, we cannot make any conclusions about whether a larger proportion of NK cells develop in the thymus before the initiation of TCRγ rearrangement. Ikawa et al23 examined TCR gene rearrangement in NK cells generated from fetal thymic progenitors by FTOC and did not detect rearrangement of TCRβ genes or TCR Vγ3-Jγ1 or Vγ4-Jγ1 rearrangement. This is inconsistent with our current results, but the discrepancy may be explained by the fact that Vγ2-Jγ1 is the most prevalent rearrangement detected in our study, whereas Ikawa et al23 did not examine this rearrangement. It is also possible that their genomic PCR may not have been sensitive enough to detect the small percentage of rearrangements.
In humans, the earliest T-cell progenitor in the thymus (CD34+CD1a–) has immature TCRδ gene rearrangements, although it still has the potential to become NK cells and dendritic cells.34 Also, a rare blastic NK-cell–like lymphoma with TCRγ gene rearrangement has been described.35 These TCRγ+ NK cells may be equivalent to the population we have described in mice. It is currently unknown whether the phenotype and/or function of thymus-derived NK cells, some of which have rearranged TCRγ genes, differ from those derived from fetal liver or adult BM. It is possible that thymus-derived NK cells may localize to specific tissues. NK cells in various tissues can be examined by using TCRγ gene rearrangement as a marker for thymus-derived NK cells. It is unlikely that the rearrangement and expression of TCRγ genes itself affects NK-cell functions though, because it is not expressed on the cell surface.
Many studies have suggested that the NK-cell fate may be the default fate of thymocytes and that T cells evolved from primordial NK cells such that the NK-cell differentiation program served as a base for T-cell differentiation.13 What controls the switch between T-cell and NK-cell lineage commitment is still unclear, although key factors may include Notch signal strength and Id2.28,29,36,37
To conclude, our study provides evidence that a population of NK cells does in fact develop in the thymus during steady-state NK-cell development. The NK-cell potential demonstrated by others in the bipotent T/NK progenitors in the fetal environment and in the fetal and adult DN1 and DN2 thymocytes does represent a normal pathway of NK-cell development and reveals a close developmental relationship between T cells and NK cells.
Prepublished online as Blood First Edition Paper, November 29, 2005; DOI 10.1182/blood-2005-07-2797.
Supported by a grant from the Canadian Institute of Health Research and by the Michael Smith Foundation for Health Research (L.L.V.).
L.L.V. designed and performed the research, analyzed the data, and wrote the paper; C.P.G., N.M., and C.A.P. performed the research; and F.T. designed the research, analyzed the data, and wrote the paper.
The online version of this article contains a data supplement.
The publication costs of this article were defrayed in part by page charge payment. Therefore, and solely to indicate this fact, this article is hereby marked “advertisement” in accordance with 18 U.S.C. section 1734.
The raw expression values of the microarray experiments are available at EBI ArrayExpress (http://www.ebi.ac.uk/arrayexpress/) accession no. E-MEXP-354.

