Abstract
The cellular and molecular events underlying the formation and differentiation of mesoderm to derivatives such as blood are critical to our understanding of the development and function of many tissues and organ systems. How different mesodermal populations are set aside to form specific lineages is not well understood. Although previous genetic studies in the mouse embryo have pointed to a critical role for the homeobox gene Mix-like (mMix) in gastrulation, its function in mesoderm development remains unclear. Hematopoietic defects have been identified in differentiating embryonic stem cells in which mMix was genetically inactivated. Here we show that conditional induction of mMix in embryonic stem cell–derived embryoid bodies results in the early activation of mesodermal markers prior to expression of Brachyury/T and acceleration of the mesodermal developmental program. Strikingly, increased numbers of mesodermal, hemangioblastic, and hematopoietic progenitors form in response to premature activation of mMix. Differentiation to primitive (embryonic) and definitive (adult type) blood cells proceeds normally and without an apparent bias in the representation of different hematopoietic cell fates. Therefore, the mouse Mix gene functions early in the recruitment and/or expansion of mesodermal progenitors to the hemangioblastic and hematopoietic lineages.
Introduction
The formation of mesoderm is a pivotal process in the normal development of major tissues and organs of the mammalian embryo, including the hematopoietic, cardiovascular, and musculoskeletal systems. During early development, mesoderm is also a crucial component of extraembryonic structures such as the yolk sac, allantois, and placenta.1,2 Mesoderm begins to form shortly after implantation during a process known as gastrulation.3-6 Fate maps suggest that different mesodermal derivatives arise in an orderly manner from patterning of cell populations within distinct posteroanterior regions of the streak.7,8 The most posterior region of the primitive streak is fated to form the extraembryonic mesoderm, while successively more anterior derivatives give rise to lateral, paraxial, and axial mesoderm. Despite intense effort, the mechanisms underlying the orderly allocation of mesoderm to its various lineages remain obscure.9
A number of major signaling pathways, including transforming growth factor β (TGFβ), fibroblast growth factor,10 and Wnt, have been shown to play central roles during gastrulation.4,6 While the functional relationships among these pathways in the induction and patterning of mesoderm remain to be defined, their activities are likely to be integrated, at least in part, through the downstream activities of nuclear transcription factors. Members of the Mix/Bix family of paired class homeobox genes are direct or indirect targets of the TGFβ family members Nodal/activin11-25 and BMP4.26,27 Xenopus Mix.1 (Xmix.1), the founding member of the Mix/Bix family, has been reported to ventralize mesoderm.26 Several other Xenopus and zebrafish Mix/Bix genes have been implicated in the formation of endoderm or mesendoderm.16,18-20,22,24,25,28
Although Mix-related genes have been identified in all eukaryotic species analyzed,29 only a single Mix gene has been found in mouse, chick, and humans.29-33 The mouse Mix-like gene (here termed mMix; also known as Mml or Mixl1) is expressed in the posterior visceral endoderm prior to gastrulation and later in the primitive streak and nascent mesoderm.32-34 The significance of this gene in gastrulation was revealed by analysis of mMix-deficient mouse embryos, which display numerous mesodermal and endodermal defects and arrest by embryonic day 9.5 (E9.5).35 For example, the primitive streak is enlarged, a heart tube is absent and, in some mutants, the allantois is abnormally large.35
In vitro systems have provided important insights into the processes involved in germ layer formation and specification and complement genetic studies in the animal. Embryonic stem (ES) cells have gained increasing attention as an approach to exploring the induction and differentiation of mesoderm, endoderm, and ectoderm in culture. Under appropriate conditions, ES cells form structures known as embryoid bodies (EBs) that can differentiate along a number of distinct lineages representing each of the 3 embryonic germ layers.36 The temporal appearance of hematopoietic and endothelial progenitors and activation of mesodermal, hematopoietic, and endothelial genes in developing EBs has been well characterized and mimics that observed during normal embryogenesis.37-40 Indeed, cells with the properties of the hemangioblast, a common progenitor for hematopoietic and endothelial cells, were first identified in the ES cell system37,38 and were later shown to be present in gastrulating mouse embryos.41
During the differentiation of ES cells to EBs, activation of mMix begins just prior to the appearance of hemangioblasts and precedes formation of primitive and definitive hematopoietic cell types.34 Mix is expressed in a population of Brachyury/T+Flk1+ cells from EBs that contain hemangioblasts34 ; conversely, hemangioblasts are enriched in mMix-expressing cell populations.27 A function for mMix in blood cell development is strongly suggested by the recent demonstration of hematopoietic defects in mMix-deficient embryoid bodies.27
To evaluate the response to mMix expression during the earliest stages of ES cell differentiation, we have generated ES cell lines in which mMix can be rapidly induced with doxycycline (DOX). Here we report that early up-regulation of mMix accelerates the mesoderm developmental program. The numbers of mesodermal, hemangioblastic, and hematopoietic progenitors are significantly increased, as evidenced by formation in clonogenic assays of transitional, blast, and hematopoietic colonies. Moreover, analysis of marker gene and cell surface protein expression and colony and cell morphologies indicates that these progenitors differentiate normally. We propose that the mouse Mix gene functions early in the recruitment and/or expansion of mesodermal progenitors to the hemangioblastic and hematopoietic lineages.
Materials and methods
Generation of plox-mMix targeting vector and inducible mMix ES cell lines
A FLAG-tagged mMix cDNA29 was subcloned into the plox targeting vector42 to create plox-mMix, which was coelectroporated with pSalk-Cre into Ainv 15 ES cells.42 Drug-resistant targeted clones were identified by Southern blotting and polymerase chain reaction (PCR). Clonal isolates were cultured in the presence or absence of 1 μg/mL DOX (Sigma, St Louis, MO; no. D9891) for 48 hours, and cell lysates were analyzed by immunoblotting34,43 using an antibody against the FLAG epitope (anti-FLAG M2; Sigma; no. 3165). ES cell clones were expanded and differentiated essentially as described.44 Transgene expression was induced 24 hours after plating in EB culture (day 1) by the addition of DOX to a final concentration of 0.1 μg/mL. The medium was changed on day 3, and fresh DOX was added. The experiments included in this report were repeated from 2 to 5 times.
RNA preparation and RT-PCR
Total cellular RNA was prepared from 0.5 × 10⁷ to 1.0 × 10⁷ cells using TRIzol (Invitrogen, Carlsbad, CA; no. 15596). To eliminate contaminating genomic DNA, the initial RNA pellet was resuspended in ribonuclease (RNase)–free deionized water and incubated with deoxyribonuclease (DNase) I (2 to 4 U/μL; Roche, Indianapolis, IN; no. 776-785) for 30 minutes at 37°C in the buffer supplied by the manufacturer. The sample was then extracted with phenol-chloroform and precipitated in ethanol in the presence of glycogen carrier.45 Conditions for radiolabeled, semiquantitative reverse transcription (RT)–PCR and primer sequences were as described.43,46,47 Additional primer sequences (annealed at 55°C to 58°C) were as follows: T (forward): 5′-GTCTTCTGGTTCTCCGATGT-3′ (545 bp product), T (reverse): 5′-CTACTCTAAGGCAACAAGGG-3′; c-kit (forward): 5′-TGTCTCTCCAGTTTCCCTGC-3′ (765 bp product), c-kit (reverse): 5′-TTCAGGGACTCATGGGCTCA-3′; Rex1 (forward): 5′-GGCTGCGAGAAGAGCTTTATTC-3′ (438-bp product), Rex1 (reverse): 5′-CTGCCAAAGTTGGCCATTC-3′.
For each experiment, controls were performed in which reverse transcriptase was omitted from the cDNA reaction mixture and template DNA was omitted from the PCR mixture. For quantitative real-time PCR (QRT-PCR), gene-specific primers and 5′-FAM (carboxyfluorescein)–Black Hole Quencher (FAM:BHQ) probe(s) (Table S1, available on the Blood website; see the Supplemental Table link at the top of the online article) corresponded to 3′-untranslated regions. They were designed using Primer3 software48 and synthesized at the Hartwell Center at St Jude Children's Research Hospital (Memphis, TN). Briefly, 1 to 5 μg RNA was converted into cDNA, and a series of diluted samples were used for 40-cycle PCR in TaqMan Universal PCR Master Mix (containing AmpliTaq Gold enzyme; ABI; no. 4304437) in an ABI (Perkin-Elmer-Applied Biosystems, Foster City, CA) Prism 9700 instrument. Reactions (20 μL total) contained 1 μL cDNA, 6 μM each primer, and 4 μM probe and were run using the default ABI 7900 program. To generate a standard curve for comparison of mRNA levels in different samples, multiple dilutions of the control cDNA sample, spanning at least 3 orders of magnitude, were prepared. The equation describing the plot of threshold cycle, Ct, versus log concentration was used to determine relative amounts of mRNA in experimental samples. Using the optimized conditions and threshold values, individual samples were analyzed in triplicate using the probe of interest and an internal control expected to be unchanged between samples. Three different internal controls were used: glyceraldehyde-3-phosphate-dehydrogenase (Gapdh), glucose phosphate isomerase-1 (Gpi-1), and metallothionein-2 (Mt-2). From the Ct values, the relative transcript concentration was calculated and normalized to that of the internal control. The maximum expression data point was adjusted to 100. Data are shown for samples normalized to Gapdh, but results were comparable when analysis was performed using Gpi-1 or Mt-2 alone or a combination of all 3 controls.
Assays for hematopoietic progenitors and blast colonies
Blast and transitional colony assays44 and clonogenic assays for primitive erythroid progenitors43,45 were performed as described previously. Definitive hematopoietic progenitors were assayed in Methocult (StemCell Technologies, Vancouver, BC, Canada).45 Cytospin preparations and May-Grünwald Giemsa staining were as described.43,45
Fluorescence activated cell sorting analysis
At the indicated times in culture, EBs were dispersed using 0.05% trypsin/EDTA (Gibco Invitrogen, Grand Island, NY). Single-cell suspensions containing 1 × 10⁵ to 3 × 10⁵ cells were stained with antibodies in phosphate-buffered saline (PBS) containing 3% FCS and 0.1% sodium azide. Antibodies used were biotinylated anti–rat Flk1 (subclone M218) and phycoerythrin (PE)–conjugated anti–c-kit (clone 2B8; BD Pharmingen, San Diego, CA; no. 553355). Flk1 monoclonal antibody was affinity purified using protein G–Sepharose and biotinylated using the Fluoreporter Biotin-XX Protein Labeling Kit (Molecular Probes, Eugene, OR; no. F2610). Flk1 expression was detected using allophycocyanin (APC)–conjugated streptavidin (BD Pharmingen). Flow cytometry was performed using a FACScalibur instrument (Becton Dickinson [BD], San Jose, CA). The cytometer was calibrated against unstained and single stained cells. Dead cells were excluded by forward and side scatter or according to propidium iodide uptake.
Immunocytochemistry
Single-cell suspensions of embryoid bodies were prepared by treatment with trypsin. Cells were plated on gelatin-treated coverslips and fixed in paraformaldehyde (1% in PBS) for 10 minutes and permeabilized in methanol for 30 minutes prior to incubation in blocking solution (PBS containing 1% bovine serum albumin; Sigma; no. A9647). Anti-FLAG M2 mouse monoclonal antibody (Sigma; no. F3165) was used at a concentration of 5 μg/mL. Alexa Fluor 488–conjugated rabbit antimouse secondary antibody (Molecular Probes; no. A11122) was used at a dilution of 1:500 in blocking solution. Coverslips were mounted on microscope slides using Vectashield Mounting Medium with Dapi (Vector Laboratories, Burlingame, CA; H-1200).
Microscopy
Fluorescently labeled cells were visualized using a Zeiss Axioplan-2 microscope with a 40 × Plan-NEOFLUAR/0.75 NA objective and appropriate filter sets (Chroma Technology, Rockingham, VT). Images were captured with a SPOT digital camera (Diagnostic Instruments, Sterling Heights, MI). Bright-field images of embryoid bodies were acquired in AxioVision (Carl Zeiss Microsystems, Thornwood, NY) using an Axiocam MRC camera mounted on a Zeiss Axiovert 25 microscope or a Leica MZ12 stereo dissecting microscope.
Results
Transient expression of mMix early in differentiating ES cells
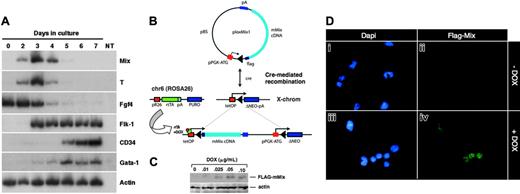
Under appropriate culture conditions, murine ES cells form “embryoid bodies” (EBs) whose development recapitulates a number of aspects of early embryonic development, including differentiation along mesodermal, endodermal, and ectodermal lineages.36 We had previously reported that mMix is transiently expressed in embryoid bodies derived from the CCE ES cell line.34 In preparation for generation of the inducible system discussed in the next section, which is based on the E14 line of ES cells,42 we also examined the time course of expression of mMix and other genes in differentiating E14 EBs. The patterns of transcription in E14 EBs were very similar to those observed for CCE EBs. For example, Fgf4, which encodes a growth factor that plays a role in epithelial-mesenchymal interactions throughout development, is expressed in the inner cell mass (ICM) of the blastocyst, in ES cells, in the primitive streak of the gastrulating embryo and, later, in certain mesodermal populations.49 In differentiating EBs, levels of Fgf4 mRNA decrease steadily as ES cells (day 0 in Figure 1A) differentiate. Transient expression of mMix and T was detected early in embryoid body differentiation34 (Figure 1A and data not shown; note peak at days 3 and 4). The initiation of Flk1 transcription overlapped with peak mMix and T expression (day 3) and continued after the down-regulation of these genes. Progenitors for primitive and definitive hematopoietic cell types formed by day 6 and days 8 to 10, respectively (not shown). Therefore, mMix is turned on just prior to and peaks around the time of activation of Flk1 and formation of cells with hematopoietic and endothelial potential. It is silenced before their differentiation in EBs.
Mouse Mix is activated early during ES cell differentiation and is conditionally expressed in i-Mix ES cell lines. (A) RT-PCR analysis of mMix expression in EBs (E14 line). Controls (-RT, -DNA) were routinely performed. NT indicates minus template control. (B) Strategy for conditional expression of mMix in ES cells. The vector plox-Mix1, encoding amino-terminal FLAG-tagged mMix, was inserted into the X chromosome using Cre-mediated recombination.42 In the presence of DOX, rtTA protein expressed from the ROSA26 locus on chromosome 6 (chr6) can bind to a tetracycline operator (tetOP), and expression of mMix is activated. (C) Western blot analysis of 1 of the 3 i-mMix ES cell lines (clone 2) cultured at different concentrations of DOX. Actin was used as a loading control. (D) Nuclear expression of FLAG-tagged mMix protein in cells from induced i-Mix EBs. Magnification, × 40.
Mouse Mix is activated early during ES cell differentiation and is conditionally expressed in i-Mix ES cell lines. (A) RT-PCR analysis of mMix expression in EBs (E14 line). Controls (-RT, -DNA) were routinely performed. NT indicates minus template control. (B) Strategy for conditional expression of mMix in ES cells. The vector plox-Mix1, encoding amino-terminal FLAG-tagged mMix, was inserted into the X chromosome using Cre-mediated recombination.42 In the presence of DOX, rtTA protein expressed from the ROSA26 locus on chromosome 6 (chr6) can bind to a tetracycline operator (tetOP), and expression of mMix is activated. (C) Western blot analysis of 1 of the 3 i-mMix ES cell lines (clone 2) cultured at different concentrations of DOX. Actin was used as a loading control. (D) Nuclear expression of FLAG-tagged mMix protein in cells from induced i-Mix EBs. Magnification, × 40.
Conditional expression of mMix in ES cell–derived embryoid bodies
Gain-of-function studies have been a classical approach in developmental biology to understand gene function and complement loss-of-function studies. Using a system developed for DOX-inducible expression of exogenous genes in differentiating ES cells,42 we generated a panel of ES cell lines (here termed i-Mix) in which FLAG-tagged mMix is induced in response to DOX via activation of a reverse tettransactivator protein (rtTA; Figure 1B). This system allows consistent and reversible induction of a conditional reporter, and the uninduced cells provide an ideal control.42 Because all cell lines are derived by Cre-mediated recombination of the cDNA of interest into the same locus,42 position effects are not a problem. Candidate i-Mix lines were screened for inducible expression of FLAG-mMix protein (see “Materials and methods”). Three clones (termed 1, 2, and 10) expressed the transgene and displayed similar levels of FLAG-mMix protein expression, growth and induction kinetics, and expression of cell surface Flk1 and c-kit (Figure 5). Clone 2 was chosen for further analysis. As shown in Figure 1C-D, FLAG-mMix protein was detected in the presence but not in the absence of DOX and could be detected at DOX concentrations as low as 0.025 to 0.10 μg/mL (Figure 1C). Expression of FLAG-mMix protein was nuclear (Figure 1D), as expected from our earlier studies.34 Subsequent studies were performed using DOX at 0.1 μg/mL.
Mesoderm formation is accelerated in response to mMix
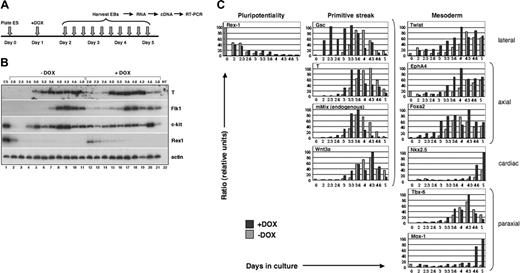
As a first step in examining the events following premature activation of Mix, a time course experiment was performed in which i-Mix ES cells were plated in the absence of leukemia inhibitory factor (LIF) or feeder cells. DOX was added to half of the cultures 24 hours after plating (day 1.0), and EBs were harvested at 3- to 4-hour intervals beginning at day 2.0 after plating of ES cells (shown schematically in Figure 2A). Total cellular RNA was isolated and analyzed by semiquantitative RT-PCR (Figure 2B). Samples were normalized for expression of β-actin.43,46,47
As anticipated, the zinc finger transcription factor Rex1 was down-regulated both in the presence and absence of DOX. In DOX-induced EBs, down-regulation of Rex1 was slightly delayed (Figure 2B [compare lanes 2-5, –DOX, with lanes 12-15, +DOX] and Figure 2C; see “Discussion”). In contrast, conditional activation of mMix resulted in premature induction of the mesodermal program of development, as reflected in the early activation of the pan-mesodermal marker T (Figure 2B, compare lanes 3-6 with lanes 13-17).
In light of our previous finding34 that mMix, T, and Flk1 are coexpressed in a subpopulation of EB cells in which a green fluorescent protein (Gfp) gene was targeted to the T locus,40 we assayed for Flk1 (an early hemangioblast marker) and c-kit, a marker of hematopoietic stem cells that is also expressed, at low levels, on EB cells with hemangioblast potential.40 Activation of Flk1 and c-kit was also accelerated (Figure 2B, compare lanes 2-7 with lanes 12-17). c-kit is expressed in undifferentiated E14 ES cells (as we expected; Figure 2B, lane 140 ). Upon initiation of differentiation, c-kit was transiently down-regulated (Figure 2B, lanes 2 and 3) and was activated again around days 2.6 to 3.0 (Figure 2B, lanes 4 and 5). In the presence of DOX, c-kit expression was easily detected as early as day 2 (Figure 2B, compare lanes 2-4, –DOX, with lanes 12-14, +DOX); whether down-regulation of c-kit was blocked between 24 and 48 hours by early induction of Mix was not determined. T, Flk1, and c-kit were also down-regulated more rapidly at later stages of EB differentiation in the presence than in the absence of DOX (Figure 2B, compare lanes 10 and 11 with lanes 20 and 21), suggesting that conditional activation of mMix resulted in acceleration of mesodermal development.
The mesodermal developmental program is accelerated in response to mMix. (A) General experimental protocol for induction and analysis of i-Mix EBs cultured with or without DOX. DOX (0.1 μg/mL) was added on day 1 after plating under differentiation conditions. (B) Semiquantitative RT-PCR analysis of gene expression in i-Mix EBs cultured with or without DOX. EBs were harvested on days 2.0 (lanes 2, 12), 2.3 (lanes 3, 13), 2.6 (lanes 4, 14), 3.0 (lanes 5, 15), 3.3 (lanes 6, 16), 3.6 (lanes 7, 17), 4.0 (lanes 8, 18), 4.3 (lanes 9, 19), 4.6 (lanes 10, 20), and 5.0 (lanes 11, 21). NT (lane 22) indicates minus template control. Expression of T was transient, preceding activation of Flk1 and c-kit. The differentiation program in DOX-induced i-Mix cells was accelerated (see text). (C) Quantitative real-time RT-PCR analysis of primitive streak and early mesodermal gene expression in i-Mix EBs cultured with or without DOX. Expression was normalized to that of a housekeeping gene (for this figure, Gapdh) and expressed as a ratio (see “Materials and methods”).
The mesodermal developmental program is accelerated in response to mMix. (A) General experimental protocol for induction and analysis of i-Mix EBs cultured with or without DOX. DOX (0.1 μg/mL) was added on day 1 after plating under differentiation conditions. (B) Semiquantitative RT-PCR analysis of gene expression in i-Mix EBs cultured with or without DOX. EBs were harvested on days 2.0 (lanes 2, 12), 2.3 (lanes 3, 13), 2.6 (lanes 4, 14), 3.0 (lanes 5, 15), 3.3 (lanes 6, 16), 3.6 (lanes 7, 17), 4.0 (lanes 8, 18), 4.3 (lanes 9, 19), 4.6 (lanes 10, 20), and 5.0 (lanes 11, 21). NT (lane 22) indicates minus template control. Expression of T was transient, preceding activation of Flk1 and c-kit. The differentiation program in DOX-induced i-Mix cells was accelerated (see text). (C) Quantitative real-time RT-PCR analysis of primitive streak and early mesodermal gene expression in i-Mix EBs cultured with or without DOX. Expression was normalized to that of a housekeeping gene (for this figure, Gapdh) and expressed as a ratio (see “Materials and methods”).
Mesodermal gene activation following induction of i-Mix was examined more systematically using quantitative real-time PCR (QRT-PCR). For these studies, expression was normalized to Gapdh (Figure 2C), Gpi-1, and/or Mt-2 (see “Materials and methods”). Delayed down-regulation of Rex1 in response to mMix was again observed (Figure 2C), confirming the semiquantitative RT-PCR result (Figure 2B). Four genes that are expressed in the primitive streak were all activated prematurely in the induced i-Mix EBs: gsc,50 T,51,52 endogenous mMix,32-34 and Wnt3a.53,54 Goosecoid (gsc), which in the mouse embryo is first expressed early in gastrulation, in the emerging primitive streak,50 was activated shortly after induction of mMix and nearly 24 hours earlier than in uninduced EBs (Figure 2C). In the frog, gsc is a direct target of XMix.128 ; its rapid activation in response to mMix suggests that it may be a direct Mix target in the mouse embryo as well. Transient expression of T, endogenous mMix, and Wnt3a followed activation of gsc (Figure 2C). Markers of several types of embryonic mesoderm were also activated earlier in the induced i-Mix EBs (Figure 2C): lateral (Twist55 ), axial (EphA4 and Foxa2/Hnf3β 56-59 ), paraxial (Tbx-6 and Mox160,61 ), and cardiac (Nkx2.562 ). These mesodermal genes were activated in an orderly fashion, following up-regulation of gsc, T, and endogenous mMix.
Accelerated and enhanced activation of hemangioblastic and hematopoietic developmental programs
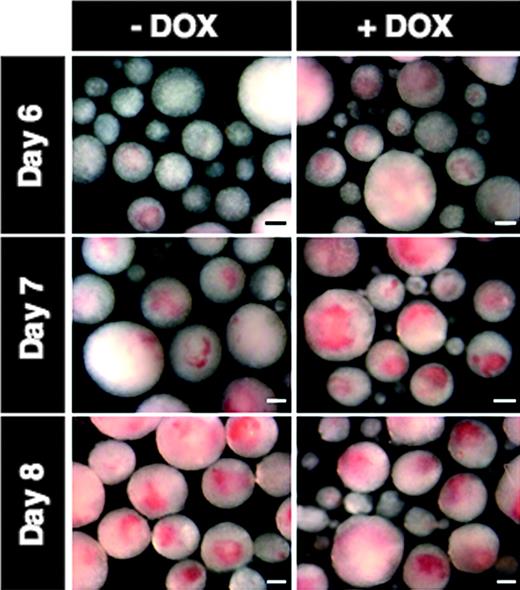
During our initial characterization of the i-Mix ES cell lines, we noticed that the DOX-treated EBs became brightly pigmented by days 6 and 7 (reflecting hemoglobin production in erythroid cells), at least 24 hours earlier than untreated EBs (Figure 3). By day 8, the uninduced EBs showed equivalent pigmentation. Therefore, we investigated the formation of hemangioblastic and hematopoietic mesoderm in greater detail.
Expression of a panel of markers for hemangioblast (Figure 4, left panels) and hematopoietic (Figure 4, right panels) development was examined using QRT-PCR. Early activation of Flk1 and c-kit was again detected in this analysis. Runx1 is expressed in yolk sac mesoderm prior to the formation of blood islands and in EB-derived blast colony-forming cells (BL-CFCs), the in vitro equivalent of the hemangioblast.63-65 It encodes the DNA-binding subunit of a core binding factor transcriptional regulator,66 is a marker of long-term repopulating hematopoietic stem cells,67 and is essential for hematopoietic commitment of hemangioblasts.65 Scl/tal, a member of the basic helix-loop-helix family of transcription factors, functions somewhat later than Runx1 or Flk1.68,69 Flk1 and Tal1 are thought to act in a combinatorial manner to regulate cell fate choice in the early embryo to the hematopoietic, endothelial, and smooth muscle lineages.68 All 4 genes (Runx1, Flk1, c-kit, and Scl/tal) were prematurely activated in response to induction of mMix. Two homeobox genes that play pivotal roles early in hematopoiesis, Cdx4 and Hoxb4, were also induced by mMix (Figure 4). Cdx4, a caudal class homeobox gene, regulates the specification of hematopoietic (but not endothelial) progenitors.70 Hoxb4 has been implicated in hematopoietic stem cell proliferation71-74 and confers engraftment potential on ES and yolk sac progenitor cells.42 In keeping with its demonstrated genetic position with respect to Hoxb4,70 activation of Cdx4 preceded that of Hoxb4 in induced i-Mix EBs (Figure 4). Gata1 encodes a zinc finger transcription factor that is essential for normal erythroid development,75 while SY-globin (Hbb-y) is a marker of differentiated primitive erythroblasts. Both genes were activated much earlier and to equivalent (if not higher) levels when i-Mix EBs were cultured in the presence rather than in the absence of inducer (Figure 4), consistent with the observed acceleration of hemoglobin pigmentation in DOX-treated EBs (Figure 3). In agreement with these data, a cDNA microarray analysis of an independent set of induced and uninduced i-Mix EBs revealed that Gata1, ϵY-globin, βmaj-globin, α-globin, and Pecam-1 (the last of which is expressed on hematopoietic stem cells, erythroid and endothelial progenitors, and mature endothelial cells76 ) were all transcribed at significantly higher levels in response to conditional activation of mMix (day 4; M.A. Dyer, S.W., K.E.S. and M.H.B.; unpublished data, June 2004).
Development of hemoglobin pigment is accelerated in response to mMix. Representative photomicrographs are shown for i-Mix EBs cultured for 6, 7, or 8 days in the presence (+DOX) or absence (–DOX) of doxycycline. Scale bar, 200 μm.
Development of hemoglobin pigment is accelerated in response to mMix. Representative photomicrographs are shown for i-Mix EBs cultured for 6, 7, or 8 days in the presence (+DOX) or absence (–DOX) of doxycycline. Scale bar, 200 μm.
Activation of the hemangioblastic and hematopoietic developmental programs is accelerated and enhanced in response to mMix. Quantitative real-time RT-PCR analysis of gene expression in i-Mix EBs cultured with (▪) or without (▦) DOX. Markers of the hemangioblast and genes involved in hematopoiesis were activated in response to induced mMix. Expression was normalized to that of a housekeeping gene (for this figure, Gapdh) and expressed as a ratio. For additional details, see Figure 2.
Activation of the hemangioblastic and hematopoietic developmental programs is accelerated and enhanced in response to mMix. Quantitative real-time RT-PCR analysis of gene expression in i-Mix EBs cultured with (▪) or without (▦) DOX. Markers of the hemangioblast and genes involved in hematopoiesis were activated in response to induced mMix. Expression was normalized to that of a housekeeping gene (for this figure, Gapdh) and expressed as a ratio. For additional details, see Figure 2.
Accelerated and enhanced formation of Flk1+ and c-kit+ cell populations
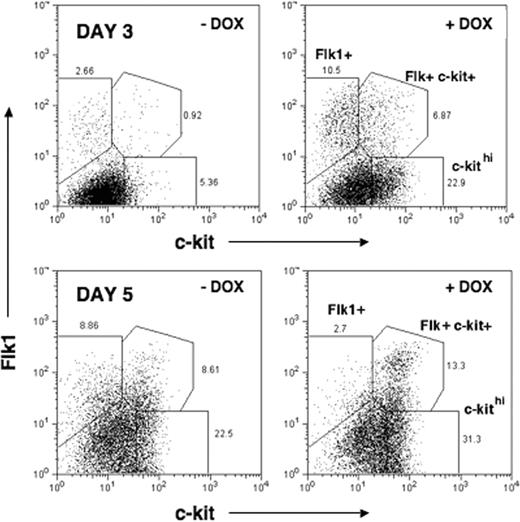
The premature activation of Flk1 and c-kit genes in response to induced mMix led us to evaluate the cell surface expression of Flk1 and c-kit protein using flow cytometry (fluorescence-activated cell sorting [FACS]). In DOX-treated EBs, accelerated and enhanced formation of 3 populations of cells was observed, beginning on day 2 (24 hours after addition of DOX; not shown) and most evident on day 3 (48 hours after DOX) (Figure 5; Table 1): (i) Flk1+ (about 4-fold increase in DOX-treated versus untreated EBs); (ii) Flk1+c-kit+ (more than 4-fold increase); and (iii) c-kithi (about 8-fold increase). Between days 3 and 5, a dramatic decrease in the number of Flk+ cells was observed in DOX-treated EBs (from about 11% to about 3%), whereas this population continued to expand in the uninduced EBs (from about 3% to about 10%). During this period, in both induced and uninduced EBs, increased numbers of Flk+c-kit+ (about 7% to about 13% +DOX; 0.9% to about 10% –DOX) and c-kithi (about 23% to about 31% +DOX; about 5% to about 10% –DOX) cell subsets were found. Therefore, in response to induction of mMix, formation of all 3 populations occurred more rapidly, with the most dramatic acceleration measured for Flk1+ single-positive cells. The Flk1+ and c-kithi populations have been shown to have hemangioblastic and hematopoietic potentials, respectively.39,77 The Flk+c-kit+ double-positive cell population has hematopoietic potential (Marion Kennedy and G.K., manuscript in preparation).
Formation of Flk1+ and c-kit+ cell populations is accelerated and enhanced in response to mMix. FACS analysis of cell surface Flk1 and c-kit protein expression in i-Mix EBs cultured in the presence or absence of DOX for 3 or 5 days (DOX added on day 1). Single-cell suspensions were labeled with anti-Flk1 and –c-kit sera and analyzed by FACS. Parental (wild-type) ES and uninduced (–DOX) i-Mix cells produced comparable numbers of Flk+, c-kithi, and Flk+ckit+ double-positive cells (not shown). This experiment was repeated 3 times with similar results.
Formation of Flk1+ and c-kit+ cell populations is accelerated and enhanced in response to mMix. FACS analysis of cell surface Flk1 and c-kit protein expression in i-Mix EBs cultured in the presence or absence of DOX for 3 or 5 days (DOX added on day 1). Single-cell suspensions were labeled with anti-Flk1 and –c-kit sera and analyzed by FACS. Parental (wild-type) ES and uninduced (–DOX) i-Mix cells produced comparable numbers of Flk+, c-kithi, and Flk+ckit+ double-positive cells (not shown). This experiment was repeated 3 times with similar results.
Mesodermal, hemangioblastic and hematopoietic potentials of i-Mix EBs
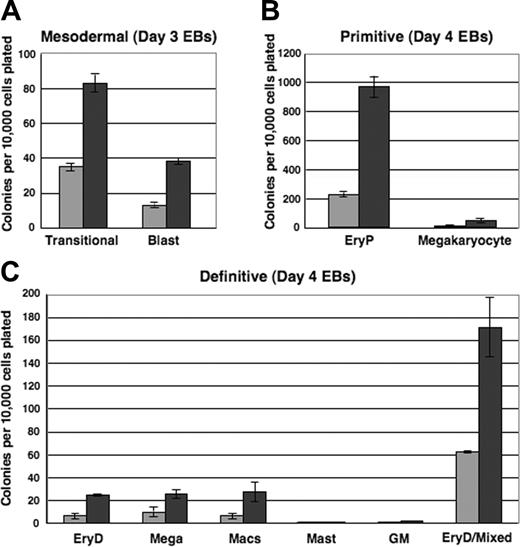
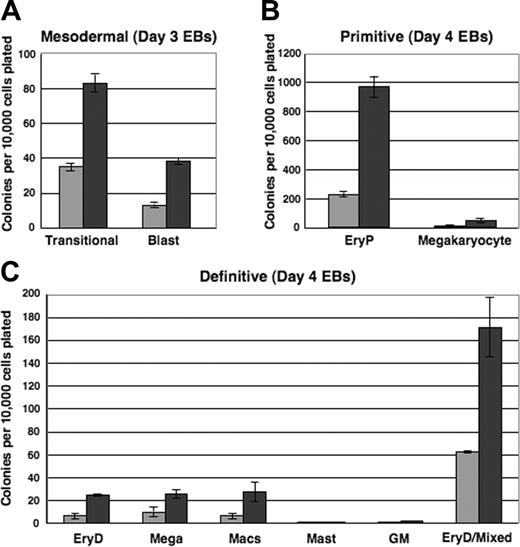
To evaluate the mesodermal, hemangioblastic, and hematopoietic potentials of i-Mix EBs, single-cell suspensions were prepared from EBs harvested after 3, 4, or 5 days and replated in methylcellulose under blast colony or hematopoietic conditions. Colonies were scored on the days indicated (Figure 6). Very strikingly, over all times in culture evaluated (Figure 6 and data not shown), progenitors for each of the hematopoietic lineages formed in consistently larger numbers in the DOX-induced than in uninduced EBs. Therefore, not only was activation of the hematopoietic program accelerated in response to mMix, but the numbers of progenitors were expanded. Transitional mesodermal progenitors of hemangioblasts38 and blast hemangioblast37 colonies formed earlier and in larger numbers in DOX-treated versus untreated secondary cultures (Figure 6A). These colony types were much less abundant by day 5, reflecting their development to hematopoietic and endothelial stem/progenitor cells.37,38,40 Both primitive (erythroid [EryP]; megakaryocyte) and definitive hematopoietic progenitors were found in higher numbers in the DOX-induced cultures (Figure 6B-C). Thus, formation of mesodermal, hemangioblastic, and primitive and definitive hematopoietic progenitors reflected the gene and cell surface protein expression patterns observed for the i-Mix EBs. The primitive and definitive erythroid colonies (EryP and EryD, respectively) that formed after replating of both induced and uninduced EB cells were red, as expected. Conditional activation of mMix did not appreciably alter hematopoietic differentiation: The primitive and definitive colonies from DOX-treated and untreated EBs were morphologically identical.
Mesodermal and hematopoietic progenitor potentials of ES cells are increased in response to mMix.i-Mix EBs were cultured in the presence (▪) or absence (▦) of DOX, harvested on the indicated days, and dispersed to single-cell suspensions. Cells were plated in methylcellulose progenitor assays in triplicate, and colonies were scored as indicated. Colony counts are expressed as mean ± SEM per 10 000 cells plated. (A) Mesodermal progenitors (transitional and blast colonies). EBs were harvested on days 3 and 4 and plated in methylcellulose blast colony cultures. Colonies were scored after 4 days. (B) Primitive erythroid and megakaryocyte colonies. EBs were harvested on day 4 or 5, plated in primitive hematopoietic progenitor cultures, and colonies were scored after 4 or 6 days. (C) Definitive hematopoietic colonies. EBs were harvested on day 4 or 5, plated in Methocult, and scored on day 8 or 10.
Mesodermal and hematopoietic progenitor potentials of ES cells are increased in response to mMix.i-Mix EBs were cultured in the presence (▪) or absence (▦) of DOX, harvested on the indicated days, and dispersed to single-cell suspensions. Cells were plated in methylcellulose progenitor assays in triplicate, and colonies were scored as indicated. Colony counts are expressed as mean ± SEM per 10 000 cells plated. (A) Mesodermal progenitors (transitional and blast colonies). EBs were harvested on days 3 and 4 and plated in methylcellulose blast colony cultures. Colonies were scored after 4 days. (B) Primitive erythroid and megakaryocyte colonies. EBs were harvested on day 4 or 5, plated in primitive hematopoietic progenitor cultures, and colonies were scored after 4 or 6 days. (C) Definitive hematopoietic colonies. EBs were harvested on day 4 or 5, plated in Methocult, and scored on day 8 or 10.
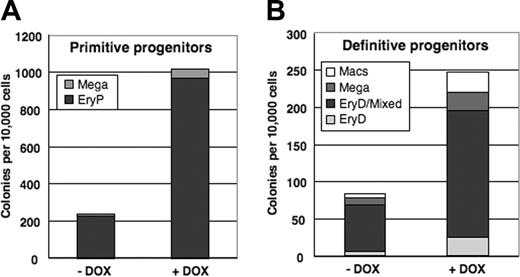
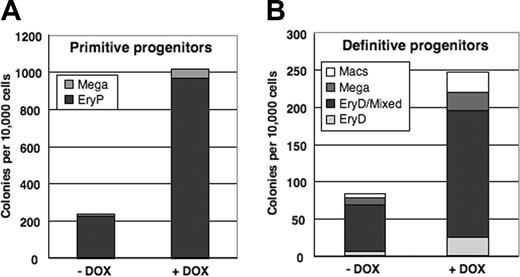
To determine whether conditional activation of mMix influences cell fate decisions within the hematopoietic lineage, the data from Figure 6B-C were replotted in stacked column form to emphasize the representation of each lineage among colonies scored (Figure 7). The frequencies of hematopoietic colony types were very similar for induced and uninduced EBs, indicating that conditional expression of mMix does not bias development toward specific hematopoietic lineages.
Discussion
Gastrulation is a complex process in which changes in the adhesive and migratory properties of cells within the epiblast lead to the ingression of ectodermal cells through the primitive streak and their eventual recruitment to the mesodermal germ layer. The mouse Mix-like gene is essential for normal gastrulation,35 though its specific function(s) in this process remains to be worked out. The embryonic stem (ES) cell differentiation system recapitulates a number of aspects of early mouse embryogenesis, including formation of a variety of mesodermal lineages under appropriate conditions in culture.40 We have developed a model for conditional expression of mMix in differentiating ES cells. Our gain-of-function studies reveal that, while mMix is apparently not required for the induction of mesoderm (as suggested by the observed expression of Brachyury/T and Nodal in mMix-deficient embryos35 ), it is sufficient to accelerate the formation of mesoderm prior to expression of T in ES cell–derived embryoid bodies. Gene transcriptional analysis indicated a rapid and ordered progression of mesoderm development upon conditional expression of mMix. For example, activation of primitive streak genes was followed by up-regulation of markers of lateral, axial, and paraxial mesoderm. Similarly, expression of hemangioblast markers was detected very early and preceded that of hematopoietic genes. To our knowledge, these studies represent the first demonstration that conditional expression of a single gene is sufficient to accelerate development in the embryoid body system.
Conditional activation of mMix does not alter cell fate decisions within the hematopoietic lineage. (A) Primitive hematopoietic (EryP and megakaryocyte) colonies formed in methylcellulose progenitor assays upon replating of day 4 i-Mix EBs cultured in the presence or absence of DOX. The colonies were scored after 6 days. (B) Definitive hematopoietic colonies formed upon replating in methycellulose of day 4 i-Mix EBs cultured in the presence or absence of DOX. The colonies were scored after 8 days.
Conditional activation of mMix does not alter cell fate decisions within the hematopoietic lineage. (A) Primitive hematopoietic (EryP and megakaryocyte) colonies formed in methylcellulose progenitor assays upon replating of day 4 i-Mix EBs cultured in the presence or absence of DOX. The colonies were scored after 6 days. (B) Definitive hematopoietic colonies formed upon replating in methycellulose of day 4 i-Mix EBs cultured in the presence or absence of DOX. The colonies were scored after 8 days.
Interestingly, down-regulation of Rex1 (Zfp-42) was slightly delayed in DOX-induced EBs. Rex1 is expressed in the ICM of preimplantation embryos, trophectoderm, spermatocytes, and ES cells.78,79 Although Rex1, like Oct3/4 and Nanog, is considered a marker of stem cell pluripotency,80 its expression is not restricted to cells of the ICM and ES cells, as initially believed.78,79 RNA and protein have been detected in more restricted progenitor cell populations as well, including CD34+ cells and multilineage progenitors from adult bone marrow or cord blood,81-83 spermatocytes prior to maturation to spermatozoa,79 and an ES line committed to the endothelial lineage.84 Rex1 is downstream from and is regulated by Oct4.85,86 The persistence of Rex1 expression suggests the interesting possibility that Rex1 may have a previously unappreciated function in commitment of at least some populations of early mesoderm. Whether mMix and Rex1 are expressed in the same or overlapping cell populations is currently under investigation.
The changes in response to early activation of mMix were not solely a reflection of altered developmental timing, because significantly increased numbers of mesodermal progenitors with hemangioblastic and hematopoietic potentials were found. Thus, the mouse Mix-like gene can regulate mesodermal development. Notably, in the mouse embryo, commitment to hemangioblasts is initiated prior to or during the emergence of their mesodermal progenitors from the posterior streak,41 where mMix expression is first detected within the epiblast (mMix is not expressed in the yolk sac32-34 ).
Loss-of-function studies have demonstrated that mMix is required for normal development of the node, notochord, axial mesendoderm, allantois, and heart.35 Although blood islands apparently form in the yolk sac,35 mMix-null mutant EBs do show hematopoietic abnormalities. Analysis of mMix-deficient embryos has not yet been reported but should reveal whether more subtle defects (eg, reduced numbers of primitive erythroid progenitors) are present in these mutants.
Previous studies in the frog and zebrafish have established Mix/Bix genes as determining factors in endoderm formation.16,18-20,22,24,28 Chimera analysis has revealed a crucial role for mMix in endoderm differentiation in the mouse embryo.35 However, mMix expression has not been detected in definitive endoderm.34 Therefore, mMix may have a non–cell-autonomous role in mesoderm that serves to modulate endodermal differentiation, or it may function cell-autonomously within a transient population of mesendodermal progenitors.34 When ectopically expressed in frog embryos, the mouse Mix gene was found to activate endodermal but not mesodermal markers.34 The human HMIXL gene could activate Xenopus αT4-globin in animal cap assays if basic fibroblast growth factor (bFGF) were used to induce mesoderm,87 indicating that HMIXL could drive mesoderm to a hematopoietic fate.
One model that could be envisioned to explain the results of our conditional activation studies is that mMix controls cell fate choice in mesendoderm, forcing the formation of mesoderm at the expense of endoderm in the DOX-treated EBs. However, even when mesoderm formation was accelerated, a later wave of endodermal gene expression (Foxa2/Hnf3β, Sox17, Gata4, and Hnf4; A.A.-S., S.W., K.E.S., and M.H.B.; unpublished data, February 2004) was still observed. These findings, together with gene targeting analyses that demonstrated formation of mesoderm and definitive endoderm in the absence of mMix,35 would suggest that mMix does not regulate a simple mesoderm versus endoderm fate decision during gastrulation.
Conditional activation of mMix in differentiating ES cells led to rapid up-regulation of gsc. In the frog, gsc is a direct target of XMix.1 and represses transcription of the Brachyury/T homolog, Xbra.28 XMix.1 is therefore thought to function indirectly in the negative regulation of Xbra.28 Genetic ablation of mMix in the mouse resulted in an expanded domain of T expression, again suggesting direct or indirect suppression.35 However, in differentiating i-Mix ES cells, induction of mMix was followed by early activation of T. Like all of the known vertebrate members of the Mix/Bix family, the mouse Mix protein contains a highly conserved region of polar and acidic residues toward the carboxy terminus. This region has the potential to form an amphipathic helix (a characteristic of many transcriptional activators) and is part of a larger region that can activate transcription in yeast 2-hybrid assays.29 It is entirely possible that, like many other transcription factors, mMix can function as an activator or a repressor depending on the cellular context (eg, through differential recruitment of coactivators and corepressors). Indeed, microarray analysis of induced and uninduced i-Mix EBs revealed dynamic changes in gene expression (both up- and down-regulation) within 24 hours of addition of DOX (M.A. Dyer, S.W., K.E.S., and M.H.B.; unpublished data, June 2004). The inducible cell lines described here will provide a useful model for the identification of mMix target genes.
We conclude that induction of mMix results in the increased recruitment or expansion of mesodermal progenitors for hemangioblastic and hematopoietic lineages. The accelerated expression of markers of other types of early mesoderm suggests the possibility that the representation of other mesodermal lineages might also be increased in response to mMix, given appropriate conditions for their differentiation in culture. To clarify this issue, we have initiated a systematic analysis of the effect of induction of mMix at different times during EB development. An understanding of mesoderm lineage specification and differentiation at the earliest stages of embryoid body development in culture may provide valuable insights into the corresponding processes in the embryo and will be crucial for the directed differentiation of progenitors for cell-based therapies in humans.
Prepublished online as Blood First Edition Paper, January 10, 2006; DOI 10.1182/blood-2005-10-4120.
Supported by grants from the National Institutes of Health (NIH; RO1 HL62248, DK52191, and EB02209) (M.H.B).
S.W. and A.A.-S. contributed equally to this paper.
The online version of this article contains a data supplement.
The publication costs of this article were defrayed in part by page charge payment. Therefore, and solely to indicate this fact, this article is hereby marked “advertisement” in accordance with 18 U.S.C. section 1734.
We are grateful to M. A. Dyer and M. R. Young for technical advice. We thank M. A. Dyer, S. Sokol, D. Sternberg, and D. C. Weinstein for thoughtful comments on the manuscript.


