Abstract
Integrative genomic and gene-expression analyses have identified amplified oncogenes in B-cell non-Hodgkin lymphoma (B-NHL), but the capability of such technologies to localize tumor suppressor genes within homozygous deletions remains unexplored. Array-based comparative genomic hybridization (CGH) and gene-expression microarray analysis of 48 cell lines derived from patients with different B-NHLs delineated 20 homozygous deletions at 7 chromosome areas, all of which contained tumor suppressor gene targets. Further investigation revealed that only a fraction of primary biopsies presented inactivation of these genes by point mutation or intragenic deletion, but instead some of them were frequently silenced by epigenetic mechanisms. Notably, the pattern of genetic and epigenetic inactivation differed among B-NHL subtypes. Thus, the P53-inducible PIG7/LITAF was silenced by homozygous deletion in primary mediastinal B-cell lymphoma and by promoter hypermethylation in germinal center lymphoma, the proapoptotic BIM gene presented homozygous deletion in mantle cell lymphoma and promoter hypermethylation in Burkitt lymphoma, the proapoptotic BH3-only NOXA was mutated and preferentially silenced in diffuse large B-cell lymphoma, and INK4c/P18 was silenced by biallelic mutation in mantle-cell lymphoma. Our microarray strategy has identified novel candidate tumor suppressor genes inactivated by genetic and epigenetic mechanisms that substantially vary among the B-NHL subtypes.
Introduction
The B-cell non-Hodgkin lymphomas (B-NHLs) comprise various distinct clinicopathologic entities that in most instances are characterized by recurrent chromosomal translocations involving the immunoglobulin (IG) gene loci.1 IG chromosomal translocations are thought to be early events in the pathogenesis of these malignancies and result in deregulated expression of a variety of oncogenes involved in cell proliferation, differentiation pathways, and apoptosis regulation. Transgenic mouse models have shown a pattern of heterogeneity for these oncogenes to drive malignancy in vivo. For example, mice with deregulated expression of MYC or BCL6 oncogenes were shown to develop tumors displaying features typical of human Burkitt or diffuse large B-cell lymphomas, respectively.2,3 However, aberrant expression of other oncogenes in mice such as BCL2 or CCND1 was not sufficient for spontaneous lymphoma formation, needing the accumulation of other genetic aberrations for the acquisition of the full malignant phenotype.4-6
In humans, comparative genomic hybridization (CGH) and CGH to microarray techniques have identified recurrent regions of amplification and deletion in tumors, many of which are predicted to encode oncogenes and tumor suppressor genes that are important for lymphomagenesis in addition to the initial chromosomal translocation.7-13 The impact of DNA amplification on gene-expression variation has been investigated at the genome scale in breast cancer,14 lung cancer,15 pancreatic adenocarcinoma,16 and B-cell lymphoma.17,18 These and other reports led to the positional identification of overexpressed genes mapped at the peaks of amplification in tumor cells.8,17,19-22 However, the capability of array-based CGH combined with gene-expression microarrays to carry out genome-wide screens for regions of deletion that may harbor putative tumor suppressor genes in B-NHL has not been explored yet.
To discover tumor suppressor genes with previously unknown relevance in lymphoma that may be silenced by homozygous deletion, we have used an integrative genomic approach with high-resolution BAC array CGH and gene-expression–profiling microarrays that were applied to a panel of 48 cell lines derived from patients with the different B-NHL subtypes.23,24 Our data demonstrate that array CGH combined with gene-expression profiling provide a rationale for discovering tumor suppressor genes in regions of homozygous loss. These target genes show different patterns of gene inactivation that vary among the B-NHL subtypes.
Materials and methods
Tumor cell lines
A panel of 48 cell lines derived from patients comprising the various subtypes of B-NHL was studied: Granta519, HBL2, SP49, Z138, REC1, NCEB1, JVM2, UPN1, UPN2, SP53, JEKO1, and IRM2 (mantle cell lymphoma [MCL]; n = 12); OZ, VAL, Karpas422, DOHH2, Karpas353, PR1, OCI-LY8, Karpas231, SUDHL6, ROS-50, RL, SCI-1, BEVA, Granta 452, and Granta 380 (diffuse large B-cell lymphoma with the translocation t(14;18)(q32;q21); n = 15); MD901, MD903, RIVA, CTB1, RCK8, and CIPULLO (diffuse large B-cell lymphoma lacking t(14;18)(q32;q21) translocation; n = 6); ELIJAH, NAB2, PL29018, SERAPHINA, Wien-133, P32, BALM9, CA46, Namalwa, BL41, and KHM10B (Burkitt lymphoma; n = 11); SSK41 and Karpas1718 (marginal zone lymphoma); and Karpas1106 and MEDB1 (primary mediastinal B-cell lymphoma).
Cytogenetic analysis
Twenty-five of the cell lines (those underlined) were studied by G-banding cytogenetics and standard CGH to chromosomes (s-CGH). Fifteen of the cell lines showed a complex karyotype. In them, additional color cytogenetic analysis, including cross-species color banding (RxFISH; Cambio, Cambridge, UK), spectral karyotyping (SKY; Applied Spectral Imaging, Migdal Haemek, Israel), and/or multicolor fluorescence in situ hybridization (FISH) (SpectraVysion; Vysis, Downers Grove, IL) were performed.
Fluorescence in situ hybridization
To classify the cell lines into clinical-pathologic B-NHL subgroups according to chromosomal translocations and to confirm the DNA copy number changes obtained from array-CGH studies, FISH analysis using individual probes was performed on fixed cells from selected cell lines. These BAC/PAC probes corresponded to IGH, CCND1, BCL2, BCL6, MALT1, MYC, and CDK6 gene loci. In addition, BACs RP11-233N20 (3q29), RP11-215F02 (11p13), RP11-89M8 (8p21.3), and RP11-165N12 (13q31.3) were also used. To further delineate the 16p13.13 genomic deletion, we also hybridized BACs RP11-89D3, RP11-109M19, RP11-66H6, RP11-396B14, RP11-547D14, RP1149M6, RP11-394B14, and RP11-165B11 in cells from the Karpas 1106 cell line. These clones were purchased from Research Genetics (Huntstville, AL), Vysis, or RZPD German Resource Center (Berlin, Germany).
Microarray-based comparative genomic hybridization and data analysis
Genome-wide analysis of DNA copy number changes of the 48 cell lines was performed using array CGH on a microchip with approximately 2.400 BAC and P1 clones in triplicate. The array provides an average resolution of 1.4 Mb (megabase) across the genome. Production and validation of the array, hybridization methods, and analytic procedures have been described elsewhere.9,23 For delineation of common regions of imbalance in the lymphoma genomes, the position of the BAC/PACs on the draft human genome sequence according to the May 2004 freeze was used (http://genome.cse.ucsc.edu). For visualization of genomic data, the TreeView program 1.60 (Stanford, CA) was used. Microarray data has been deposited in GEO database (GSE5316, GPL3789, and GPL3993).
Gene-expression microarray analysis
To investigate the level of expression of the genes mapped across the common regions of genomic gain and loss, the “Lymphochip” cDNA microarrays (created by Dr Lou Staudt, NIH, Bethesda, MD) were used for the gene-expression profiling of 32 of the B-NHL cell lines, as previously reported.24 In 8 MCL cell lines (Granta 519, HBL2, SP49, NCEB1, JVM2, UPN1, JEKO1, and IRM2), Affymetrix (Santa Clara, CA) Gene Chips Human Genome U133 microarray studies were also performed according to the manufacturer's instructions.
Real-time quantitative polymerase chain reaction (QRT-PCR)
To validate the data from the cDNA microarrays for CDK6 and NOXA, the same RNA aliquots used in the cDNA microarray analysis were studied using QRT-PCR, as previously described.21 To study the expression levels of PIG7/LITAF and BIM, QRT-PCR was performed in an ABI PRISM 7500 Sequence Detection System (Applied Biosystems, Weitersadt, Germany) using the Assay-on-Demand Gene Expression product for PIG7/LITAF (ABI-Hs.00191583) and BIM (ABI-Hs.00197982). The mRNA expression was normalized by using GAPDH gene product as endogenous control of expression (ABI-Hs.99999905).
Delineation of homozygous deletions
To confirm homozygous deletion according to array CGH data, PCR on genomic DNA was performed in the corresponding cell lines. Additional primer sets were designed and applied to further narrow the regions of deletion.
Western blotting of cell lines and primary B-NHL samples
A number of deregulated genes (CDK6, PIG7/LITAF, NOXA, BCL6, INK4c/P18, and BIM) were selected for Western blot analysis in the B-NHL cell lines and biopsies from patients with B-NHL. Cellular proteins were extracted with a buffer containing protease inhibitors (1% aprotinin, 2 mM phenylmethylsulfonyl fluoride, and 10 μg/mL leupeptin) and a phosphatase inhibitor (2 mM sodium orthovanadate). Equal amounts of protein from each sample (50 μg) were separated on sodium dodecyl sulfate–polyacrylamide gel electrophoresis (SDS-PAGE) gels, and electrotransfered to nitrocellulose membranes. Finally, membranes were incubated with primary antibodies followed by secondary antibodies conjugated to horseradish peroxidase, which was detected by chemiluminescence (Pierce, Rockford, IL). The following proteins were analyzed: CDK6 and PIG7/LITAF (BD Biosciences, San Diego, CA); NOXA (Oncogene Research Products, Boston, MA); BIM (Stressgen, Victoria, Canada); INK4c/P18 (Santa Cruz Biotechnology, Santa Cruz, CA), and BCL6 (DakoCytomation, Glostrup, Denmark). To evaluate equal protein transfer, detection of Actin (Oncogene Research Products), β-tubulin (Sigma, St Louis, MO), or staining with Ponceau S (Sigma-Aldrich, St Louis, MO) were performed. Protein extracts from B cells obtained from 2 nontumoral tonsils and 2 spleens were also analyzed.
Mutation analysis of NOXA, PIG7/LITAF, INK4C/P18, and BIM
For mutational analysis of NOXA, genomic DNA was extracted from the 48 cell lines, biopsy samples from 106 patients with different B-NHL subtypes, and 50 peripheral-blood samples from healthy donors. Sets of primers were designed to amplify the coding region, including each splicing site and 650 bp (base pair) of the promoter, which included the possible P53 response element. For mutational analysis of PIG7/LITAF and BIM, the entire coding region and each splicing site were amplified in 48 cell lines and 15 patients with different B-NHL subtypes. For mutational analysis of INK4c/P18, the coding region was analyzed in the B-NHL cell lines as well as in 20 MCL biopsies. PCR products were directly sequenced by using an ABI 3730 Genetic Analyzer sequencer (Applied Biosystems). NOXA gene sequence changes in B-NHL cell lines and patient samples; the nucleotide positions of NOXA are based on GenBank accession sequence NM_021127. The nucleotide positions of PIG7/LITAF are based on GenBank accession sequence NM_004862, BIM on GenBank accession sequence NM_138621, and INK4c/P18 on GenBank accession sequence NM_001262.
Methylation analysis of NOXA, INK4C/P18, PIG7/LITAF, and BIM promoters
Genomic DNA (1 μg) was treated with bisulfite using the CpGenomic DNA Modification Kit (Intergen, Purchase, NY). Sequence primers for the methylation-specific PCR (MSP) analysis were designed in the 5′ untranslated region CpG island of the published sequences near translation start site. CpGenome Universal Methylated DNA (Serogicals Millipore, Billerica, MA) bisulfite-modified was used as a positive control. To evaluate demethylation, cells were treated with 4 μM of the demethylating agent 5-aza-2-deoxycitidine (Sigma); after incubation for 96 hours, cells were harvested for MSP, RT-PCR, and Western blotting. For sequencing analysis, both PIG7/LITAF and BIM promoters were amplified by nested-PCR after bisulfite modification. Amplification products obtained in the second PCR reaction were subcloned into pCR 4-TOPO plasmid using TOPO TA Cloning Kit for Sequencing (Invitrogen Life Technologies, Paisley, United Kingdom) and transformed into Escherichia coli according to the manufacturer's recommendations. Colonies with recombinant plasmids containing the described PCR products were screened by digestion with EcoRI (Amersham Biosciences, Buckinghamshire, United Kingdom). Candidate plasmid clones were sequenced. Primers for delineation homozygous deletions, genomic sequencing, QRT-PCR, methylation-specific PCR, and sequencing after sodium bisulfite are shown in Table S1 (available on the Blood website; see the Supplemental Materials link at the top of the online article).
PS341 sensitivity assays
Exponentially growing cells were plated at 1 × 10⁶ cells/mL RPMI medium in 24-well microtiter plates. The proteosome inhibitors PS341 (bortezomib) at concentrations of 10 and 100 nM and MG132 at 1000 nM were added. After 6, 24, and 48 hours, apoptotic cells were quantified by staining with fluorescein isothiocyanate (FITC)–conjugated Annexin V and propidium iodide according to the manufacturer's instructions (BD Pharmingen, San Diego, CA). Cell fluorescence was detected on a FACScalibur (Becton Dickinson, Franklin Lakes, NJ). A minimum of 10 000 cells were acquired and analyzed using Cell Quest analysis software (BD Biosciences, San Diego, CA). All experiments were performed at least in triplicate.
Tissue microarray study of B-NHL patient samples
Pretreatment samples from 367 patients with B-NHL were analyzed using immunohistochemistry (IHC) on tissue microarrays (TMAs) using a Tissue Arrayer device (Beecher Instruments, Silver Spring, MD) as previously described.25 Duplicated cylinders from follicular lymphoma (72 cases), MCL (103 cases), diffuse large B-cell lymphoma (67 cases), splenic marginal zone lymphoma (77 cases), and B-cell chronic lymphocytic leukemia (48 cases) were included. Antibodies for NOXA, CD10, BCL2, MUM1, BCL6, LITAF, INK4c/P18, and BIM were used. Informed consent was obtained from each subject or subject's guardian, in accordance with the Declaration of Helsinki. Human investigations were performed after approval by the University of Navarra (Pamplona, Spain) institutional review board on scientific and ethical affairs.
Acquisition of micrograph images was performed by using an Olympus AX70 microscope (Olympus, Center Valley, PA) equipped with the following objective lenses: UPlan Apo 4×/0.70 (Figure 5D, left panel); UPlan Apo 10×/0.70 (Figures 1D, top panel and 4E, left panel); and Uplan Apo 40×/1.40 (Figures 1D, bottom panel; 4E, middle and right panels; and 5D, three rightmost panels). Image capture was performed with an Olympus DP70 camera and DPController 2.2.1.227 software (Olympus). Immunodetection of IHC staining in Figures 1D, 4E, and 5D was performed with the LSAB Visualization System (DAKO, Glostrup, Denmark) using diaminobenzidine chromogen as substrate and counterstaining with hematoxylin.
Results
High resolution analysis of B-NHL genomes
We performed genome-wide scanning for DNA copy number changes in 48 B-NHL cell lines using high-resolution array CGH (Figure S1; Table S2). Eighty-eight high-level amplification events (defined by ≥ 4-fold DNA copy number increase) were detected, ranging from 4- to 11-fold increase and affecting 46 different chromosomal regions (Table S3). In addition to high-level amplifications, the most common regions of low-level genomic overrepresentation were detected at chromosome bands 7q21.13-q21.3 (25 of 48 cell lines, 52%), 7q22.1 (48%), 7p11.2-p22.3 (44%), 8q24.1 (42%), 13q31.3-q32.3 (38%), 1q21.2-q25.1 (31-33%), 12q13.13 (29%), 18q21.1-q21.32 (27%), and Xq26.3-q28 (27%). Array CGH delineated the most frequent heterozygous genomic losses at bands 9p21.3-p22.1 (19 of 48 cell lines, 40%), 8p21.3 (29%), 17p13.1-p13.3 (29%), 17p13.1-q11.2 (27%), 11q24.2-q25 (25%), and 6q23.2-q24.1 (23%) (Figure S2). In addition, 20 homozygous deletions involving 7 different chromosome areas were identified (Table 1).
Then we applied gene-expression profiling to the cell lines and searched for genes located within areas of genomic aberration that presented deregulated expression. To validate our strategy, we sought to identify critical oncogenes known to be recurrently amplified in lymphoma, most of which presented convergent high-level amplification and elevated expression in the B-NHL cell lines.7,8,11 As representative examples, BCL2 at chromosome 18q21.3, BCL6 (3q27.3), REL and BCL11A (both in 2p16), and CDK4 (12q14.1) genes were consistently overexpressed in cell lines with respective high-level amplification. In addition, novel gene amplifications of the oncogenes CDK6 and PIM1 were identified in the marginal zone lymphoma cell line SSK41 and in the MCL cell line JEKO, respectively (Figure S3).
Homozygous deletions localize potential tumor suppressor genes
Next, we explored whether coupled analysis of gene expression and DNA copy number variation might identify candidate tumor suppressor genes by pinpointing transcripts with reduced expression related to homozygous losses. Array CGH detected 20 homozygous deletions involving 7 different chromosome regions; these biallelic losses were confirmed by PCR analysis of BAC/PAC sequences and/or contained genes. These deletions ranged in size from 6 kb to 2 Mb (Table 1). The most frequent homozygous loss encompassed chromosome band 9p21.3 at the INK4a/ARF locus and was found in 8 B-NHL cell lines of different origins: 2 MCL (REC1 and Z138), 5 diffuse large B-cell lymphomas with t(14;18) (OZ, Karpas 353, DOHH2, MD903, and Granta 452), and 1 diffuse large B-cell lymphoma without t(14;18) (MD901). In addition, INK4a/ARF locus was deleted in 1 copy in 11 cell lines (7 MCL, 2 diffuse large B-cell lymphoma, 1 Burkitt lymphoma, and 1 marginal zone lymphoma). These data are coincident with previous studies reporting INK4a gene as a common site of deletion and promoter methylation in B-cell malignancies.7,9,18,26,27 In the Burkitt lymphoma cell line P32, homozygous loss of 3p14.2 comprised the tumor suppressor gene FHIT.28 Both INK4a and FHIT are well-known tumor suppressor genes involved in B-NHL pathogenesis, which indicated that our strategy might represent a valid approach for localizing novel tumor suppressor genes.
The P53-inducible gene PIG7/LITAF is silenced by homozygous deletion and promoter methylation in B-cell lymphoma
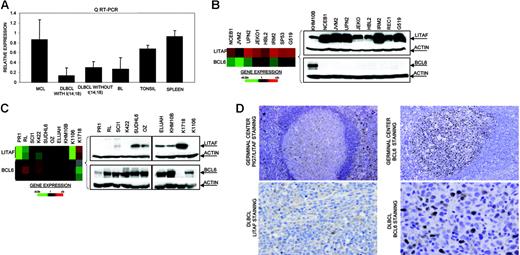
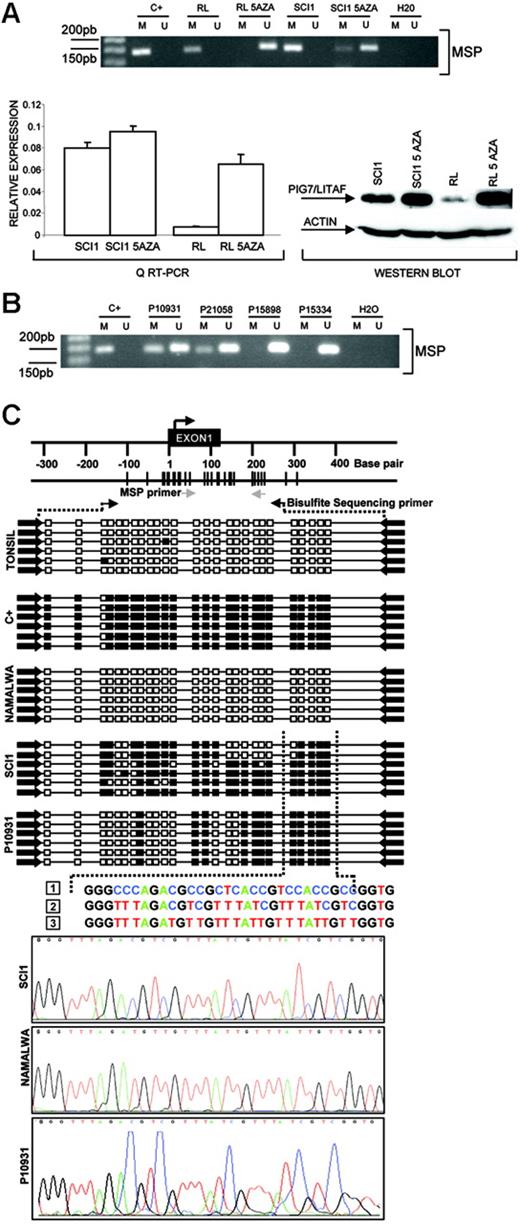
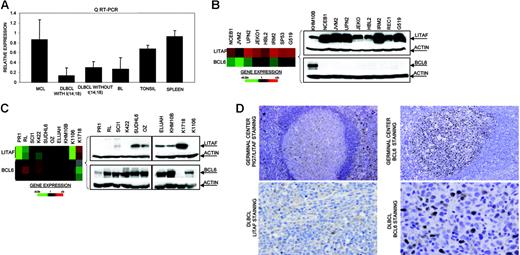
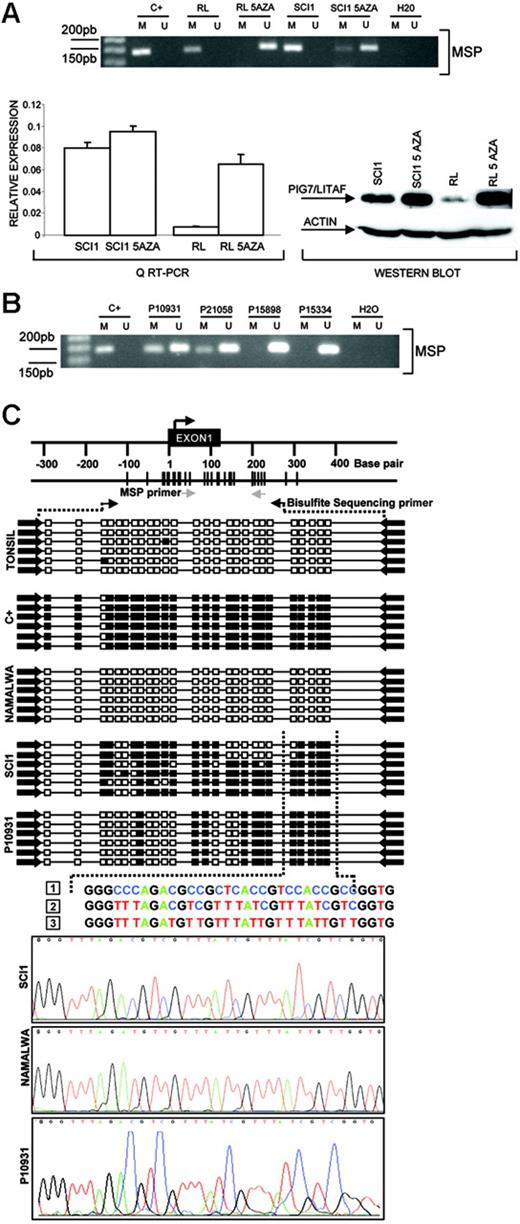
In the Karpas 1106 cell line derived from a patient with primary mediastinal B-cell lymphoma, we identified homozygous deletion of chromosome 16p13.13. This deletion included PIG7/LITAF and SOCS1 genes, both of which showed null expression in the cDNA microarrays. Interestingly, biallelic mutation of SOCS1 was recently reported in patients with primary mediastinal B-cell lymphoma.29 In addition, PIG7/LITAF was also considered as a candidate tumor suppressor gene, because of its P53 inducibility and capability to regulate apoptosis.30,31 We performed mutational screening of PIG7/LITAF coding sequences in the cell lines and primary B-NHL tumors, but no pathogenic mutations were identified. Expression analysis of PIG7/LITAF by QRT-PCR and Western blot showed that PIG7/LITAF was highly expressed in nontumoral tonsil and spleen samples, presenting comparable levels with MCL cells, whereas its expression was much lower in germinal center–derived lymphomas (Figure 1A) Notably, expression of PIG7/LITAF was inversely correlated with BCL6 expression in normal germinal center cells as well as in most of the examined cell lines at the RNA and protein levels (Figure 1B-D). A recent report suggested that the proto-oncogene BCL6 may repress PIG7/LITAF through the transcription factor MIZ-1 in germinal center B cells.32 To investigate the possible pathologic mechanism responsible for the decreased expression of PIG7/LITAF in some lymphoma subsets, we analyzed promoter methylation of PIG7/LITAF. Five (14%) of 37 cell lines and 10 (13%) of 80 B-NHL biopsies showed promoter methylation (Figure 2A-B). Remarkably, PIG7/LITAF silencing was observed in diffuse large B-cell lymphoma (9 cases) and Burkitt lymphoma (6 cases). A detailed mapping of CpG-methylation of the promoter by bisulfite genomic sequencing confirmed these data (Figure 2C). Methylation of PIG7/LITAF however was not observed in normal B cells from spleen, blood, or tonsils (Figure 2C; data not shown). Treatment with Aza induced reexpression of PIG7/LITAF in methylated cell lines (Figure 2A). IHC on tissue microarrays from 48 patients with diffuse large B-cell lymphoma biopsies confirmed the opposite expression of PIG7/LITAF and BCL6. Among 7 cases that showed no expression of BCL6, 6 (86%) presented expression of PIG7/LITAF, whereas PIG7/LITAF was expressed in 24 (59%) of 41 cases with BCL6 expression (Figure 1D). Our data indicate that PIG7/LITAF may become inactivated by promoter methylation in a subset of diffuse large B-cell lymphoma and Burkitt lymphoma.
Identification of homozygous deletion and expression of PIG7/LITAF. (A) Real-time RT-PCR analysis of PIG7/LITAF expression in samples from tonsil and spleen and in B-NHL cell lines (10 MCL cell lines; 11 diffuse large B-cell lymphoma cell lines with t14:18), 3 diffuse large B-cell lymphoma cell lines lacking t(14;18), and 6 Burkitt lymphoma cell lines. Data shown are the relative gene-expression levels normalized with GAPDH bars indicate standard deviations. The results are derived from 3 independent experiments. DLBCL indicates diffuse large B-cell lymphoma; BL, Burkitt lymphoma. (B) Affymetrix oligonucleotide microarrays and Western blot analyses of PIG7/LITAF and BCL6 in MCL cell lines. KHM10B cell line was used as a positive control for BCL6 expression. (C) Lymphochip cDNA microarrays and Western blot analyses of PIG7/LITAF and BCL6 in B-NHL cell lines of different origins. (D) Immunohistochemistry analysis for PIG7/LITAF and BCL6 protein on tissue microarrays. In nontumoral tissue samples (tonsils), PIG7/LITAF expression was cytoplasmatic and was shown to be expressed mostly in mantle, marginal, and interfollicular lymphocytes, whereas BCL6 was shown to be expressed in germinal center B cells.
Identification of homozygous deletion and expression of PIG7/LITAF. (A) Real-time RT-PCR analysis of PIG7/LITAF expression in samples from tonsil and spleen and in B-NHL cell lines (10 MCL cell lines; 11 diffuse large B-cell lymphoma cell lines with t14:18), 3 diffuse large B-cell lymphoma cell lines lacking t(14;18), and 6 Burkitt lymphoma cell lines. Data shown are the relative gene-expression levels normalized with GAPDH bars indicate standard deviations. The results are derived from 3 independent experiments. DLBCL indicates diffuse large B-cell lymphoma; BL, Burkitt lymphoma. (B) Affymetrix oligonucleotide microarrays and Western blot analyses of PIG7/LITAF and BCL6 in MCL cell lines. KHM10B cell line was used as a positive control for BCL6 expression. (C) Lymphochip cDNA microarrays and Western blot analyses of PIG7/LITAF and BCL6 in B-NHL cell lines of different origins. (D) Immunohistochemistry analysis for PIG7/LITAF and BCL6 protein on tissue microarrays. In nontumoral tissue samples (tonsils), PIG7/LITAF expression was cytoplasmatic and was shown to be expressed mostly in mantle, marginal, and interfollicular lymphocytes, whereas BCL6 was shown to be expressed in germinal center B cells.
Promoter methylation of PIG7/LITAF. (A) Methylation-specific PCR (MSP), quantitative RT-PC, and Western blot analysis of PIG7/LITAF in RL and SCI-1 cell lines before and after treatment with 4 μM 5-Aza-2′-deoxycitine. The treatment with demethylating Aza restored PIG7/LITAF expression at the RNA and protein levels. In the QRT-PCR data analysis, gene-expression levels were normalized with GAPDH as an internal control; bars indicate standard deviations. C+ indicates methylated control. (B) Methylation-specific PCR (MSP) in 4 primary biopsies from patients with Burkitt lymphoma. M indicates methylated; U, unmethylated; C+, methylated control. (C) Sequence analysis of the PIG7/LITAF promoter region after bisulfite modification. The black box indicates the methylated cytosine, and the white box indicates the unmethylated cytosine in the dinucleotide CpG. Samples analyzed were a positive methylated control (C+); cells from a nontumoral tonsil (unmethylated); Namalwa (unmethylated); SCI-1 (unmethylated); and a lymph-node biopsy from a patient with Burkitt lymphoma (P10931) showing methylation. The numbers correspond to (1) genomic sequence of PIG7/LITAF promoter region, (2) methylated sequence of the PIG7/LITAF promoter region after bisulfite modification, and (3) unmethylated sequence of the PIG7/LITAF promoter region after bisulfite modification.
Promoter methylation of PIG7/LITAF. (A) Methylation-specific PCR (MSP), quantitative RT-PC, and Western blot analysis of PIG7/LITAF in RL and SCI-1 cell lines before and after treatment with 4 μM 5-Aza-2′-deoxycitine. The treatment with demethylating Aza restored PIG7/LITAF expression at the RNA and protein levels. In the QRT-PCR data analysis, gene-expression levels were normalized with GAPDH as an internal control; bars indicate standard deviations. C+ indicates methylated control. (B) Methylation-specific PCR (MSP) in 4 primary biopsies from patients with Burkitt lymphoma. M indicates methylated; U, unmethylated; C+, methylated control. (C) Sequence analysis of the PIG7/LITAF promoter region after bisulfite modification. The black box indicates the methylated cytosine, and the white box indicates the unmethylated cytosine in the dinucleotide CpG. Samples analyzed were a positive methylated control (C+); cells from a nontumoral tonsil (unmethylated); Namalwa (unmethylated); SCI-1 (unmethylated); and a lymph-node biopsy from a patient with Burkitt lymphoma (P10931) showing methylation. The numbers correspond to (1) genomic sequence of PIG7/LITAF promoter region, (2) methylated sequence of the PIG7/LITAF promoter region after bisulfite modification, and (3) unmethylated sequence of the PIG7/LITAF promoter region after bisulfite modification.
The proapoptotic protein BIM is silenced by different genetic and epigenetic mechanisms in various B-NHL subtypes
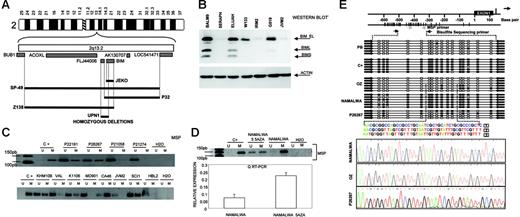
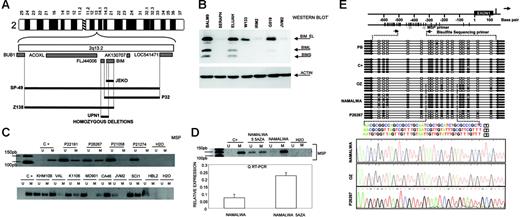
Another region of recurrent genomic loss in 2q13-q21 containing BIM gene was observed in 7 cell lines of different origins. Using array-based CGH, Tagawa et al27 recently reported homozygous deletion of BIM in MCL. We screened for homozygous deletion of BIM gene and identified 5 MCL cell lines (UPN1, SP49, SP53, JEKO1, and Z138) but also the Burkitt lymphoma cell line P32 with biallelic loss (Figure 3A) Overall, 5 (42%) of 12 MCL cell lines showed biallelic deletion of BIM. Sequencing of genomic DNA failed to identify any sequence mutation in any other cell lines and primary biopsies. Western blot analysis, however, showed absence of expression in a large proportion of lymphomas of different origins (Figure 3B). To investigate this, we determined the methylation status of BIM gene promoter. In 11 (48%) of 23 examined cell lines and in 7 (27%) of 26 primary B-NHL biopsies of different origins, promoter methylation of BIM was identified. Methylations were more prominent in Burkitt lymphoma, whereby 6 (86%) of 7 cell lines examined and 5 (50%) of 10 patient biopsies presented BIM methylation (Figure 3C). However, this was not observed in any of the MCL cell lines or patient biopsies studied. A detailed mapping of CpG methylation of the promoter by bisulfite genomic sequencing confirmed these data (Figure 3E). BIM promoter methylation was correlated with loss of expression at the RNA and protein levels, and treatment with demethylating Aza restored BIM expression (Figure 3D). IHC on tissue microarrays detected lack of BIM expression in 7 (32%) of 22 MCL samples (data not shown), which is consistent with the Western blot data. In summary, our data indicate that BIM is frequently silenced in different B-NHL subtypes through various mechanisms that include homozygous deletion in MCL and promoter methylation in Burkitt lymphoma.
Identification of homozygous deletion and promoter methylation of BIM. (A) Array CGH and genomic PCR studies of MCL cell lines, showing interstitial homozygous deletion of BIM gene. In none of the cases was deletion of the BUB1 gene observed. (B) Western blot analysis shows absence of expression of BIM protein in MCL cell lines (in the figure, IRM2 and JVM2) but also in Burkitt lymphoma cell lines (in the figure, Seraphina). (C) Methylation of BIM promoter was frequently detected in Burkitt lymphoma cell lines (in the figure, KHM10B and CA46) and patient biopsies (P22191 and P26267) as well as in a subset of B-NHL from different origins (in the figure, Karpas 1106 and SCI-1) but not in MCL cell lines (in the figure, JVM2 and HBL2) or patient biopsies (P21058 and P21274). (D) BIM promoter methylation was correlated with loss of expression at the RNA and protein levels, and treatment with demethylating Aza restored BIM expression. Error bars indicate standard deviation. (E) A detailed mapping of CpG-methylation of the promoter by bisulfite genomic sequencing confirmed previous data. Samples analyzed correspond to a positive methylated control (C+); peripheral blood (PB) from a healthy donor (unmethylation); the OZ cell line (unmethylated); the Burkitt-derived cell line Namalwa (methylated); and a lymph-node biopsy from a patient with Burkitt lymphoma (P26267) showing a mixture of methylated and unmethylated colonies.
Identification of homozygous deletion and promoter methylation of BIM. (A) Array CGH and genomic PCR studies of MCL cell lines, showing interstitial homozygous deletion of BIM gene. In none of the cases was deletion of the BUB1 gene observed. (B) Western blot analysis shows absence of expression of BIM protein in MCL cell lines (in the figure, IRM2 and JVM2) but also in Burkitt lymphoma cell lines (in the figure, Seraphina). (C) Methylation of BIM promoter was frequently detected in Burkitt lymphoma cell lines (in the figure, KHM10B and CA46) and patient biopsies (P22191 and P26267) as well as in a subset of B-NHL from different origins (in the figure, Karpas 1106 and SCI-1) but not in MCL cell lines (in the figure, JVM2 and HBL2) or patient biopsies (P21058 and P21274). (D) BIM promoter methylation was correlated with loss of expression at the RNA and protein levels, and treatment with demethylating Aza restored BIM expression. Error bars indicate standard deviation. (E) A detailed mapping of CpG-methylation of the promoter by bisulfite genomic sequencing confirmed previous data. Samples analyzed correspond to a positive methylated control (C+); peripheral blood (PB) from a healthy donor (unmethylation); the OZ cell line (unmethylated); the Burkitt-derived cell line Namalwa (methylated); and a lymph-node biopsy from a patient with Burkitt lymphoma (P26267) showing a mixture of methylated and unmethylated colonies.
The INK4c/P18 gene, a member of the INK4 family of cyclin-dependent kinase inhibitors, is preferentially silenced in MCL
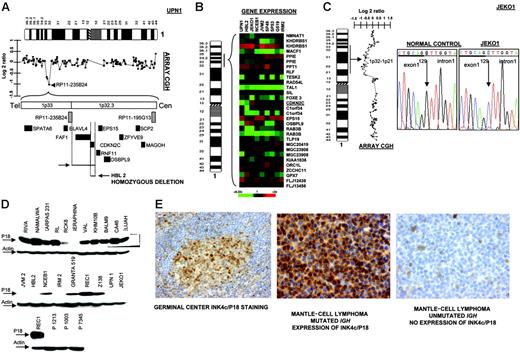
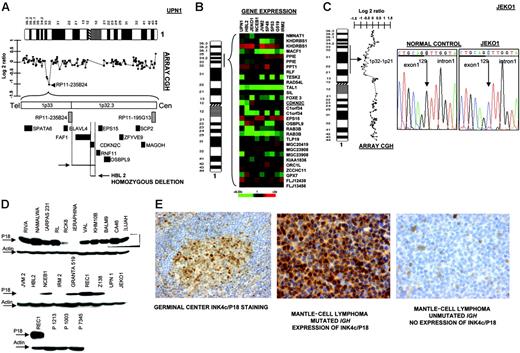
In 2 cell lines we observed that clone RP11-235B24, which maps to 1p32.3, showed a genomic value close to homozygosity; further screening with PCR identified homozygous deletion of INK4c/P18 in 2 MCL cell lines (UPN1 and HBL2) but not in the remaining B-NHL cell lines (Figure 4A) Affymetrix oligonucleotide microarrays performed in MCL cell lines for genes located in 1p32.3-1p36 showed absence of INK4c/P18 (CDKN2C) expression in both cell lines (Figure 4B). Mutation screening also identified hemizygous loss and point mutation at a critical splicing site of the remaining allele in JEKO1 cell line (Figure 4C). Western blot analysis revealed absence of protein expression in these 3 (UPN1, HBL2, and JEKO1) but also in most other MCL cell lines, as well as in 3 patients with MCL, whereas INK4c/P18 protein expression was observed in the majority of other B-NHL subtypes (Figure 4D). To search for other possible causes of decreased INK4c/P18 expression, we evaluated the promoter methylation status of INK4c/P18 in the cell lines. These studies did not reveal any case with hypermethylation of the gene (data not shown). To evaluate the significance of INK4c/P18 inactivation in patients with MCL, we performed IHC on tissue microarrays in a clinical series of patient biopsies. INK4c/P18 was strongly expressed in normal B cells, including germinal center cells, but its expression was absent in a portion of mantle cells. In 20 (77%) of the 26 evaluable cases, INK4c/P18 expression was undetectable. Decreased INK4c/P18 expression was correlated with IGH mutation status: 4 (67%) of 6 cases showing INK4c/P18 expression presented IGH mutation, whereas only 3 (15%) of 20 cases that did not express INK4c/P18 had a mutated IGH gene (P = .02) (Figure 4E). These data indicate that INK4c/P18 expression is more common among the cases with mutated IGH.
Inactivation of INK4c/P18 in MCL. (A) Array CGH studies and further screen with genomic PCR identified homozygous deletion of INK4c/P18 in 2 MCL cell lines (UPN1 and HBL2) but not in the remaining B-NHL cell lines. (B) Affymetrix oligonucleotide microarrays performed in MCL cell lines of genes located in 1p36-1p32.3 showed absence of CDKN2C expression in both cell lines. (C) Mutation screening identified hemizygous loss and point mutation of INK4c/P18 at a critical splicing site of the remaining allele in JEKO1 cell line, which correlated with absence of P18 expression. (D) Western blot analysis revealed absence of protein expression in these 3 cell lines (UPN1, HBL2, and JEKO1) but also in the majority of other MCL cell lines (JVM2, IRM2) and in patients with MCL (in the figure, lymph node biopsies from patients P1213, P1003, and P7345), whereas INK4c/P18 protein expression was observed in the majority of other B-NHL subtypes. (E) IHC on tissue microarrays revealed absence of expression of INK4c/P18 in MCL with IGH unmutated status.
Inactivation of INK4c/P18 in MCL. (A) Array CGH studies and further screen with genomic PCR identified homozygous deletion of INK4c/P18 in 2 MCL cell lines (UPN1 and HBL2) but not in the remaining B-NHL cell lines. (B) Affymetrix oligonucleotide microarrays performed in MCL cell lines of genes located in 1p36-1p32.3 showed absence of CDKN2C expression in both cell lines. (C) Mutation screening identified hemizygous loss and point mutation of INK4c/P18 at a critical splicing site of the remaining allele in JEKO1 cell line, which correlated with absence of P18 expression. (D) Western blot analysis revealed absence of protein expression in these 3 cell lines (UPN1, HBL2, and JEKO1) but also in the majority of other MCL cell lines (JVM2, IRM2) and in patients with MCL (in the figure, lymph node biopsies from patients P1213, P1003, and P7345), whereas INK4c/P18 protein expression was observed in the majority of other B-NHL subtypes. (E) IHC on tissue microarrays revealed absence of expression of INK4c/P18 in MCL with IGH unmutated status.
The proapoptotic BH3-only member of the BCL2 family NOXA is inactivated in B-NHL
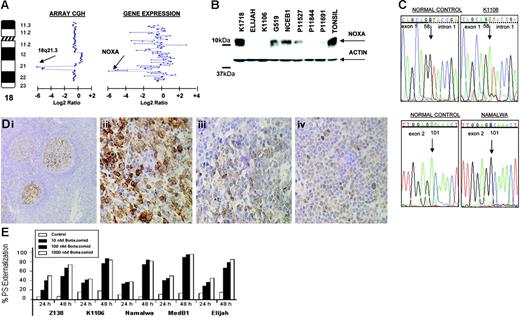
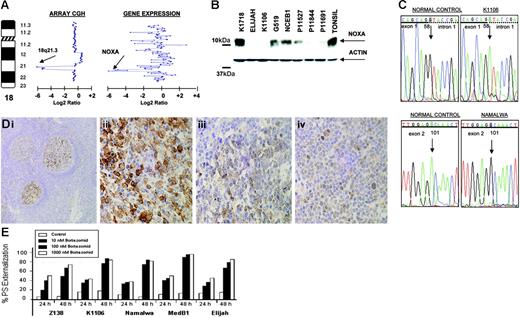
In the Burkitt-derived cell line Elijah, a biallelic deletion of approximately 1.9 Mb in band 18q21.3 was delineated (Figure 5A) This loss contained the NOXA gene, a BH3-only member of the BCL2 gene family that showed null expression in Lymphochip microarrays.33 These data were confirmed by PCR on genomic DNA, FISH, RT-PCR, and QRT-PCR. Western blot analysis showed absence of expression of NOXA in Elijah and Karpas 1106 cell lines, whereas very weak expression was observed in several other cell lines (Figure 5B). Among them, 3 presented loss of one copy as detected in array CGH experiments (Karpas 1106, UPN1, and Namalwa). The search for inactivating mutations of the nondeleted allele revealed mutation in two: a splice site mutation 58 + 1G→A and a silent mutation 1 − 35G→A in Karpas 1106, and a missense mutation 101A→G that resulted in the amino acid change D34G in the BH3 domain in Namalwa (Figure 5C). Western blot analysis revealed that 8 (53%) of 15 primary B-NHL biopsies showed very weak expression of NOXA. Mutational screening in patient material failed to identify any inactivating mutation in NOXA open reading frame but revealed 3 alterations in the gene promoter sequence: 1 − 752C→T (2 of 106 patients), 1 − 653G→A (1 of 106), and 1 − 576A→G (1 of 106). None of these alterations was found in the B-NHL cell lines or in 52 healthy donors. In addition, several novel and reported polymorphisms were identified. Next, we investigated NOXA protein expression on biopsy samples from 367 patients with B-NHL using IHC on tissue microarrays. In nontumoral tissue samples (tonsils), NOXA was shown to be expressed only in a fraction of germinal center B cells, whereas mantle, marginal, and interfollicular lymphocytes were negative (Figure 5D). NOXA protein expression was mostly cytoplasmic but also showed occasional nuclear expression. In lymphoma samples, NOXA protein expression was found in a subset of both diffuse large B-cell lymphoma (DLBCL) (32 of 67, 48%) and follicular lymphoma (20 of 103, 19%). In the remaining B-NHL subtypes, NOXA was detected in 4 (5%) of 72 MCL, 4 (5%) of 77 splenic marginal zone lymphoma, and 6 (12%) of 48 B-cell chronic lymphocytic leukemia samples. In the DLBCL subgroup, patient samples were also evaluated for CD10, BCL2, BCL6, and MUM1 staining and thus were classified as DLBCL of germinal center origin (n = 26) and nongerminal center DLBCL subtype (n = 24). NOXA expression was more common in the nongerminal center subtype (58% versus 42%; P = .16) (Figure 5D). To search for other possible causes of decreased NOXA expression, we evaluated the promoter methylation status of NOXA in the cell lines and in the patients analyzed by Western blotting. These studies did not reveal any case with hypermethylation of the gene (data not shown). Overall, our data indicate that the reduced expression of NOXA in nongerminal center–derived DLBCL possibly reflects the lower expression of NOXA in the normal cell counterpart. NOXA is a critical mediator of the apoptotic responses induced by P53 and other agents.33 Furthermore, it was recently reported that proteasome inhibitors trigger NOXA-mediated apoptosis in melanoma and MCL.34,35 To test this hypothesis in other B-NHL subtypes, we incubated a variety of B-cell lymphoma lines with and without NOXA mutation and with different levels of protein expression, with the proteasome inhibitor bortezomib (PS-341). After 48 hours of bortezomib exposure, there were no clear differences in either induction of apoptosis or apoptotic rate (Figure 5E) in the B-NHL cell lines with or without NOXA inactivation. These data suggest that in contrast to previous reports, NOXA may not be of pivotal importance in triggering proteasome inhibitor–induced apoptosis in B-cell lymphomas other than MCL.35
Genomic and proteomic analysis of NOXA in B-NHL. (A) Array CGH analysis of Elijah cells shows homozygous deletion of chromosome band 18q21.3. Within the region, NOXA gene expression shows null expression in the Lymphochip microarrays. (B) Western blot and QRT-PCR analyses show expression variation of NOXA in different B-NHL cell lines; in Elijah, NOXA protein expression is absent according to DNA and RNA data. (C) NOXA gene sequence changes in B-NHL cell lines; the nucleotide positions of NOXA are based on GenBank accession sequence NM_021127. Sequencing analysis of the nondeleted alleles reveals a splice site mutation in Karpas 1106 and a missense mutation in the BH3-domain in Namalwa. (D) Immunohistochemistry analysis for NOXA protein on tissue microarrays from 367 biopsies from patients with different B-NHL. In tonsils, NOXA was shown to be expressed only in a fraction of germinal center B cells, whereas mantle, marginal, and interfollicular lymphocytes were negative (i). In lymphoma samples, NOXA protein expression was restricted to diffuse large B-cell lymphoma (32 of 67, 48%) and in a subset of follicular lymphoma (20 of 103, 19%), whereas MCL, splenic marginal zone lymphoma, and B-cell chronic lymphocytic leukemia samples were mostly negative. In the figure, lymph node biopsies from patients with diffuse large B-cell lymphoma (ii), follicular lymphoma (iii), and splenic marginal zone lymphoma (iv) are shown. (E) Proteasome inhibitor, bortezomib (PS-341) in B-NHL cell lines with and without NOXA mutation. Cell lines were incubated for 24 and 48 hours with increasing concentrations of bortezomib. Apoptosis was calculated by measuring phosphatidylserine (PS) externalization as determined using Annexin V. The results correlated with loss of mitochondrial membrane potential (data not shown). Both the induction and rate of apoptosis were comparable among all the cell lines, irrespective of the presence of genetic alterations in NOXA.
Genomic and proteomic analysis of NOXA in B-NHL. (A) Array CGH analysis of Elijah cells shows homozygous deletion of chromosome band 18q21.3. Within the region, NOXA gene expression shows null expression in the Lymphochip microarrays. (B) Western blot and QRT-PCR analyses show expression variation of NOXA in different B-NHL cell lines; in Elijah, NOXA protein expression is absent according to DNA and RNA data. (C) NOXA gene sequence changes in B-NHL cell lines; the nucleotide positions of NOXA are based on GenBank accession sequence NM_021127. Sequencing analysis of the nondeleted alleles reveals a splice site mutation in Karpas 1106 and a missense mutation in the BH3-domain in Namalwa. (D) Immunohistochemistry analysis for NOXA protein on tissue microarrays from 367 biopsies from patients with different B-NHL. In tonsils, NOXA was shown to be expressed only in a fraction of germinal center B cells, whereas mantle, marginal, and interfollicular lymphocytes were negative (i). In lymphoma samples, NOXA protein expression was restricted to diffuse large B-cell lymphoma (32 of 67, 48%) and in a subset of follicular lymphoma (20 of 103, 19%), whereas MCL, splenic marginal zone lymphoma, and B-cell chronic lymphocytic leukemia samples were mostly negative. In the figure, lymph node biopsies from patients with diffuse large B-cell lymphoma (ii), follicular lymphoma (iii), and splenic marginal zone lymphoma (iv) are shown. (E) Proteasome inhibitor, bortezomib (PS-341) in B-NHL cell lines with and without NOXA mutation. Cell lines were incubated for 24 and 48 hours with increasing concentrations of bortezomib. Apoptosis was calculated by measuring phosphatidylserine (PS) externalization as determined using Annexin V. The results correlated with loss of mitochondrial membrane potential (data not shown). Both the induction and rate of apoptosis were comparable among all the cell lines, irrespective of the presence of genetic alterations in NOXA.
Novel homozygous deletion of 4q35.1 results in ARGBP2 and SNX25 truncation
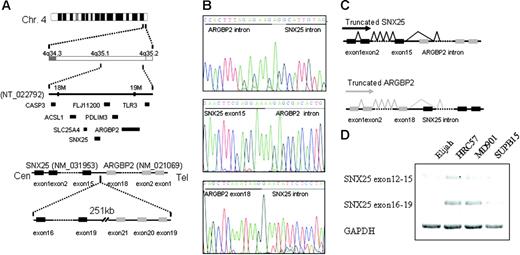
Another region of homozygous deletion included band 4q35.1 in the Burkitt lymphoma cell line Elijah. This deletion was caused by the complete loss of one chromosome 4 and an interstitial deletion of the remaining chromosome. Delineation of the deleted segment by “PCR walking” revealed a loss of 251 kb (kilobase) between 2 genes on chromosome 4q35.1, ARGBP2/SORBS2 centromerically, and SNX25 telomerically (Figure 6A) The former gene encodes an adapter protein that interacts directly with ABL via SH3 domains in the carboxy terminus and may link ABL with the actin cytoskeleton. ARGBP2 is broadly expressed in normal and malignant tissues, whereas the more telomeric gene, SNX25 appears to be B-cell specific. The 2 genes are in opposite transcriptional orientation. The deletion breakpoints fell within the carboxy-terminal coding regions of both genes; the ARGBP2 breakpoint fell within the intron immediately telomeric to exon 30, whereas the SNX25 breakpoint fell within an intron, centromeric to exon 15 (Figure 6B). 3′ RACE (rapid amplification of cDNA ends) experiments showed splicing of both ARGBP2 and SNX25 transcripts to splice to cryptic splice acceptor sites and exons in the opposite transcriptional orientation, resulting in the introduction of premature stop codons in both genes (Figure 6C-D). As a consequence of the fusion, ARGBP2 loses a crucial COOH terminal domain that may interfere with its binding to ABL.36 However, we did not detect a similar gene fusion or a homozygous deletion in 4q35.1 in the remaining B-NHL cell lines nor in a subset of primary B-NHL biopsies (data not shown). The possible functional consequences of the truncation of the COOH terminal domain in SNX25 are currently unclear, and whether this novel mechanism of gene inactivation is also observed in other homozygous deletions in cancer is currently under investigation.
Homozygous deletion of 4q35.1. (A) In the Elijah cell line, delineation of the deleted segment in 4q35.1 revealed a small deletion of 251 kb between the potential candidate genes ARGBP2 and SNX25. (B-C) Both genes truncated in a cryptic fusion between SNX25 exon 15 and ARGBP2 intron and between ARGBP2 exon 18 and SNX25 intron. Both genes splice to cryptic splice acceptor sites in the opposite transcriptional orientation. As a consequence of the deletion, ARGBP2 loses a crucial COOH terminal domain that may interfere with its binding to CBL and SNX25 also results in the truncation of the COOH terminal domain. Deletion of ALP gene, mapped between ARGBP2 and SNX25, is also detected. (D) Truncated SNX25 mRNA is expressed using RT-PCR in Elijah cell line (exons 12-15), whereas no expression of the deleted SNX25 mRNA is present (exons 16-19). On the contrary, expression of both mRNAs (exons 12-15 and exons 16-19) are present in the cell lines without deletion of SNX25 (MD901, SUPB15, and HRC57).
Homozygous deletion of 4q35.1. (A) In the Elijah cell line, delineation of the deleted segment in 4q35.1 revealed a small deletion of 251 kb between the potential candidate genes ARGBP2 and SNX25. (B-C) Both genes truncated in a cryptic fusion between SNX25 exon 15 and ARGBP2 intron and between ARGBP2 exon 18 and SNX25 intron. Both genes splice to cryptic splice acceptor sites in the opposite transcriptional orientation. As a consequence of the deletion, ARGBP2 loses a crucial COOH terminal domain that may interfere with its binding to CBL and SNX25 also results in the truncation of the COOH terminal domain. Deletion of ALP gene, mapped between ARGBP2 and SNX25, is also detected. (D) Truncated SNX25 mRNA is expressed using RT-PCR in Elijah cell line (exons 12-15), whereas no expression of the deleted SNX25 mRNA is present (exons 16-19). On the contrary, expression of both mRNAs (exons 12-15 and exons 16-19) are present in the cell lines without deletion of SNX25 (MD901, SUPB15, and HRC57).
Discussion
We report that array CGH combined with gene-expression profiling represents a valid strategy for localizing tumor suppressor genes in regions of homozygous loss in B-cell lymphoma. In a recent survey of homozygous deletions in 636 cancer cell lines, mostly of nonlymphoid origin,28 the gene count within homozygous deletions was low compared with the rest of the genome, and many of these areas did not contain coding genes. In contrast, all homozygous deletions identified in our B-NHL cell lines included coding genes. The number of homozygous losses in the B-NHL cell line panel (20 in 48 cases, 0.42 per cell line) was similar to that found in the carcinoma cell lines (281 homozygous deletions in 636 cancer cell lines, 0.44 per cell line). These data indicate that the overall number of homozygous deletions in the B-cell lymphoma and carcinoma genomes is similar, but the nature of the homozygous losses may be different. In lymphoma, biallelic loss results in the inactivation of coding tumor suppressor genes probably implicated in tumor development and progression, whereas the low density or absence of coding genes within regions of homozygous deletion in the carcinoma cell lines raises the possibility that other types of transcripts may be the target for homozygous deletion.28 An attractive hypothesis is that homozygous deletions in gene-free regions confer positive selective advantage by deleting regulatory regions or noncoding microRNAs that are necessary for control of the expression of recessive or dominant cancer genes.
Our study pointed out several candidate tumor suppressor genes inactivated by biallelic deletion. Further investigation revealed that only a fraction of cell lines and primary biopsies presented inactivation of these genes by point mutation or intragenic deletion, but instead some of these genes were frequently silenced at the epigenetic level by promoter methylation. Notably, the pattern of genetic and epigenetic inactivation for these genes was different and varied among the B-NHL subtypes. Thus, MCL showed frequent homozygous deletion of BIM gene, whereas it was commonly silenced by promoter methylation in Burkitt lymphoma and in diffuse large B-cell lymphoma. We also identified inactivation of the cyclin-dependent kinase inhibitor INK4c/P18 in MCL. Because unmutated IGH has been associated with aggressive clinical evolution of MCL,37 inactivation of INK4c/P18 gene by biallelic mutation may be associated with aggressive MCL. We also suggest that the decreased expression of INK4c/P18 observed in IGH-unmutated cells may indicate that these tumors originated from mantle cells that do not express INK4c/P18, whereas tumors expressing INK4c/P18 originated from IGH-mutated mantle cells that express INK4c/P18.
One of the most prominent candidate tumor suppressor genes detected in our study is PIG7/LITAF, a P53 inducible gene that is also an LPS-induced TNF-α transcription factor.30,31 In addition, mutations of PIG7/LITAF have been reported as the causative mechanism of Charcot-Marie-Tooth disease type 1C.38 However, mutation screening of PIG7/LITAF coding sequences in the B-NHL cell lines and primary B-NHL tumors did not identify any clear pathogenic mutation. The possible implication of PIG7/LITAF as a suppressor gene could be related to its P53 inducibility and regulation of apoptosis. Additional support for the involvement of PIG7/LITAF in lymphoma comes from a recent report that suggested that the proto-oncogene BCL6 may repress PIG7/LITAF through the transcription factor MIZ-1 in germinal B cells.32 Supporting this hypothesis, we have observed an inverse correlation of PIG7/LITAF and BCL6 expression in most of the examined cell lines at the RNA and protein levels. Our data strongly suggest that PIG7/LITAF may have suppressor activity in diffuse large B-cell lymphoma and Burkitt lymphoma.
Our data also pinpointed additional genes targeted by homozygous deletion in lymphoma. The NOXA gene was found inactivated by homozygous deletion and point mutation in different lymphoma cell lines. In addition, a missense mutation in the conserved BH3 domain was also identified. However, we did not identify similar mutations or promoter methylation in lymphoma primary samples. Instead, we observed decreased NOXA protein expression in patients with nongerminal diffuse large B-cell lymphoma, possibly reflecting the low expression of NOXA in the normal cell counterpart. A recent report by Perez-Galan et al35 indicated that in NOXA depletion by RNA interference markedly decreased sensitivity to bortezomib, pointing to this protein as a key mediator between proteasome inhibition and mitochondrial depolarization in this lymphoma subtype. After incubation of different B-NHL lymphoma cell lines with different levels of NOXA with bortezomib, we did not observe differences in apoptosis, therefore not confirming the pivotal importance of NOXA in triggering proteasome-induced apoptosis in B-cell lymphomas other than MCL.35
In summary, our combined approach has shown the extent to which DNA copy number variation influences the deregulation of gene expression in B-NHL. We demonstrate that array CGH combined with gene-expression profiling may provide a rationale for discovering tumor suppressor genes in regions of homozygous loss. These target genes show different genetic and epigenetic mechanisms of inactivation that substantially vary among the B-NHL subtypes. Similar screens for tumor suppressor genes can be extended to the analysis of other cancers.
The online version of this article contains a data supplement.
An Inside Blood analysis of this article appears at the front of this issue.
The publication costs of this article were defrayed in part by page charge payment. Therefore, and solely to indicate this fact, this article is hereby marked “advertisement” in accordance with 18 USC section 1734.
Conflict-of-interest statement: The authors declare no competing financial interests.
J.A.M.-C. and M.J.S.D. should both be considered senior authors.
Contribution: C.M.-E. performed the research, analyzed the data, and designed the research; F.R.-M., J.A.R., J.C., R.S., A.R., K.S., L.M.W., E.L.K., M.M., J.F.G.V.F., E.B., X.A., L.S., and F.P. performed the research and analyzed the data; I.M., L.M.S., and D.P. contributed new reagents or analytic tools; M.J.S.D. designed the research and analyzed data; J.A.M.-C. designed and performed the research, analyzed the data, and wrote the paper.
We thank Drs M. D. Odero (Pamplona, Spain), F. Sole (Barcelona, Spain), and J. C. Cigudosa (Madrid, Spain) for assistance with color cytogenetic analyses; and Drs A. Turhan (Paris, France) and A. Karpas (Cambridge, United Kingdom) for kindly providing UPN-1 and UPN-2 cell lines, and Karpas 1718 cell line, respectively.
This work was supported grants from the Spanish Ministries of Education and Science (SAF-5340/2005 and Ramon-Cajal Programme) and of Health (Fis), International Union Against Cancer (UICC-YY1/05/006), Spanish Hematology Association (AEHH), Navarra Government (Education Council), European Commission (VI Framework Programme LSHC-CT-2004-503351), Deutsche Krebshilfe, Lymphoma Research Foundation (NY), Medical Research Council, and UTE-FIMA.

