Abstract
Cholinergic signaling and acetylcholinesterase (AChE) influence immune response and inflammation. Autoimmune myasthenia gravis (MG) is mediated by antibodies to the acetylcholine receptor and current therapy is based on anti-AChE drugs. MG is associated with thymic hyperplasia, showing signs of inflammation. The objectives of this study were to analyze the involvement of AChE variants in thymic hyperplasia. We found lower hydrolytic activities in the MG thymus compared with adult controls, accompanied by translocation of AChE-R from the cytoplasm to the membrane and increased expression of the signaling protein kinase PKC-βII. To explore possible causal association of AChE-R changes with thymic composition and function, we used an AChE-R transgenic model and showed smaller thymic medulla compared with strain-matched controls, indicating that AChE-R overexpression interferes with thymic differentiation mechanisms. Interestingly, AChE-R transgenic mice showed increased numbers of CD4+CD8+ cells that were considerably more resistant in vitro to apoptosis than normal thymocytes, suggesting possibly altered positive selection. We further analyzed microarray data of MG thymic hyperplasia compared with healthy controls and found continuous and discrete changes in AChE-annotated GO categories. Together, these findings show that modified AChE gene expression and properties are causally involved in thymic function and development.
Introduction
Myasthenia gravis (MG) is an autoimmune disorder caused by autoantibodies against the nicotinic acetylcholine receptor (nAChR) on the postsynaptic membrane at the neuromuscular junction (NMJ) and characterized by weakness and fatigability of the voluntary muscles.1 Although the production of anti-AChR antibodies is directly attributable to B cells, extensive evidence indicates that T cells have a key role in the autoantibody response.2,3 Because the thymus is a key organ in the production and education of functional T lymphocytes, it may be implicated in the initiation and progress of MG. Moreover, approximately 75% of patients display thymic abnormalities.4 Of these, 85% have hyperplasia (germinal-center formation) and 15% have thymomas. Furthermore, thymectomy often results in improvement in most patients.5,6 Last but not least, both B and T cells from the thymus gland of myasthenic patients are more responsive to AChR than are B and T cells from peripheral blood.7 All these observations point to a major role of thymus in the pathogenesis of MG. The main treatment for MG is the use of anticholinesterase drugs (eg, pyridostigmine) that enhance the duration of acetylcholine in the synaptic cleft and thus improve the impaired neurotransmission.8,9
Acetylcholinesterase (AChE), whose well-known function is to hydrolyze acetylcholine, is not a single entity but a combinatorial complex of protein products due to alternate promoter usage10 and alternative splicing11 giving rise to multiple AChE isoforms in a stress-dependent and tissue-specific manner12 : the “synaptic” (S), (also called T, for “tailed”13 ), the “erythrocytic” (E), and the “readthrough” (R) isoforms of AChE. These isoforms share a similar catalytic domain but differ in their C-terminal domain, which influences their molecular form and localization and confers on them specific features.14 In the last decade, new nonclassical and sometimes even noncholinergic functions of AChE isoforms have been described: in neuritogenesis,15 synaptogenesis,16 cell adhesion,17 osteogenesis,18 and hematopoiesis.19 AChE-S is the main isoform in physiologic conditions, but shifted splicing of AChE pre-mRNA leading to overproduction and accumulation of the normally rare AChE-R variant can occur after exposure to acute stress8 or anticholinesterase drugs (as for Gulf War veterans) or under treatment of Alzheimer disease.8 Because anticholinesterase drugs are used in the treatment of MG, they might modify the balance between AChE-S/AChE-R. Indeed, Brenner and colleagues detected more AChE-R in serum of human myasthenic patients and in serum and muscles of rats with experimental autoimmune MG (EAMG).20 AChE-R seems to have a fundamental role in the pathophysiology of MG as an antisense oligonucleotide that selectively lowers AChE-R in serum and muscle alleviates electromyographic abnormalities and restores clinical status of EAMG rats.20 Moreover, both AChE-R and its naturally cleavable C-terminal domain showed powerful proliferative effects in blood cells21,22 and tight interactions through its unique C-terminal domain with the scaffold protein RACK1 and through it with protein kinase C (PKC)βII23 or PKCϵ.24
Because AChE is present in thymus,25 which is central in MG appearance, we hypothesized that AChE variants, and especially AChE-R, could causally participate in the myasthenic syndrome through an action on developing T cells. To test this hypothesis, we analyzed the expression and function of AChE in the human normal and pathologic thymus and explored the influence of overexpression of AChE on murine thymic development. Our findings demonstrate changes in thymic composition and function associated with modified AChE-R expression and localization, which might be causally involved in MG.
Materials and methods
Thymic tissues
Fresh thymic fragments were obtained from immunologically healthy patients undergoing corrective cardiovascular surgery (discarded tissue) or from MG patients undergoing thymectomy as a treatment of the disease at the Centre Chirurgical Marie Lannelongue (Le Plessis Robinson, France). All MG patients included in the study were treated with anticholinesterase drugs but not with corticosteroids or immunosuppressor drugs. Pathologists at Centre Chirurgical Marie Lannelongue determined the classification of thymoma. The Institutional Review Board approved the use of human tissues and informed consent was provided according to the Declaration of Helsinki at the Comité Consultatif pour la protection des personnes dans la Recherche Biomédicale (CCPPRB) of Bicetre Hospital (94270 Le Kremlin Bicêtre, France). All subject groups included both female and male subjects; the adult healthy volunteers and MG patients were 14 to 72 years old and newborns were 11 days to 4 months old.
Mice
RNA extraction and real-time RT-PCR
RNA was extracted from normal and pathologic thymus samples using the RNeasy lipid tissue kit (Qiagen, Valencia, CA) as per the manufacturer's instructions. DNase treatment was applied to avoid DNA contamination. RNA integrity was confirmed by gel electrophoresis, and RNA concentration and purity were assessed spectrophotometrically. For each sample, 0.4 μg RNA was used for 20 μL cDNA synthesis using Promega reverse transcription-polymerase chain reaction (RT-PCR) kit (Promega, Madison, WI). Real-time RT-PCR was performed in triplicate for each sample using ABI prism 7900HT and SYBR green master mix (Applied Biosystems, Foster City, CA). ROX, a passive reference dye, was used for signal normalization across the plate. Primer sequences are described in Table 1 and in Figure S1A (available on the Blood website; see the Supplemental Materials link at the top of the online article). Annealing temperature was 60°C for all primers. Serial dilution of samples served to evaluate primers efficiency and the appropriate cDNA concentration that yields linear changes. Melting curve analysis and amplicons sequencing verified the end product and β-actin served as reference gene.
Microarray experiments
Four pools of thymic RNA were prepared from MG patients undergoing therapeutic thymectomy (with severe thymic hyperplasia [MH; n = 5] or mild thymic hyperplasia [ML; n = 4]), adult healthy controls (n = 4), and from 1-week- to 1-year-old controls (NB; n = 10), which served as a common reference. MG and control adult samples were from 16- to 25-year-old subjects and all samples including the NB were from females. Thymuses containing more than 3 or fewer than 2 germinal centers per section were defined as severe or mild hyperplasia, respectively.28 We chose to work with pools of thymic RNA (from homogeneous categories of patients) to minimize interindividual variations. Real time RT-PCR performed for several dysregulated genes in larger series of patients validated our results.28,29 Extraction of total RNA and hybridization on Agilent arrays (G4100A, Massy, France) was performed as previously described.28 RNA quality was assessed on an Agilent Bioanalyser. Total RNA (20 μg) was labeled with cyanine 5 or cyanine 3 using the direct labeling protocol of Agilent. The arrays were scanned using a 428 Affymetrix scanner (MWG-Biotech, Courtaboeuf, France). Images were analyzed with GenePix pro V4.0 (Axon Instruments, Dipsi Industrie, Châtillon, France) corrected by intranormalization and internormalization steps and centered on zero by the array.28
Microarray analysis
The mean expression ratio of transcripts in MH, ML, and adult groups were compared with NB and transformed to log base 2. Using “GOdist,” we applied the classical threshold-using discrete approach (with a 2-fold cutoff) and a continuous approach to find overrepresented GO categories.30 The threshold-independent statistical approach uses Kolmogorov-Smirnov (KS) statistics and was applied by an enhanced version of GOdist31 that was adapted to analyze Agilent microarray data. GO gene association files were produced using the EASE32 classification system. Transcripts with no corresponding UniGene cluster (2502 of 13 572 transcripts) were discarded from further analysis. EASE recognized 2986 UniGene clusters, of which 1600 could be mapped to GO categories, producing “Biological Process” (BP) and “Molecular Function” (MF) annotations. GOdist implements the discrete approach by exact Fisher test, using hypergeometric distribution. For each GO term, both KS and Fisher tests were used to identify the overrepresented categories compared with the global array population using both approaches. In each test, a separate test was conducted for each tail (increase/decrease). To specifically find the GO categories to which AChE is annotated, we used AmiGO.30 For some specific terms, we also compared GO child directly to parent terms to detect specific changes using KS, ANOVA Kruskal-Wallis (KW), and variance tests. GO categories with significance level of < .05 in any of the global or specific tests were considered as changed.
AChE activity assays and subcellular fractionations
AChE activities were determined with a standard colorimetric assay adapted to a 96-well microtiter plate. Assays were performed in 0.1 M phosphate buffer, pH 7.4/0.5 mM dithio-bis-nitrobenzoic acid-1 mM acetylthiocholine substrate at room temperature. Optical density at 405 nm was monitored for 20 minutes at 3- to 5-minute intervals.33 Subcellular fractionation of human and mouse thymuses into low-salt (0.01 M Tris-HCl, pH 7.4, 0.05 M MgCl2, 0.05 M NaCl), low-salt detergent (1% Triton X-100 in 0.01M Na phosphate, pH 7.4), and high-salt (1 M NaCl in 0.01 M Na phosphate, pH 7.4) buffers was performed as previously described34 (Figure S1B).
Immunoblots
Thymic homogenates were separated and blotted as previously described.22 Immunodetection (4°C, overnight) was with either monoclonal mouse anti-PKCβII (sc-210; Santa Cruz Biotechnology, Santa Cruz, CA) diluted 1:1000, mouse anti-RACK1 (610178, BD Transduction Laboratories, Erembodegem, Belgium), diluted 1:2000, goat anti-AChE (N19; sc-6431, Santa Cruz Biotechnology), and rabbit anti–AChE-R27 diluted 1:500, (position seen in Figure S1C). Development (room temperature, 2 hours) was with horseradish peroxidase-conjugated goat antimouse or antirabbit antibodies diluted 1:10 000 (Jackson Laboratories, West Grove, PA) and enhanced chemiluminescence (ECL) kit (Amersham Pharmacia Biotech, Buckinghamshire, United Kingdom).
Thymocyte isolation and cell culture
Mouse thymocytes were extracted from thymuses by grinding, numbered by Trypan staining and stained to determine their state of differentiation and level of apoptosis. Thymocytes were cultured in 24-well plates (Nunc, Roskilde, Denmark; 2 × 10⁶ in 1 mL/well), in RPMI 1640 medium (Invitrogen, Cergy-Pontoise, France) supplemented with 10% fetal calf serum (Invitrogen), 25 mM HEPES buffer (Invitrogen), and 50 nM β-mercaptoethanol (Sigma-Aldrich, St Louis, MO). Thymocytes were harvested after 24 and 48 hours, counted, and stained for differentiation or apoptosis markers.
Flow cytometry
Freshly isolated or cultured thymic cells were incubated with rat anti–mouse CD4 (IgG2a, RM4-5) coupled to biotin (biot), rat anti–mouse CD8a (IgG2a, 53-6.7) coupled to phycoerythrin (PE), hamster anti–mouse CD3ϵ (IgG, 145-2C11) labeled with fluorescein isothiocyanate (FITC), 30 minutes at 4°C. Anti-CD4 biotin-labeled antibody was revealed by incubation in streptavidin-QR for 30 minutes at 4°C. All antibodies were from BD PharMingen (Le Pont de Claix, France). Controls were stained with FITC- and PE-conjugated IgG. Staining was analyzed on a FACScalibur flow cytometer (Becton Dickinson, Milan, Italy), using Cell Quest software.
Measurements of apoptosis
Apoptosis was measured using staining with annexin/propidium iodide and TdT-mediated dUTP nick-end labeling (TUNEL; Roche Diagnostics, Meylan, France) methods as previously described.35 Both staining methods were visualized on a FACScalibur flow cytometer. Characterization of apoptotic cells involved simultaneous tricolor fluorescence with TUNEL, anti-CD4, and anti-CD8 labeling.
Data analysis
The 2-tailed Student t test was used throughout except for microarray experiments. P below .05 was considered significant.
Results
Gene expression changes distinguish MG hyperplasias from healthy thymuses
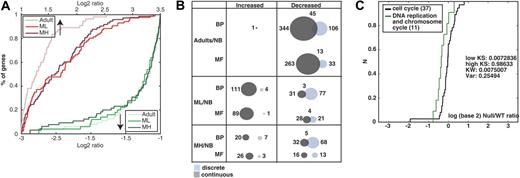
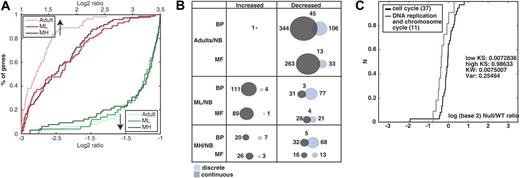
We first asked whether global extreme gene expression changes could distinguish among the 3 groups of thymic tissue: ML and MH from MG patients and adult controls compared with NBs. The ratios are presented as cumulative distribution function (CDF; Figure 1A). The adult/NB ratio increases were the least pronounced. The MH/NB ratio decreases were more pronounced than both ML/NB and adult/NB, suggesting association of changes with the severity of the observed pathologies (Figure 1A).
Thymic gene expression patterns distinguish MG thymuses from healthy subjects. (A) Classical, threshold-based histograms distinguished between extremely changed to unchanged genes in each comparison to newborns (NB). Overrepresented and underrepresented genes (upward, downward arrows) demonstrate the differences between NB thymus to the adult, ML, and MH thymuses. Shown is the percent of changed transcripts in each comparison (y-axis). Compared to NB, adult group increases were less pronounced than ML and MH. Visible extreme expression decreases appeared in the MH group compared with ML and adult groups expressed transcripts (dark green line). (B) Venn diagram presents the number of identified categories using GOdist (significance cutoff of 0.05). Overall, 1600 UniGene clusters had GO mapping with 1264 classified as Biological Process (BP) and 126 as Molecular Function (MF). The nature of change: discrete (light blue, Fisher exact test) or continuous (gray, KS test) and overlaps between detection methods is shown for each group compared with NB. (C) In the MH group, the term “DNA replication and chromosome cycle” decreased specifically compared with its GO parent according to the continuous approach. The change is demonstrated by the CDF plot. The term (green curve) is shifted to the left compared with the parent “cell cycle” (black curve). The change is further supported by the significance of KS test for the low tail (low KS P < .01).
Thymic gene expression patterns distinguish MG thymuses from healthy subjects. (A) Classical, threshold-based histograms distinguished between extremely changed to unchanged genes in each comparison to newborns (NB). Overrepresented and underrepresented genes (upward, downward arrows) demonstrate the differences between NB thymus to the adult, ML, and MH thymuses. Shown is the percent of changed transcripts in each comparison (y-axis). Compared to NB, adult group increases were less pronounced than ML and MH. Visible extreme expression decreases appeared in the MH group compared with ML and adult groups expressed transcripts (dark green line). (B) Venn diagram presents the number of identified categories using GOdist (significance cutoff of 0.05). Overall, 1600 UniGene clusters had GO mapping with 1264 classified as Biological Process (BP) and 126 as Molecular Function (MF). The nature of change: discrete (light blue, Fisher exact test) or continuous (gray, KS test) and overlaps between detection methods is shown for each group compared with NB. (C) In the MH group, the term “DNA replication and chromosome cycle” decreased specifically compared with its GO parent according to the continuous approach. The change is demonstrated by the CDF plot. The term (green curve) is shifted to the left compared with the parent “cell cycle” (black curve). The change is further supported by the significance of KS test for the low tail (low KS P < .01).
Then using both discrete and continuous statistical approaches, we detected functional categories overrepresented in the different thymic samples. Detailed results of selected enriched categories compared with the global population are given in Table 2Full lists of changed categories are shown in the Supplemental Materials. Generally, the continuous, more sensitive, method detected more changed GO categories than the discrete approach (Figure 1B). Importantly, combining these 2 methods together revealed additional information of disease-underlying changes.
MG-associated categories were previously found to be essentially related to the immune response and, in particular, to the antigen presentation category characterized by MHC class II molecules28,29 and will not be described in this report. Among the other main changes, we could detect increases in protein modification and transport as well as signal transduction especially in ML compared with NB. Also, differences in cell differentiation appeared to be modified in both MH and ML groups. Of note, the changes were opposite, probably due to the difference in cell contents between the 2 groups of thymuses (Table 2).
Because hyperplastic thymuses contain high numbers of proliferative cells,36 we expected to observe cell cycle-related changes. Analysis of cell cycle-associated categories showed very limited changes according to both approaches between healthy adults and patients compared with the global array population. Therefore, we searched for specific changes in GO categories related to cell cycle, comparing them to their parent terms using the continuous approach. We found significant decreases in “DNA replication and chromosome cycle” in the MH/NB group compared with the direct GO parent, cell cycle with a change in location in the increase tail (ie, in the population medians), rather than in dispersion (Figure 1C, KW P < .01). We conclude that thymic hyperplasia is associated with lower DNA replication activities in the myasthenic thymus, perhaps reflecting the high differentiation and activation state of the thymic cells in the MG thymus.37,38
AChE-annotated categories demonstrate significant continuous change between healthy individuals and patients with MG
AChE is associated with proliferation21 and hyperplastic thymuses are a highly proliferative tissue.36 Using both approaches, we seemingly related observed changes in AChE-annotated GO categories (Table 2, marked with an asterisk). For example, “DNA replication and chromosome cycle” (GO ID: 67) decreased in both the MH and adult groups. Interestingly, the changes occurred in BP categories rather than MF, indicating that the AChE-affected functions in MG with hyperplasia reflect changes in processes, rather than specific functions.
MG-associated changes in AChE
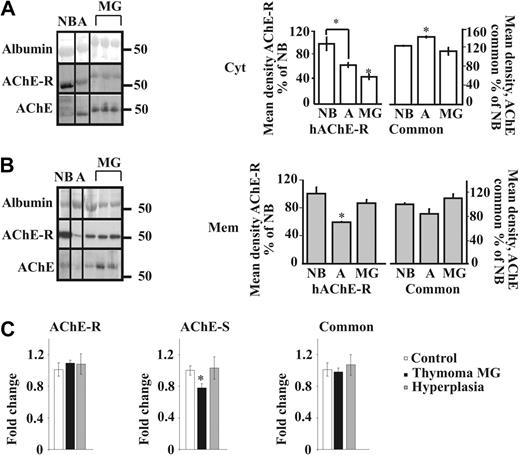
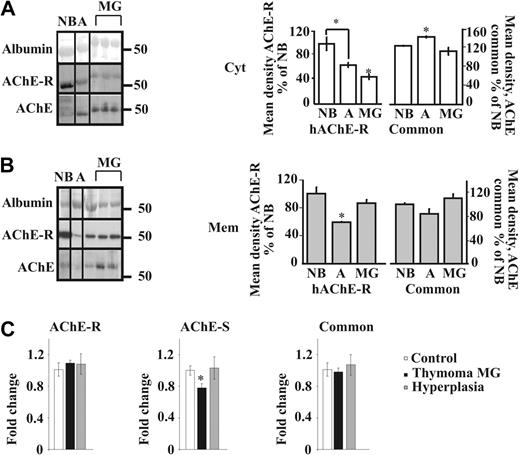
To analyze the relative expression of the different isoforms of AChE in thymic hyperplasia from MG patients, we used in parallel an antibody directed to the common region of all isoforms (N19) and another one specific to the C-terminal region of the AChE-R isoform on Western blots of proteins from cytoplasmic and membrane-enriched fractions (Figure S1B-C). Importantly, total cytoplasmic AChE increased from newborns to adults but decreased from adults to MG. AChE-R levels also decreased from adults to MG (Figure 2A). In the membrane fraction, we observed opposite nonsignificant trend of decrease in adults compared with NB, but an increase in MG compared with adults for total AChE, and a parallel significant change for AChE-R (Figure 2B). The “tailed” fraction (Figure S1B) showed no significant difference (data not shown). We could thus postulate that the modified localization of the common AChE in MG compared with adults is partly due to the translocation of the AChE-R isoform from the cytoplasm to the membrane.
Myasthenic translocation of thymic cytoplasmic AChE-R to the membrane. (A) Immunoblot of individual thymus samples subjected to a single electrophoresis test. Photographs were cropped as marked by the vertical lines. Cytoplasmic AChE (P = .007) and AChE-R (P = .007) decreased in MG patients compared with healthy adults. Cytoplasmic AChE-R decreased in healthy adults compared with newborns (P ≤ .01). (B) Membrane-associated AChE (P = .09) and AChE-R (P ≤ .01) increase in the myasthenic thymus. Membrane-associated AChE-R decreases in healthy adults compared with newborns (P ≤ .02). (C) Real-time RT-PCR on thymus AChE mRNA from thymoma patients with MG wcompared with that of hyperplasia patients and healthy adults. The AChE-S variant was decreased in thymoma patients compared with hyperplasia (P ≤ .02) and healthy adults (P ≤ .012). AChE-R mRNA was increased in thymoma patients with MG compared with the common AChE (P = .06) and AChE-S (P ≤ .02). No changes were seen between the 2 variants in hyperplasia patients and healthy adults. Error bars show standard error of the mean (SEM). *P < .05.
Myasthenic translocation of thymic cytoplasmic AChE-R to the membrane. (A) Immunoblot of individual thymus samples subjected to a single electrophoresis test. Photographs were cropped as marked by the vertical lines. Cytoplasmic AChE (P = .007) and AChE-R (P = .007) decreased in MG patients compared with healthy adults. Cytoplasmic AChE-R decreased in healthy adults compared with newborns (P ≤ .01). (B) Membrane-associated AChE (P = .09) and AChE-R (P ≤ .01) increase in the myasthenic thymus. Membrane-associated AChE-R decreases in healthy adults compared with newborns (P ≤ .02). (C) Real-time RT-PCR on thymus AChE mRNA from thymoma patients with MG wcompared with that of hyperplasia patients and healthy adults. The AChE-S variant was decreased in thymoma patients compared with hyperplasia (P ≤ .02) and healthy adults (P ≤ .012). AChE-R mRNA was increased in thymoma patients with MG compared with the common AChE (P = .06) and AChE-S (P ≤ .02). No changes were seen between the 2 variants in hyperplasia patients and healthy adults. Error bars show standard error of the mean (SEM). *P < .05.
Cortical thymoma is frequently found in MG patients and is characterized by the presence of a high number of cortical thymocytes.39 To explore the possibility that changes in AChE levels or properties are involved in thymopoiesis, real-time RT-PCR analyses were performed on cortical thymomcompared with healthy controls or MG hyperplasia. Results in Figure 2C indicate a moderate increase in AChE-R in thymoma patients with MG compared with the common AChE (P = .06) and a slight increase in AChE-R compared with AChE in patients with hyperplasia compared with healthy controls. No change was seen between the 2 variants in hyperplasia patients and healthy adults (Figure 2C), likely indicating that the changes observed at the protein level reflect posttranscriptional regulation. Interestingly, in MG thymoma, the AChE-S variant was reduced, suggesting a possible role for this isoform in thymocyte apoptosis.
Catalytically inactive AChE in MG
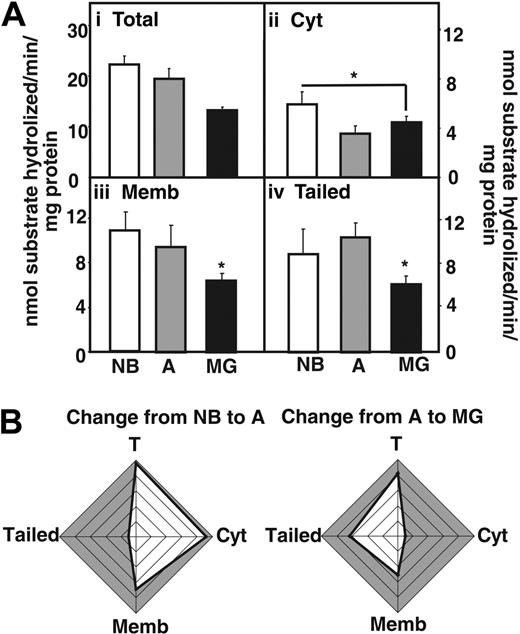
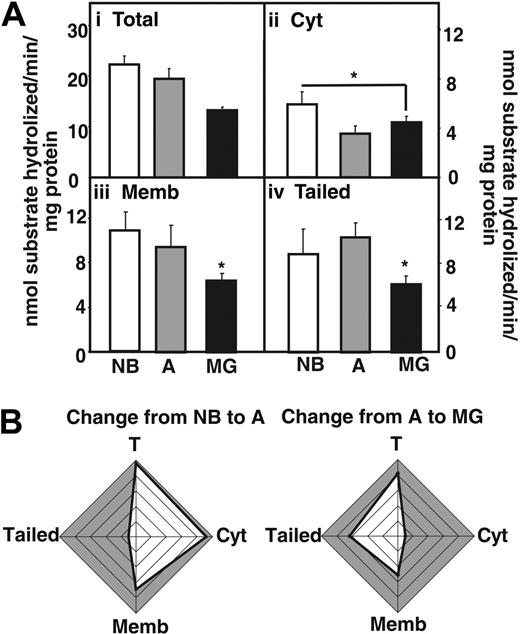
Next we measured acetylthiocholine hydrolytic activity in fractionated thymic homogenates (Figure 3A), using Iso-OMPA to selectively suppress butyrylcholinesterase activity. In MG patients, total AChE hydrolytic activities were decreased compared with NB and adults without myasthenias (Figure 3Ai). The cytoplasmic fraction showed reduced activity in MG patients and healthy adults compared with newborns, but no changes were visible between MG patients and healthy adults (Figure 3Aii). In comparison the decrease in AChE activity in MG patients compared with adults was significant both in fractions enriched with membrane-associated and “tailed” AChE (Figure 3Aiii-iv). Cumulative analysis highlighted the differences in these changes, with conspicuous decreases in adult cytoplasmic AChE and MG-associated decreases in the “tailed” enzyme fraction (Figure 3B). The decreased AChE activity could be attributed to the use of Mestinon, a reversible AChE inhibitor used in the treatment of the MG patients included in the study.
AChE activity decreases in the myasthenic thymus. (Ai) AChE hydrolytic activities in thymic homogenates from MG patients compared with newborns (NB) and nonmyasthenic adults. (Aii) Cytoplasmic AChE activity decreases in MG thymus compared with NB thymus (P ≤ .04). (Aiii) Membrane-associated AChE activity decreases in the thymus of MG patients compared with newborns (P ≤ .002) and healthy adults (P ≤ .04). (Aiv) Tailed AChE activity decreases in the thymus of MG patients compared with newborns (P ≤ .01) and healthy adults (P ≤ .008). Error bars show standard error of the mean (SEM). *P < .05. (B) Cumulative analysis highlighting differences in the changes described. Note conspicuous decreases in activity of adult soluble AChE and MG-associated membrane-adhered enzyme.
AChE activity decreases in the myasthenic thymus. (Ai) AChE hydrolytic activities in thymic homogenates from MG patients compared with newborns (NB) and nonmyasthenic adults. (Aii) Cytoplasmic AChE activity decreases in MG thymus compared with NB thymus (P ≤ .04). (Aiii) Membrane-associated AChE activity decreases in the thymus of MG patients compared with newborns (P ≤ .002) and healthy adults (P ≤ .04). (Aiv) Tailed AChE activity decreases in the thymus of MG patients compared with newborns (P ≤ .01) and healthy adults (P ≤ .008). Error bars show standard error of the mean (SEM). *P < .05. (B) Cumulative analysis highlighting differences in the changes described. Note conspicuous decreases in activity of adult soluble AChE and MG-associated membrane-adhered enzyme.
Altogether with the Western blot analysis, these results support the notion that membrane-associated AChE and AChE-R, devoid of catalytic activity accumulates in the myasthenic thymus. We thus investigated the potential new noncholinergic pathways that could be implicated.
Involvement of the PKC pathway
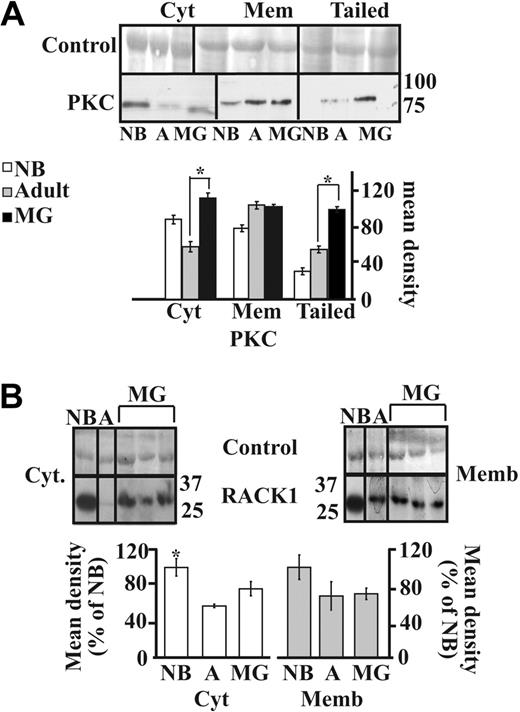
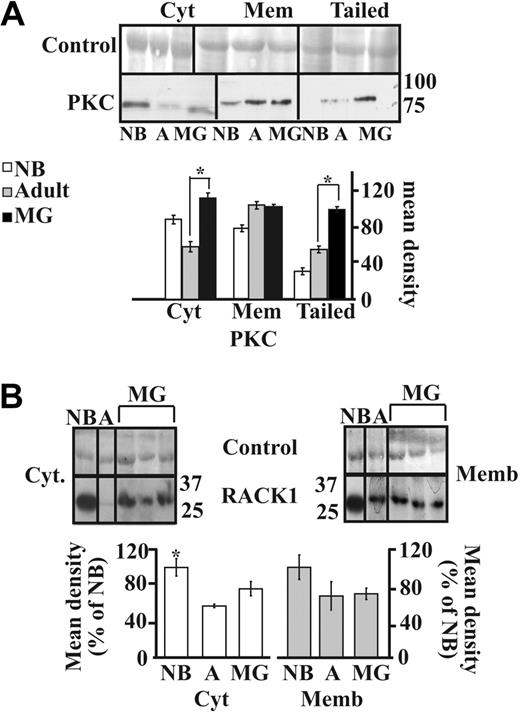
The AChE-R monomers can selectively interact with and elevate the amounts of the scaffold protein RACK1 and protein kinase C (PKC),19,23 which induces its mobilization into the plasma membrane.23 We thus analyzed the parallel expression of the RACK1 and PKCβII proteins in the different subcellular fractions. Immunolabeling of PKCβII showed significant increases in the cytoplasmic (P < .001) and tailed fractions (P < .001) but not membrane-associated PKCβII labeling from adults to MG patients, indicating that PKCβII is overexpressed in MG thymuses and translocates to the tightly membrane-associated fraction including the tailed AChE (Figure 4A).
PKC and RACK1 expression in MG thymus. (A) Immunolabeled PKC showed increases in cytoplasmic but not membrane-associated PKC labeling from adults to MG patients (P < .001). Most significant increases occurred in the tailed fraction (healthy adults to MG P < .001). (B) Immunoblot analysis of individual thymus samples subjected to a single electrophoresis run. Photographs were cropped as marked by the vertical lines. Cytoplasmic RACK1 showed a mild increase in MG patients compared with healthy adults and no difference in the membrane-associated RACK1. Error bars show standard error of the mean (SEM). *P < .05.
PKC and RACK1 expression in MG thymus. (A) Immunolabeled PKC showed increases in cytoplasmic but not membrane-associated PKC labeling from adults to MG patients (P < .001). Most significant increases occurred in the tailed fraction (healthy adults to MG P < .001). (B) Immunoblot analysis of individual thymus samples subjected to a single electrophoresis run. Photographs were cropped as marked by the vertical lines. Cytoplasmic RACK1 showed a mild increase in MG patients compared with healthy adults and no difference in the membrane-associated RACK1. Error bars show standard error of the mean (SEM). *P < .05.
RACK1 showed parallel increases from adults to MG patients in the cytoplasmic fraction but no change in the membrane-associated (Figure 4B) and in tailed fraction (data no shown). Mild cytoplasmic increases RACK1 in MG patients compared with healthy adults were accompanied by no changes in the membrane-associated fraction (Figure 4B), suggesting that the translocation of AChE-R to the membrane occurred independently from RACK1.
Altogether, these analyses demonstrated altered expression pattern of AChE-R associated with translocation of PKC to the membrane. To analyze whether these changes could be causally involved in the thymic pathologies, we studied the thymus of mice overexpressing the AChE-R variant.
Thymopoietic effects of AChE-R splice variant
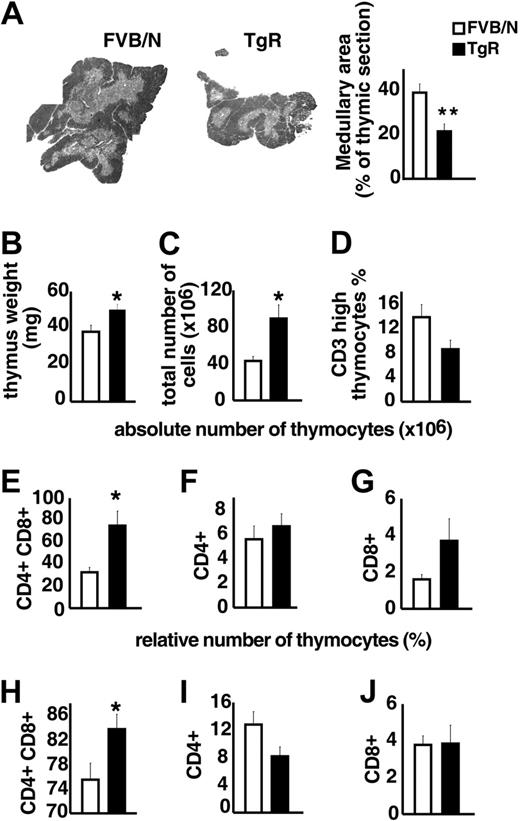
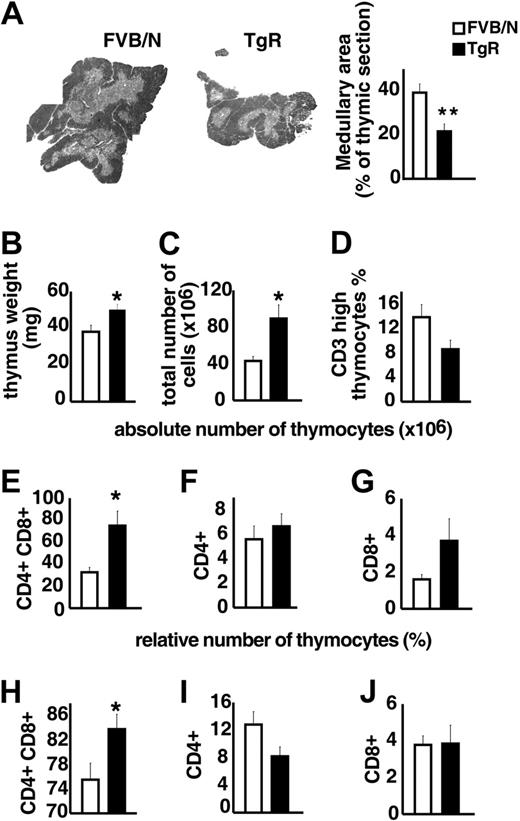
TgR mice overexpressing AChE-R served to test the influence of AChE-R on thymic differentiation and proliferation. Medullary areas were considerably smaller in TgR compared with strain-matched FVB/N controls (Figure 5A), supporting the notion that overexpressed AChE-R may influence thymocyte differentiation. Thymic weight, in contrast was significantly increased in TgR mice (Figure 5B). TgR thymuses further contained significantly more thymocytes than FVB/N controls (Figure 5C). Specifically, thymuses from TgR mice included fewer CD3high thymocytes, compared with FVB/N controls, indicating a deficit in thymocyte maturation (Figure 5D). Staining with anti-CD4 and anti-CD8 antibodies served to define the major thymic subsets according to their differentiation state (Figure 5E-J). In TgR mice, the absolute number of the double-positive (DP) subset was 2-fold increased compared with FVB/N controls (75 ± 13× 106 and 32.7 ± 4.3 × 10⁶, respectively; P < .05; Figure 5E). The relative analysis of the thymic subpopulations indicates that CD8+ subset remained unchanged, whereas the CD4+ subset was reduced in AChE-R–overexpressing thymuses (Figure 5I-J), counterbalanced by an increase in the percentage of CD4+CD8+ cells (Figure 5H).
Thymopoietic effects of the AChE-R splice variant. (A) Medullary areas in TgR and strain-matched FVB/N controls (P ≤ .01). (B) Heavier thymus weight in TgR mice (P ≤ .009). (C) Total numbers of thymocytes in TgR compared with FVB/N mice (P ≤ .007). (D). Thymuses from TgR mice included fewer CD3high thymocytes compared with FVB/N controls (P = .065). (E-G) Absolute number of CD4+CD8+, CD4+, and CD8+ thymic subsets. Note that, in TgR mice, the increased absolute cell number (panel C) was mainly due to the major double-positive (DP) subset, which was 2-fold increased compared with FVB/N controls (P ≤ .006; panel E), whereas CD4+ mature single-positive cells remained unchanged (F) and CD8+ subset increased (2-fold) but still remained the minority subset. (H-J) Relative number of those subsets brings further information. Increased CD4+CD8+ cell percentage (H) in transgenic thymuses (P ≤ .02) counterbalanced by a reduced percentage of CD4+ subset (I; P = .075) while the percentage of CD8+ subset (J) remained unchanged. Error bars show standard error of the mean (SEM). *P < .05.
Thymopoietic effects of the AChE-R splice variant. (A) Medullary areas in TgR and strain-matched FVB/N controls (P ≤ .01). (B) Heavier thymus weight in TgR mice (P ≤ .009). (C) Total numbers of thymocytes in TgR compared with FVB/N mice (P ≤ .007). (D). Thymuses from TgR mice included fewer CD3high thymocytes compared with FVB/N controls (P = .065). (E-G) Absolute number of CD4+CD8+, CD4+, and CD8+ thymic subsets. Note that, in TgR mice, the increased absolute cell number (panel C) was mainly due to the major double-positive (DP) subset, which was 2-fold increased compared with FVB/N controls (P ≤ .006; panel E), whereas CD4+ mature single-positive cells remained unchanged (F) and CD8+ subset increased (2-fold) but still remained the minority subset. (H-J) Relative number of those subsets brings further information. Increased CD4+CD8+ cell percentage (H) in transgenic thymuses (P ≤ .02) counterbalanced by a reduced percentage of CD4+ subset (I; P = .075) while the percentage of CD8+ subset (J) remained unchanged. Error bars show standard error of the mean (SEM). *P < .05.
Overexpression of this particular AChE-R variant thus disturbs thymus organization and leads to a pronounced increase in DP thymocyte number and a decrease in the number of mature CD3high cells, expressing essentially the CD4 marker.
Transgenic excess of AChE-R elevates thymic PKC levels
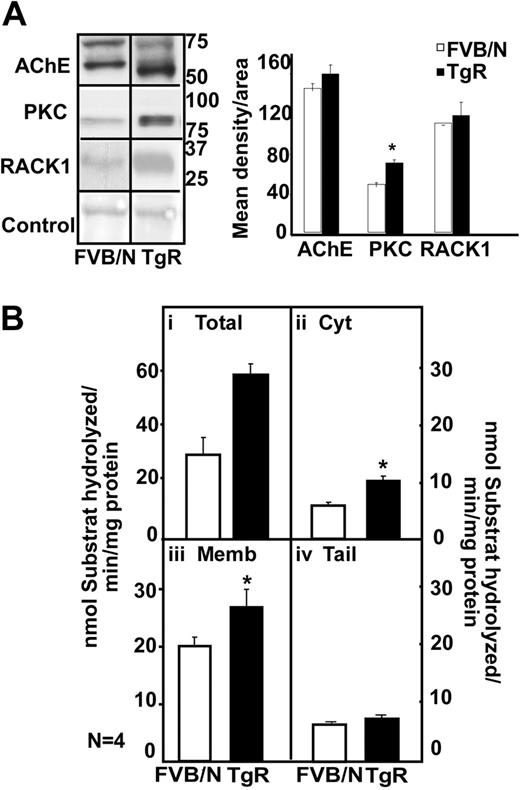
To test whether excess thymic AChE-R spontaneously loses its catalytic activity, we compared AChE activities with its immunolabeling in thymuses of TgR mice and in strain-matched FVB/N controls.
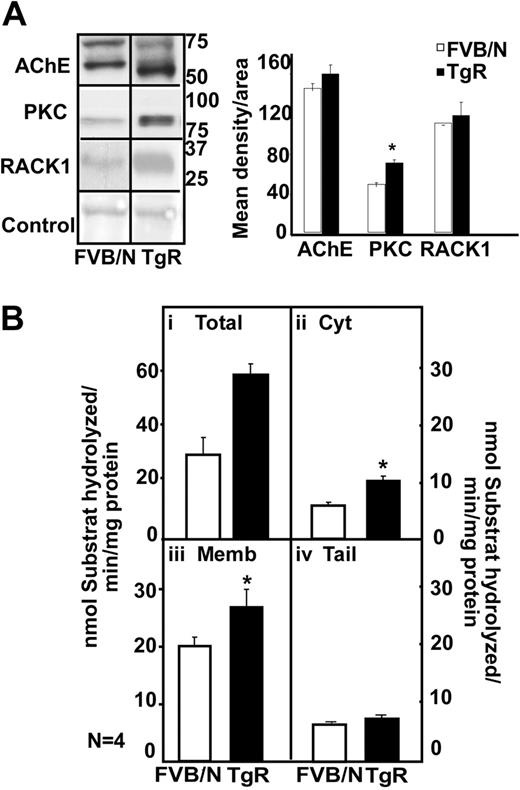
In the thymus, immunoblot analysis showed 2 bands of 70 and 60 kDa for the FVB/N mouse, a prominent overproduction of a 55-kDa hAChE-R band in TgR mice (Figure 6A). In parallel to the AChE-R increase, TgR mice showed PKC and RACK1 overexpression (Figure 6A). Thymic homogenates from TgR mice further showed a 2-fold increase in hydrolytic AChE activity (Figure 6Bi; P < .01). TgR thymic increases were predictably observed in the cytoplasmic (P ≤ .003) and membrane-associated (P = .06; Figure 6Bii-iii) but not the tailed fraction (Figure 6Biv). We conclude that transgenic excess of AChE-R accumulation does not by itself imply decrease in its activity and that active AChE-R excess does induce PKC and RACK1 elevation in the thymus.
Transgenic excess of AChE-R elevates thymic PKC and RACK1 levels. (A) Immunoblot analysis of a single electrophoresis run photographs were cropped as marked by vertical lines. Analysis shows 70- and 60-kDa bands for the FVB/N mouse, a prominent overproduction of a 55-kDa hAChE-R band in TgR mice. TgR thymuses showed PKC (P = .008) and RACK1 overexpression, for equal protein amounts. (B) Hydrolytic AChE activity in TgR. It increased in total thymic homogenates (i) (P < .01), in cytoplasm (ii; P = .003) and in membrane-associated AChE (iii; P = .06) but not in tailed fraction (iv). Error bars show standard error of the mean (SEM). *P < .05.
Transgenic excess of AChE-R elevates thymic PKC and RACK1 levels. (A) Immunoblot analysis of a single electrophoresis run photographs were cropped as marked by vertical lines. Analysis shows 70- and 60-kDa bands for the FVB/N mouse, a prominent overproduction of a 55-kDa hAChE-R band in TgR mice. TgR thymuses showed PKC (P = .008) and RACK1 overexpression, for equal protein amounts. (B) Hydrolytic AChE activity in TgR. It increased in total thymic homogenates (i) (P < .01), in cytoplasm (ii; P = .003) and in membrane-associated AChE (iii; P = .06) but not in tailed fraction (iv). Error bars show standard error of the mean (SEM). *P < .05.
Apoptosis differences in AChE-R transgenic thymuses
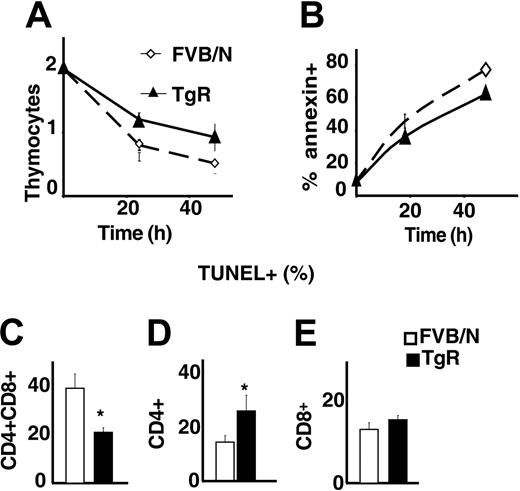
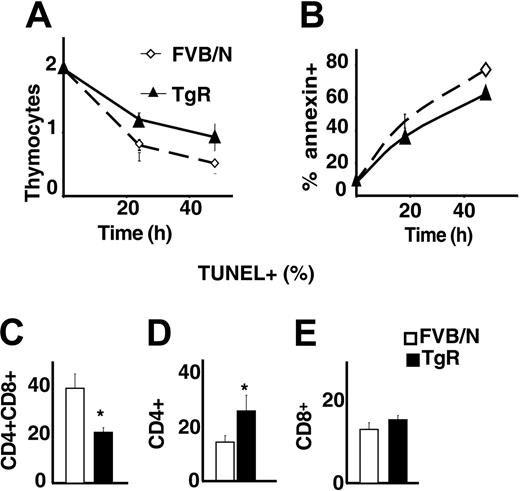
Because total numbers of thymocytes were increased in AChE-R transgenic mice, we wondered whether the overexpression of this variant could influence the apoptosis of thymocytes. Live thymocyte counts were compared with those of annexin-positive and TUNEL-positive cells following 1 or 2 days in culture. As shown in Figure 7A-B, thymocytes grown from TgR mice were less sensitive to spontaneous apoptosis than controls. Costaining with CD4/CD8 showed that TgR DP thymocytes, in particular, were less sensitive to apoptosis (Figure 7C) than CD4+ or CD8+ cells (Figure 7D-E). This could explain the previously observed abundance of DP cells in TgR thymuses and the lower percentage of CD4+ cells in those thymuses (Figure 5H-J).
AChE-R thymocytes are more resistant to apoptosis. (A) Living thymocytes count after 1 and 2 days of culture showed that TgR thymocytes are more resistant to apoptosis. This was confirmed by annexin staining (B). (C-E) TUNEL staining on different thymocyte subsets. CD4+CD8+ (C) from TgR mice are less sensitive (P < .05) and CD4+ (D) more sensitive (P < .01) to spontaneous apoptosis, whereas sensitivity of the CD8+ subset is unchanged. Error bars show standard error of the mean (SEM). *P < .05.
AChE-R thymocytes are more resistant to apoptosis. (A) Living thymocytes count after 1 and 2 days of culture showed that TgR thymocytes are more resistant to apoptosis. This was confirmed by annexin staining (B). (C-E) TUNEL staining on different thymocyte subsets. CD4+CD8+ (C) from TgR mice are less sensitive (P < .05) and CD4+ (D) more sensitive (P < .01) to spontaneous apoptosis, whereas sensitivity of the CD8+ subset is unchanged. Error bars show standard error of the mean (SEM). *P < .05.
Discussion
Using a plethora of molecular biology, biochemistry, and transgenic engineering techniques, we explored the putative association of altered AChE gene expression with the thymic pathologies characteristic of MG. First, large-scale microarray analysis showed a general decrease in gene expression of the adult healthy thymus, but increase in patients with MG-induced thymic hyperplasia. Importantly, we also found changes in GO categories to which AChE is annotated between healthy and both types of tested patients displaying different degrees of hyperplasia (MH and ML). Although AChE is annotated to both BP and MF GO categories, significant changes occurred only in AChE-annotated BP categories, indicating that AChE affects global, rather than specific, molecular mechanisms both in MG thymic hyperplasia and in healthy adults compared with newborns. We further found additional GO categories that may be involved in thymic pathology, such as cell and lymphocyte differentiation, which is compatible with the cytologic changes observed in the MG thymus pathologies.40
AChE-R promotes proliferation or protects thymocytes from apoptosis
Previous research described distinct roles for specific AChE isoforms in cell proliferation and apoptosis, both in brain and blood.19,41 Thus, AChE-S and AChE-Sin both suppressed progenitor proliferation in neocortical development of transgenic mice,41 whereas AChE-R, and its cleavable C-terminal peptide ARP, both promote proliferation of CD34+ blood cell progenitors.21,42 On the other hand, AChE-S was reported to induce apoptosis43,44 through facilitating apoptosome formation.
In MG disease, the thymus is the site of cell activation and high proliferation.45 Interestingly, in the MG thymus, AChE-R was found to be increased in the membrane fraction, but not in the cytoplasm, indicating that AChE-R is translocated to the membrane-associated fraction. This phenomenon could reflect the activation state of the thymic cells, as it was observed in hippocampal neurons under stress.23 Most of the MG AChE protein was hydrolytically inactive, compatible with findings of others who noted that much of the nascent AChE molecules remain inactive.46 Together with data showing AChE-R increase in the serum of MG patients,20 these results suggested the influence of AChE-R in MG thymic pathology.
To challenge this hypothesis, we analyzed the thymus of TgR mice compared with that of strain-matched FVB/N controls. We found an increase in both AChE immunolabeling and hydrolytic activity, suggesting that AChE inactivation in MG is not caused by its overexpression; however, the increase in PKC immunolabeling, in TgR mice, indicated that the AChE-R variant induces PKC-βII elevation in the thymus. Similarly to thymus from MG patients, the thymus from TgR mice displays an abnormally high number of thymocytes compared with control mice. Interestingly, this increased number was not due to an increased number of mature cells but rather to increased DP immature T cells. These results are compatible with a previously published report showing that AChE-R promotes the proliferation of progenitor cells.21 This could also be explained by a role of the overexpressed PKCβII in the TgR DP cells, because PKCβII was shown to play a role BCR survival signaling.47 Alternatively, AChE-R could protect DP thymocytes from apoptosis, by maintaining a high level of Bcl2 for example. Indeed there is a relationship between AChE and Bcl-2.48
To explain the high number of thymocytes in the AChE-R mice, we propose 3 nonmutually exclusive hypotheses: (1) AChE-R could be produced by cortical stromal cells and exert a protective signal from apoptosis to the neighboring thymocytes. It is well established that the cortical epithelium is the major player of the positive selection and that DP cells located in the cortex require signals in contact with the cortical epithelium to survive.49–51 Therefore, the positive selection process could be more efficient in TgR mice than in normal mice. (2) AChE-R could be produced by the thymocytes themselves. Our data showing that thymocytes from AChE-R mice cultured in vitro are more resistant to apoptosis than normal thymocytes, even in the absence of stromal cells are in favor of this hypothesis. (3) Another possibility is that the cholinergic signals and the catalytic activity of AChE influence thymocytic apoptosis, but this effect is counterbalanced by a proliferative effect that could be predominant for the AChE-R form and the ARP peptide. This hypothesis is likely because we found more proliferating cells (expressing the Ki67 antigen) in the thymus of AChE-R transgenic mice compared with control mice (data not shown).
Unique translocation of AChE-R to the membrane in the MG thymus
At the protein level, MG thymuses showed overexpressed AChE-R with reduced hydrolytic activity, which translocated from the cytoplasm to the membrane along with increased expression of the signaling protein kinase PKC-βII. In comparison, thymuses of TgR mice display similar characteristics for PKC expression, indicating that the increased PKC expression in MG thymic hyperplasia could be caused by the overexpression of AChE-R. Previous research demonstrated that under AChE-R accumulation, activated PKC translocates from the cytoplasm in both brain and blood cells to the plasma membrane.19,52,53
All PKC isoforms include a regulatory and a catalytic domain. An increase in cellular Ca+2 or diacylglycerol (DAG) recruits PKC to the plasma membrane and induces a conformational change that exposes the catalytic domain.54 Adhesion receptors of the integrin family function as connectors and signal transducers between the cell surface and the cytoskeleton.55 The adhesion of cells to integrin ligands induces cell migration, in many of these cases. PKC is essential for such signal transduction, and previous research indicated a role for PKC-β in the migration of T cells.56 Thus, T cells devoid of PKC-β do not migrate on LFA-1 ligand and this migration can be restored by expression of PKC-β, suggesting that PKC-β may play a role in the migration of MG thymocytes and that the AChE-R associated changes in thymic PKC-βII are physiologically relevant.
AChE-R changes during thymus aging
The multileveled increase in gene expression in thymic hyperplasia reflects opposite effects to those observed during thymic development. In both humans and rats, the aging thymus undergoes programmed deterioration correlated with increased thymic AChE expression,25 in accordance with our results with the common anti-AChE antibodies. Previous research showed an age-related increase in serum AChE.57 Our data show significantly decreased AChE-R expression in adults compared with newborns in both the cytoplasmic and membrane-associated thymic fractions, suggesting causal involvement of AChE-R in thymus development and aging. AChE-R can thus be viewed as an indicator of thymic status, decreased in degenerative-aging thymus but overexpressed in membrane cell fractions of hyperplastic-myasthenic thymus.
Together, our research sheds new light on the thymic role in MG, demonstrates the existence of membranal, albeit catalytically inactive AChE-R in the MG thymus, and suggests that this variant induces active thymopoiesis and reduces apoptosis. To date, most of the pharmacologic approaches to MG are aimed at AChE inhibition and anti-inflammation.58 However, AChE inhibitors notably induce the accumulation of AChE-R.8,59 This could reduce ACh levels, inhibiting the cholinergic capacity to limit the production of proinflammatory cytokines.60 In addition, AChE-R increases the proliferation rate of hematopoietic cells22 due to its noncatalytic functions. This, in turn may facilitate the progression of thymic hyperplasia or thymoma. To avoid this therapy-induced pathology, one might select the antisense approach,20 selectively destroying the AChE-R mRNA variant and thus limiting its proliferative effects.
Authorship
Contribution: S.B.A. and H.S. designed the study; A.G.G. and P.L. performed the research and contributed to the manuscript preparation; L.S. analyzed the microarray data; G.C.C. an R.L.P.R. performed the microarray experiments; F.T. contributed to the technical aspects of the research.
Conflict-of-interest disclosure: The authors declare no competing financial interests.
A.G.G. and P.L. contributed equally to this study.
Correspondence: Hermona Soreq, Silberman Building, Safra Campus-Givat Ram, Hebrew University of Jerusalem, Jerusalem, Israel; e-mail: soreq@cc.huji.ac.il.
The online version of this article contains a data supplement.
The publication costs of this article were defrayed in part by page charge payment. Therefore, and solely to indicate this fact, this article is hereby marked “advertisement” in accordance with 18 USC section 1734.
This work was supported by the Network of Excellence (NOE) (LSH-2004-1.15-3), German Ministry of Science (BMDF), Israel-German R&D cooperation and Ester Neuroscience (H.S.), and by the European Commission (QLG1-CT-2001-01918 and QLRT-2001-00225), the National Institutes of Health (NS39869), and the “Association Française contre les Myopathies” (AFM; S.B.-A.).
I.S. received a postdoctoral fellowship from the Israel Institute of Psychobiology. P.L. received a fellowship from AFM.
We are grateful to Dr Naomi Melamed-Book, Jerusalem for expert technical assistance. We thank Pr Dartevelle et Serraf for providing human thymic samples, and E. Dulmet and V. De Montpreville for histologic examinations of thymic and thymoma samples.

