Abstract
Recurrent genomic aberrations are important prognostic parameters in chronic lymphocytic leukemia (CLL). High-resolution 10k and 50k Affymetrix SNP arrays were evaluated as a diagnostic tool for CLL and revealed chromosomal imbalances in 65.6% and 81.5% of 70 consecutive cases, respectively. Among the prognostically important aberrations, the del13q14 was present in 36 (51.4%), trisomy 12 in 9 (12.8%), del11q22 in 9 (12.8%), and del17p13 in 4 cases (5.7%). A prominent clustering of breakpoints on both sides of the MIRN15A/MIRN16-1 genes indicated the presence of recombination hot spots in the 13q14 region. Patients with a monoallelic del13q14 had slower lymphocyte growth kinetics (P = .002) than patients with biallelic deletions. In 4 CLL cases with unmutated VH genes, a common minimal 3.5-Mb gain of 2p16 spanning the REL and BCL11A oncogenes was identified, implicating these genes in the pathogenesis of CLL. Twenty-four large (> 10 Mb) copy-neutral regions with loss of heterozygosity were identified in 14 cases. These regions with loss of heterozygosity are not detectable by alternative methods and may harbor novel imprinted genes or loss-of-function alleles that may be important for the pathogenesis of CLL. Genomic profiling with SNP arrays is a convenient and efficient screening method for simultaneous genome-wide detection of chromosomal aberrations.
Introduction
Chronic lymphocytic leukemia (CLL) is a heterogeneous disease with a wide variety of genetic aberrations.1 Common recurrent chromosomal changes of prognostic significance can be detected individually by classical cytogenetic analysis or fluorescent in situ hybridization (FISH).2 However, FISH analysis fails to define the extent of the genetic changes and ignores aberrations beyond those defined by the applied probe panel. Convenient genome-wide assays are therefore required to identify genetic mechanisms underlying the malignant transformation with high accuracy and to define additional genetic risk categories in CLL. Comparative genomic hybridization (CGH) with custom-made bacterial artificial chromosome (BAC) arrays3 or representational oligonucleotide microarray analysis (ROMA)4 have been proposed for this purpose. Because these arrays are not readily available, we explored commercially available, high-density single nucleotide polymorphism (SNP) arrays with 104 or 5 × 10⁴ SNPs to assess genetic aberrations in the tumor cells of patients with B-CLLs. Compared with conventional CGH or ROMA arrays, the SNP platform has the additional advantage of permitting the detection of regions with loss of heterozygosity (LOH) without loss of gene dosage. The feasibility of this technology for copy number analysis has been demonstrated recently for cultured cells5,6 and primary tumor samples.7,8
Patients, materials, and methods
Patient samples
Seventy consecutive patients with B-CLL with more than 30% lymphocytes in their differential blood counts and 10 healthy white volunteers were enrolled in this study. The patient characteristics are given in Table 1. The diagnosis of B-CLL was based on standard morphologic criteria and demonstration of a monoclonal CD5+ B-cell population by dual-color flow cytometry. The study was approved by the institutional ethics committee and all patients gave informed consent in accordance with the Declaration of Helsinki.
SNP mapping assay
Mononuclear cells (MNCs) were isolated from blood or bone marrow samples by Ficoll gradient centrifugation and analyzed without further tumor cell enrichment. Buccal swabs were used as nontumor controls for matched-pair analyses. gDNA was isolated using the DNeasy kit or the DNA/RNA kit (Qiagen, Hilden, Germany) for the simultaneous isolation of DNA and RNA. The SNP mapping assay was performed according to the protocol of the manufacturer (Affymetrix, Santa Clara, CA). Briefly, 250 ng DNA was digested with XbaI, ligated to the adaptor, and amplified by polymerase chain reaction (PCR) using a single primer. After purification of PCR products with the MinElute 96 UF PCR purification kit (Qiagen), amplicons were quantified, fragmented, labeled, and subsequently hybridized to 10k or 50k XbaI SNP mapping arrays. After washing and staining, the arrays were scanned for data analysis.
Data analysis
Genotypes were identified using GeneChip DNA Analysis (GDAS) software version 3.0 (Affymetrix). Copy numbers were analyzed for every chromosome with the chromosome copy number tool (CNAT) version 2.1.0.1 (Affymetrix) or for the entire genome with the dChip program version 2006.7,9 CNAT compares obtained SNP hybridization signal intensities with SNP intensity distributions of a reference set of more than 100 healthy individuals of different ethnicity. Copy number values, the significance of copy number variations, and LOH were calculated and plotted against the physical position of the SNPs along the chromosome. To calculate mean copy number values for selected regions, the output of CNAT was exported to Excel 2002 (Microsoft, Seattle, WA). For the analysis of 50k arrays, neighboring SNPs were grouped for a genome-smoothed analysis of copy number to reduce data noise (see Affymetrix chromosome copy number technote at www.affymetrix.com). Settings of 3 Mb and 0.5 Mb genomic smoothing were used for screening of imbalances and to determine the exact boundaries, respectively. The likelihood that a given stretch of homozygous SNPs is due to LOH was calculated based on allele frequencies in the reference set and displayed as the −log10 of the P value.6
The dChip program allows the copy number analysis against user-defined reference or matched-pair samples. Data were normalized to a baseline array with a median signal intensity with the invariant set normalization method.10 The model-based (PM/MM) method was used to obtain the signal values after normalization in dChip.11 To infer copy numbers, we used the paired normal sample as the reference and the median smoothing method with a window size of 10. For the calculation of LOH values, we used the Hidden Markov Model option from dChip with an LOH call threshold set to 0.95.
The Fisher exact test to determine correlations of genetic aberrations with VH mutational status was calculated with GraphPad Prism V3.0 (GraphPad Software, San Diego, CA).
FISH
For FISH analysis, MNCs were prepared similarly to cytogenetic analysis12 with slight modifications for adhesion slides (Marienfeld, Lauda-Koenigshofen, Germany). MNCs (3-5 × 10⁵) were treated with 200 μL hypotonic solution (0.075 M KCl) for 15 minutes at 37°C, dropped on adhesion slides, and incubated for another 10 minutes at room temperature. The cells were fixed twice with methanol/acetic acid (3:1) and stored at −20°C. The slides were pretreated and hybridized with fluorescence-labeled DNA probes (LSI p53, LSI ATM, LSI D13S25, and LSI p53/ATM/13q14/13q34/CEP12) according to the manufacturer's protocol (Abbott Molecular Diagnostics, Wiesbaden, Germany). For noncommercially available FISH probes, BAC clones, verified by FISH and mapped on the UCSC Golden Path Genome Sequence,13 were obtained from the German Resource Center for Genomic Research (RZPD; Berlin, Germany; www.rzpd.de). BACs were selected for their SNP content as visualized by the UCSC Genome browser.14
Digital images of interphase spreads embedded in Vectashield mounting medium (Vector Laboratories, Burlingame, CA) were recorded with a Sensys digital camera (Photometric, Tucson, AZ) on an Axioplan II fluorescence microscope (Zeiss, Jena, Germany) with Plan-Apochromat 63/40 or 100×/1.30 objectives (room temperature) using the Vysis workstation QUIPS (Vysis, Downers Grove, IL). Final images were prepared using Adobe Photoshop 6.0 software (Adobe Systems, San Jose, CA).
CLL kinetics
Linear regression analyses were performed for individual patients with GraphPad Prism software on all available consecutive lymphocyte counts during periods without cytoreductive therapy or other potential events influencing the leukocyte counts (eg, infections). Lymphocyte kinetics were compared between CLL groups defined by genetic aberrations with the Wilcoxon signed rank test (GraphPad Prism) of slope values obtained from these analyses. Time to treatment was defined as the time from diagnosis to the first cytoreductive therapy given for CLL. Treatment indications were defined by leukocyte counts more than 105/μL, thrombocytopenia less than 105/μL, occurrence of autoimmune hemolytic anemia, actual or impending symptoms from lymphadenopathy or splenomegaly, or presence of B symptoms. Time to treatment was compared between CLL groups by Kaplan-Meier analysis with the log-rank test (GraphPad Prism).
Results
Accuracy of whole-genome sampling analysis
The accuracy of whole-genome sampling analysis (WGSA)6 was determined. The mean genotyping call rates were 95.31% for the 10k and 98.46% for the 50k SNP arrays. Genotyping accuracy, as estimated by calculation of the frequency of heterozygous SNP calls of male X-chromosomal SNPs, was 99.97% and 99.84% for 10k and 50k arrays, respectively.
Reference data set versus matched-pair analysis
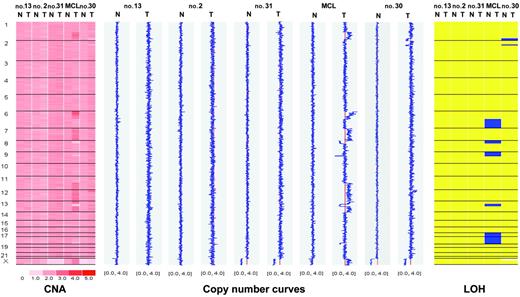
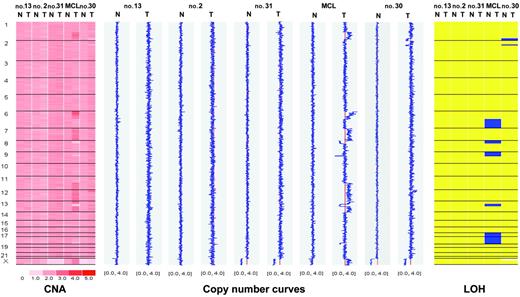
WGSA was initially performed on a test set of 5 cases (4 CLL, 1 mantle-cell lymphoma [MCL]) against autologous buccal swabs with dChip software for matched-pair analysis. Three CLL patients had no detectable aberration, whereas 3 deletions of a CLL patient (patient no. 30, Table 2) and more than 15 aberrations of a patient with MCL were readily detected (Figure 1 and data not shown). Virtually identical results were obtained by comparison against the reference data set with CNAT software as described (data not shown).6 Based on these results, subsequent CLL samples were analyzed with the CNAT program only.
Matched-pair analysis of tumor cells and buccal swabs from 4 patients with CLL and one patient with MCL. Chromosomes are separated by vertical lines and numbered on the left. Normal (N) and tumor (T) cells are represented in separate columns. Left panel: copy number values (CNA). Inferred copy numbers are displayed in a color-code from 0 to 5. Middle panel: copy number plot. Copy numbers are displayed from 0 to 4. The red line indicates a normal diploid copy number of 2. Right panel: LOH plot. Yellow color means retention and blue color, LOH. In the MCL sample, chromosomes 6q, 17, and 18 show complete uniparental disomy (UPD) with normal copy number.
Matched-pair analysis of tumor cells and buccal swabs from 4 patients with CLL and one patient with MCL. Chromosomes are separated by vertical lines and numbered on the left. Normal (N) and tumor (T) cells are represented in separate columns. Left panel: copy number values (CNA). Inferred copy numbers are displayed in a color-code from 0 to 5. Middle panel: copy number plot. Copy numbers are displayed from 0 to 4. The red line indicates a normal diploid copy number of 2. Right panel: LOH plot. Yellow color means retention and blue color, LOH. In the MCL sample, chromosomes 6q, 17, and 18 show complete uniparental disomy (UPD) with normal copy number.
The 10k versus 50k SNP arrays
Putative genetic deletions or amplifications were identified by searching for continuous stretches of SNPs with deviation in copy number from the expected normal value of around 2 for the normal diploid genome and concomitant significance values of calculated copy numbers of less than 10−20 for the 10k and less than 10−4 for the 50k arrays. The mean copy number of this stretch of the tumor sample and the corresponding region of all other samples without aberrations were then calculated. Putative aberrations were considered valid when the mean copy number of the sample was outside 2 standard deviations from the mean of the controls.
The interpretation of the 10k array results was hampered by a high copy number “noise” throughout the genome that could mask subtle copy number differences and could not be entirely compensated by adopting the highest possible P value of 20 as the significance threshold. Nevertheless, deletions were reliably identified with 10k arrays by combining information on copy number drop and concomitant homozygous genotype calls. The smallest detectable deletions outside the recurrent regions were represented by 9 SNPs on the 10k array and covered approximately 3 Mb (patient no. 44, Table 2). Identification of genetic gains relied entirely on copy numbers only. Therefore, the smallest gain we could identify was a 3.55-Mb region on 2p16 based on 12 SNPs that spanned 8 genes including the REL and BCL11A oncogenes (patient no. 3, Table 2) with a mean copy number of 3.88 versus 2.50 in the control. Because this value is similar to a trisomy of chromosome 12 (3.44 versus 2.25, patient no. 25 in Table 2), this low-level gain is equivalent to a duplication.
Copy number noise was found to be less in the 50k arrays. In addition, the smoothing function available for this array type greatly facilitated identification of aberrations. The smallest aberration identified with the 50k array was a 240-kb deletion as indicated by 11 adjacent SNPs with a mean copy number drop to 1.6 (patient no. 41, Table 2), compared with a mean value of 2.6 in the other samples without copy number variation in this region. Moreover, in regions of recurrent deletions, mean copy number values of already 3 SNPs predicted monoallelic or biallelic deletions as proven by FISH (patient no. 27, Table 2). We concluded that the 50k XbaI array is the preferable and more reliable platform for the detection of smaller aberrations and for the identification of hitherto unknown abnormalities.
Detection of recurrent and novel aberrations in CLL
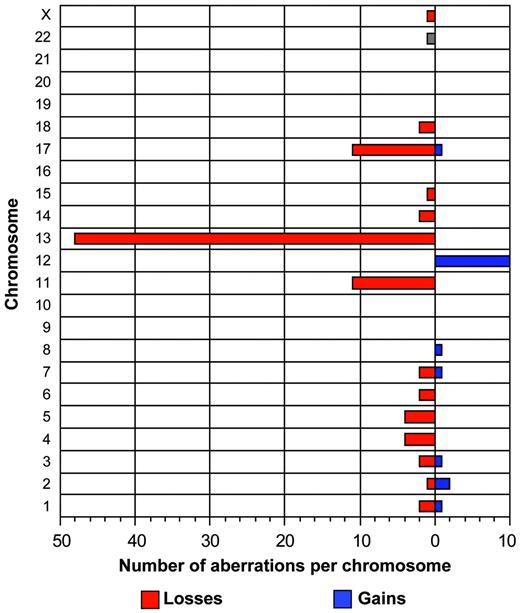
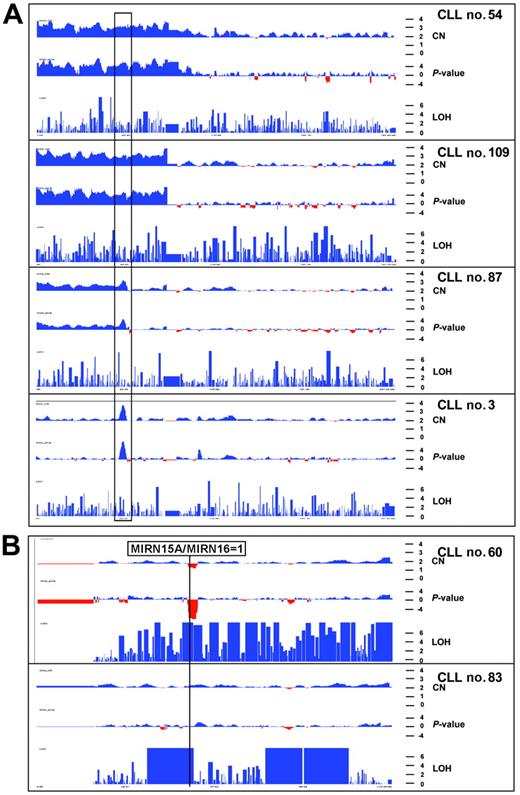
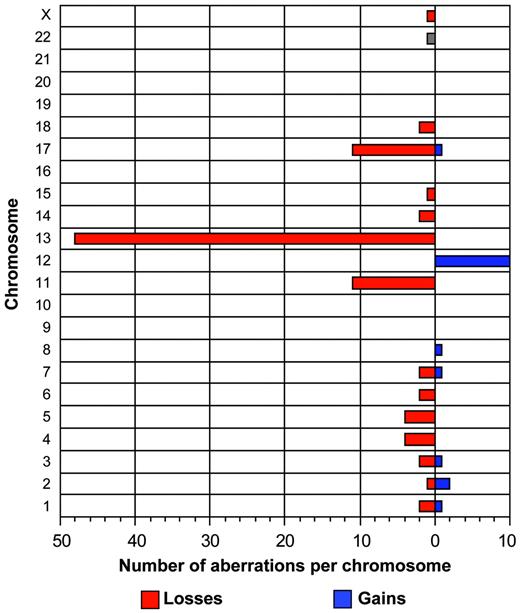
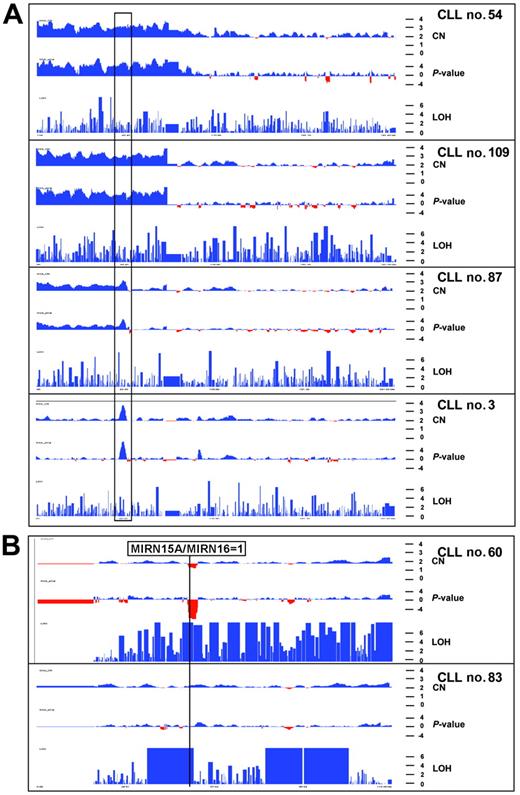
The tumor cell load in the samples varied between 30% and 99% (median, 82.9%) according to flow cytometry. Chromosomal abnormalities were detected in 52 (74%) of 70 patients. Specifically, we detected aberrations in 31 (81.5%) of 38 patients with the 50k and 21 (65.6%) of 32 patients with the 10k arrays. Sixteen patients had 1 aberration, 25 patients had 2 aberrations, and 11 patients had 3 or more aberrations with homozygous deletions counted as 2 aberrations. The overall incidence of aberrations was not different between patients with mutated and unmutated IgVH genes; however, the 2 recurrent aberrations associated with the worst prognosis occurred only in the unmutated group (Table 3). In addition to the common recurrent abnormalities (Table 2), gains and losses of various other chromosomes could be readily identified (Figure 2). Chromosomal gains (n = 20) were less frequent than chromosomal losses (n = 95). Four tumors (patients no. 30, 54, 62, 109) had genetic aberrations other than the recurrent abnormalities (Table 2). Interestingly, these regions partially overlapped with imbalances in other samples; for example, patients no. 54, 87, and 109 showed a full or partial trisomy of the short arm of chromosome 2, overlapping with a 3.5-Mb gain spanning the REL and BCL11A oncogenes in patient no. 3 (Figure 3). Moreover, patient no. 30 showed a 30-Mb deletion of the long arm of chromosome 1, overlapping with a 9.2-Mb deletion of 1q42 in patient no. 78. Patient no. 62 showed a trisomy of chromosome 3 as a single aberration.
Summary of total aberrations per chromosome in 70 CLL patients. This graph depicts the frequency of gains and losses per chromosome. In total, 20 gains and 95 losses have been identified.
Summary of total aberrations per chromosome in 70 CLL patients. This graph depicts the frequency of gains and losses per chromosome. In total, 20 gains and 95 losses have been identified.
Copy number profiles of chromosome 2 and 13 in 6 CLL patients. The x-axis shows physical position along the chromosome. Red and blue colors indicate copy number loss and gain as well as the −log10 copy number–associated P value in the top and middle panels, respectively. The y-axis (bottom panel) indicates −log10P value that homozygous stretches are due to chance. (A) Copy number and LOH profiles of 4 CLL patients with gains of chromosome 2p. Black rectangle indicates smallest region of overlap among the 4 aberrations. This gain of 3.5 Mb in patient no. 3 spans the REL and BCL11A oncogenes. (B) Copy number and LOH profile of chromosome 13 in 2 patients. Top panel shows biallelic deletion of the 13q14 region and LOH for almost the whole chromosome, indicative of a somatic recombination event. Due to the presence of normal cells, the LOH profile is not uniform because heterozygous SNP calls are still present and prevent more significant values. Bottom panel shows a profile of chromosome 13 with normal copy number but 3 large LOH regions totaling up to 40 Mb. The more proximal LOH spans the MIRN genes from the 13q14 region. These LOH regions are also present in the germline from this patient.
Copy number profiles of chromosome 2 and 13 in 6 CLL patients. The x-axis shows physical position along the chromosome. Red and blue colors indicate copy number loss and gain as well as the −log10 copy number–associated P value in the top and middle panels, respectively. The y-axis (bottom panel) indicates −log10P value that homozygous stretches are due to chance. (A) Copy number and LOH profiles of 4 CLL patients with gains of chromosome 2p. Black rectangle indicates smallest region of overlap among the 4 aberrations. This gain of 3.5 Mb in patient no. 3 spans the REL and BCL11A oncogenes. (B) Copy number and LOH profile of chromosome 13 in 2 patients. Top panel shows biallelic deletion of the 13q14 region and LOH for almost the whole chromosome, indicative of a somatic recombination event. Due to the presence of normal cells, the LOH profile is not uniform because heterozygous SNP calls are still present and prevent more significant values. Bottom panel shows a profile of chromosome 13 with normal copy number but 3 large LOH regions totaling up to 40 Mb. The more proximal LOH spans the MIRN genes from the 13q14 region. These LOH regions are also present in the germline from this patient.
All other aberrations were present in combination with one or more of the CLL recurrent gains and losses of chromosomes 11, 12, 13, and 17, respectively (Table 3). The 6q21 and 8q24 regions, known as recurrent imbalances in CLL, were not present as single aberrations but were associated with a deletion of the 11q23 region (Table 2). In 2 patients, terminal 11q deletions (11q24) were present either in association with an ATM deletion or a trisomy 12. Two other chromosomal regions (5q15 in patient no. 58 and 17q25 in patient no. 59) were deleted in more than one patient. Both deletions (6 Mb in 5q15 and 9.75 Mb in 17q25) overlapped with 2 small deletions in patient no. 41 (Table 2). The latter patient presented with a unusually large number of aberrations, possibly attributable to a cervical radiation therapy 2 years before the time of analysis.
The 13q14 deletions overlap in the MIRN15A/MIRN16-1 gene locus
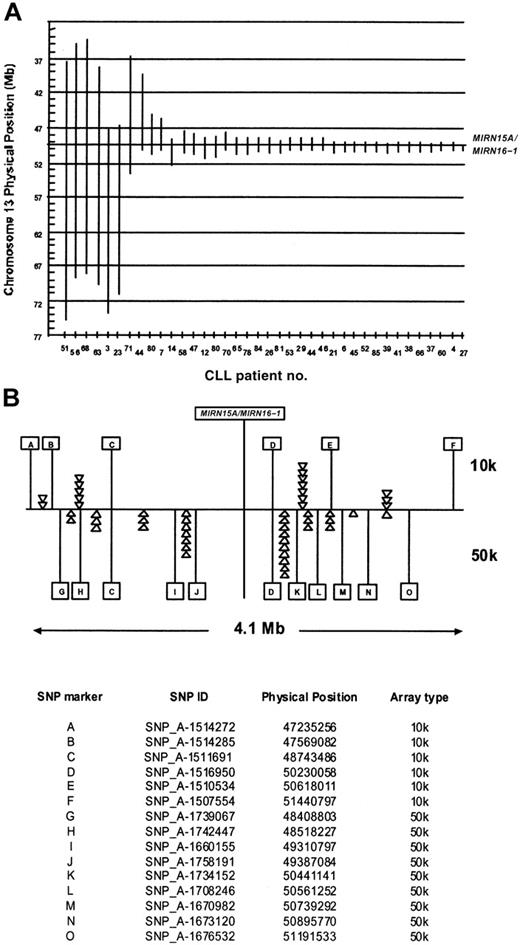
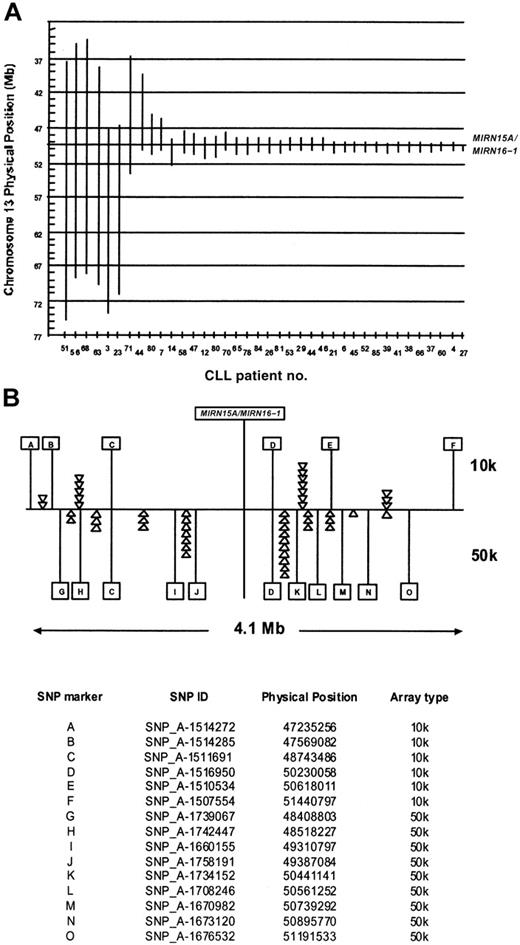
The deletion 13q14 was the most frequent aberration in our group of CLL patients. It was present in 12 patients as a single aberration, whereas 25 patients had a deletion of 13q14 with additional chromosomal abnormalities (Table 2). The deletion sizes varied from 0.5 to more than 37 Mb (Figure 4). Since the micro-RNA genes MIRN15A/MIRN16-1 on 13q14 have been identified as deleted or down-regulated in the majority of CLL patients,15 we compared the deletion boundaries in our samples with the physical position of the miR genes in the 225-bp interval between 49521114 bp and 49521339 bp on chromosome 13. The 2 patients (no. 27 and no. 37) have their proximal breakpoints located in the same SNP interval as the MIRN genes (not depicted in Figure 4); therefore the presence or absence of MIRN15A/MIRN16-1 cannot be unequivocally determined from the SNP data. All other patients with deletions in the 13q14 region have one or 2 copies of the MIRN genes deleted, depending on the monoallelic or biallelic nature of the deletion. Interestingly, the majority of the breakpoints seem to be clustered on both sides of the MIRN genes: 29 of 46 proximal breakpoints and 34 of 46 distal breakpoints were located in the 4.1-Mb interval between SNP_A-1512262 (47173413 bp) on the 10k array and SNP_A-1702099 (51356039 bp) on the 50k array.
Extension of chromosome 13q14 deletions with regard to the MIRN15A/MIRN16-1 genes. (A) Vertical bars are drawn to visualize the extent of the 13q14 deletions (ordered from left to right according to size) in CLL patients. The x- and y-axes denote the patient identification numbers and the physical position in Mb, respectively. The vertical line at around 49.5 Mb indicates the position of the MIRN15A/MIRN16-1 genes. In 2 patients (no. 44 and no. 80), biallelic deletions were present with the 2 alleles differing largely in size, allowing their distinction by copy number analysis. (B) The 4.1-Mb region around the MIRN genes. Letters denote individual SNPs that define by their presence or absence in which inter-SNP interval a breakpoint is located. The top panel shows 6 of 13 SNPs and the lower panel 11 of 48 SNPs present on the 10k and 50k arrays, respectively. The triangles denote one individual breakpoint defined by the presence of the SNP to the right (ie, on the distal side) and the absence of the SNP to the left (ie, on the proximal side). A prominent clustering of breakpoints in certain SNP intervals indicates potential recombination hot spots in this region. The table at the bottom of panel B indicates the allocation of letters and their corresponding SNPs on the 10-K and 50-K arrays.
Extension of chromosome 13q14 deletions with regard to the MIRN15A/MIRN16-1 genes. (A) Vertical bars are drawn to visualize the extent of the 13q14 deletions (ordered from left to right according to size) in CLL patients. The x- and y-axes denote the patient identification numbers and the physical position in Mb, respectively. The vertical line at around 49.5 Mb indicates the position of the MIRN15A/MIRN16-1 genes. In 2 patients (no. 44 and no. 80), biallelic deletions were present with the 2 alleles differing largely in size, allowing their distinction by copy number analysis. (B) The 4.1-Mb region around the MIRN genes. Letters denote individual SNPs that define by their presence or absence in which inter-SNP interval a breakpoint is located. The top panel shows 6 of 13 SNPs and the lower panel 11 of 48 SNPs present on the 10k and 50k arrays, respectively. The triangles denote one individual breakpoint defined by the presence of the SNP to the right (ie, on the distal side) and the absence of the SNP to the left (ie, on the proximal side). A prominent clustering of breakpoints in certain SNP intervals indicates potential recombination hot spots in this region. The table at the bottom of panel B indicates the allocation of letters and their corresponding SNPs on the 10-K and 50-K arrays.
Both the 10k and the 50k arrays allowed the detection of biallelic deletions in the 13q14 region. However, the central 500-kb core region of the smallest 13q14 deletions (physical position 49731408 bp to 50230058 bp, Table 2) is represented by only 3 SNPs, compared with 20 SNPs on the 10k and 50k SNP array, respectively. Consequently, minimal deletions may be missed with the 10k system.
In 2 patients with homozygous 13q14 deletions, the 2 alleles differed largely in size. Therefore, their individual extension could be identified by the copy number drop resulting at the transition from the monoallelic to the biallelic region (Table 2). In 3 patients with biallelic deletions of 13q14 (patients nos. 27 and 53, Table 2 and patient no. 60, Figure 5B) we found copy number-neutral LOH regions that started proximal to the deletion and extended to the end of the long arm of chromosome 13, indicating a somatic recombination event following the deletion of one parental allele.16
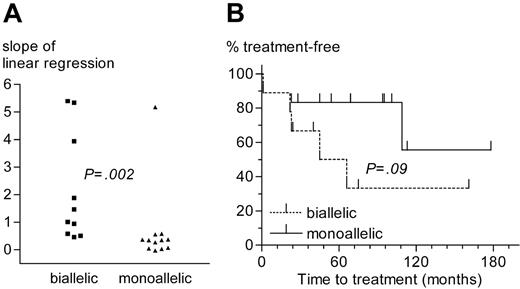
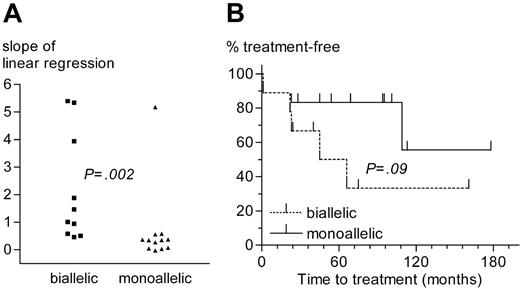
Comparison of CLL patients with monoallelic or biallelic del13q14 as the sole genetic aberration. (A) Slope of lymphocyte growth as determined by linear regression analysis. (B) Time from diagnosis to treatment.
Comparison of CLL patients with monoallelic or biallelic del13q14 as the sole genetic aberration. (A) Slope of lymphocyte growth as determined by linear regression analysis. (B) Time from diagnosis to treatment.
Almost one third of 13q14 deletions (10 of 36) were biallelic. The loss of the second allele seems to result from chromosomal evolution, because tumor samples with concomitant monoallelic and biallelic deletions (eg, patient no. 27, Table 2) can be found by FISH. CLL cases with biallelic del13q14 had faster lymphocyte growth kinetics and a trend for shorter time to treatment than cases with a monoallelic deletion as the sole aberration (Figure 5). No significant differences regarding other prognostic factors (age, sex, disease stage, VH mutational status, ZAP-70 expression, β2-microglobulin concentration, and numbers and type of prior treatments) existed between the monoallelic or biallelic deletion group, suggesting that the loss of the second 13q14 allele infers loss of a favorable prognosis and a more aggressive disease.
Validation of array results by interphase FISH
Of the 115 genetic aberrations detected by SNP arrays, 51 (43.9%) were subjected to analysis and confirmed by interphase FISH with appropriate probes (Table 2 and Table S1, which is available on the Blood website; see the Supplemental Table link at the top of the online article). With regard to the common recurrent aberrations, FISH analyses were not part of the diagnostic routine in all patients. The estimation of the sensitivity and specificity of the SNP analysis are therefore approximative. Among 81 FISH analyses performed for regions with recurrent aberrations, 38 (13, 7, 10, and 8 patients for 11q23, 12p11-q11, 13q14, and 17p13, respectively) showed 2 normal FISH signals. These regions were also classified as diploid by SNP analysis. Therefore, the specificity of the SNP arrays was nominally 100%. Forty-two deletions detected by FISH were correctly identified by SNP analysis. One small del11q23 was missed with the 10k array. This deletion was present in only 30% of tumor cells according to FISH and was located in a region with a low SNP density (data not shown). The sensitivity of SNP analysis with regard to the recurrent CLL aberrations was therefore calculated to be 97.6% (100% for the 50k array).
LOH regions with normal copy number
The largest LOH region with normal copy number observed in a group of 10 normal control samples was 7 Mb (data not shown). When 10 Mb was therefore set as the threshold to estimate the frequency of LOH regions in the CLL patients, 13 tumors in this cohort showed large regions of LOH (log10P values > 6) in various regions of the genome (Table 4). One to 5 LOH stretches (> 10 Mb) were discovered in 14 patients. We analyzed buccal cell DNA of patient no. 83 with 50k SNP array and discovered 5 large regions with copy-neutral LOH calls. All stretches with normal copy number were already present in the germline of this patient, and only LOH regions with associated deletions showed tumor-specific LOH calls. Notably, some LOH regions overlapped with chromosomal regions amplified or lost in other CLL patients (Table 4), for example, a 23.7-Mb LOH region on 13q14 ends telomeric to the MIRNA15A/MIRN16-1 genes, in the same interval as 10 of the 13q14 deletion breakpoints (Figure 3B, interval D-K in Figure 4B, and Table 4).
Discussion
This study demonstrates the feasibility, sensitivity, and high resolution of detecting genomic gains and losses in CLL with Affymetrix SNP mapping arrays. In contrast to genomic analysis of CLL with Matrix-CGH using DNA arrays with spotted BAC clones,3 these SNP oligonucleotide arrays are readily available and facilitate a simultaneous LOH analysis. In our hands, the convenience and reliability of this array format recommends its use in routine clinical analysis. Chromosomal aberrations were readily identified in 81.5% of our patients analyzed with the 50k array, which is in the same range that has been reported for FISH or matrix-CGH analysis.3,22 Overall, the somewhat lower detection rate of 65.6% with the 10k array favors higher density SNP arrays like the 50k or even 250k arrays for reliable detection of genomic abnormalities. Our data also indicate that the sensitivity of the SNP analysis permits omitting the purification of tumor cells if these constitute more than 30%. Additional putative aberrations that did not fulfill our rigid criteria may indicate low-frequency imbalances that may, for example, be attributable to the emergence of subclones during the process of tumor evolution. Therefore, nonsignificant copy number deviations (ie, gain or loss, patient no. 4 in Table S1) in regions with recurrent aberrations or of larger groups of SNPs should be assessed additionally with locus-specific tests such as FISH or quantitative PCR.
A matched-pair analysis with autologous nonneoplastic cells confirmed the validity of genetic aberrations as detected by comparison against a reference data set (Affymetrix Copy number tool 2.1.0.1).6 Although we cannot rule out the possibility that some detected aberrations may not be tumor specific, the reference data set may nevertheless suffice in daily practice and may also offer substantial savings.
Reliance on the reference data set also permits the recognition of copy-number polymorphisms in the human genome, which have recently been described as a new class of human genetic variation.23-25 These polymorphisms have a broad size distribution from 1 kb to more than 1000 kb. Because they are present in the germline, these regions cannot be recognized with a matched-pair analysis of autologous normal cells. Nevertheless, a rare polymorphism could still be interpreted as a tumor-associated deletion. To estimate the likelihood of such a false-positive result, we compared all aberrations identified in our CLL series with known polymorphic regions from the database of genomic variants (http://projects.tcag.ca/variation/index.html).24 Larger deletions with several Mb in size did overlap many of the polymorphic loci as would be expected by chance, yet they can be reliably distinguished solely by their vastly larger size. In contrast, CLL-associated deletions below 1 Mb (Table 2) had no overlap with known polymorphic loci.
Our high-resolution analysis confirms that the MIRN15A/MIRN16-1 genes are indeed the targets of the recurrent del13q14 in CLL. These results strengthen the conclusion that the MIRN15A/MIRN16-1 genes are indeed the critical genes for CLL pathogenesis in that region.15,26 Because the 13q14 breakpoints were preferentially clustered in defined SNP intervals (5 of 15 intervals on the 10k array and 9 of 45 intervals on the 50k array harbored deletion breakpoints in this region), we postulate the existence of identifiable recombination hot spots within these critical intervals. Such hot spots may also facilitate the relatively common occurrence of biallelic deletions in 13q14, which may be regarded as a common pathway for clonal evolution during disease progression. In this scenario, it is not surprising that our data indicate a loss of the favorable prognosis for the monoallelic del13q14 and a more aggressive disease course if a biallelic deletion has occurred. Whether this also translates into inferior survival of the affected patients remains to be investigated in prospective studies.
In 3 of the 11 biallelic 13q14 deletions, we identified a large LOH region that started proximal to the deleted segment and protruded to the telomeric end of the long arm of chromosome 13. This finding could be explained by a mechanism whereby a proximal 13q14 DNA double-strand break on the normal allele leads to loss of the distal arm that is repaired by a mitotic recombination event with the second allele harboring a small 13q14 deletion. This repair process is extended to the telomere of the chromosome, leading to a large uniparental disomy (UPD) for one parental allele and a homozygous loss of the deleted region.27 LOH without net loss of genetic material identified by SNP array technology has been described for cell lines,5,6 solid tumors such as oral squamous cell carcinomas,28 basal cell carcinomas,29 colorectal cancer,30 multiple myeloma,31 and acute myeloid leukemia (AML).8 The combination of both copy number analysis and LOH detection in a single assay is a clear advantage of this technology compared with other methods, such as array-CGH.
We have identified 4 patients who showed chromosomal imbalances not associated with recurrent aberrations. Trisomy 3 (patient no. 62) has been reported in atypical CLL as a sole abnormality32,33 and is a recurrent aberration in mantle cell and marginal zone lymphomas.34,35 Patient no. 30 presented with a partial trisomy of chromosome 12p and 2 additional deletions of 2p22 and 1q41-q44. Trisomy of chromosome 12 is a recurrent abnormality in CLL with 12q13 regarded as the locus important for the development of lymphoproliferative B-cell disorders. However, other small gains have been described outside 12q13 in CLL, arguing for additional regions in chromosome 12 to be involved in the pathogenesis or progression of CLL.36-38
Finally, identification of gains of 2p in 4 patients indicates a possible role for this region in the pathogenesis of CLL. Patient no.109 showed a whole-arm gain of 2p as the sole abnormality. Patient no. 54 presented with a whole-arm gain of 2p and concomitant loss of 18p, changes which might result from an unbalanced translocation, which have been described in approximately 17% of CLL cases.39 The small gain of the 2p region in patient no. 3 (Table 2; Figure 3A) terminates in the same region as the partial 2p gain of patient no. 87, defining the smallest region of overlap and pinpointing 2p16 as a critical region. At least 2 oncogenes, REL and BCL11A, are located within this 3.5-Mb gain of 2p16. This region is therefore clearly distinct from gains of the MYCN region on 2p24, which have been recognized, albeit not as single abnormalities, in several CLL patients.3 Notably, these 2p16 gains exclusively occurred in tumors with unmutated VH genes (P = .023) and may contribute to the poor prognosis of this CLL subgroup.
Trisomy 2 as the sole abnormality has been described in CLL and may represent a marker of progression.19,40 In addition, gains of 2p16 have been described as recurrent aberration in lymphoid malignancies41-43 and in the transformation of follicular lymphoma to diffuse large-cell lymphoma.44 In the latter study, the deletion of chromosome 11q24 was described as a region harboring potential tumor suppressor genes outside the common 11q23 deletion, a notion supported by our data showing 2 deletions of 11q24 in our CLL cohort. Among other aberrations, patient no. 73 (Table 2) showed 2 small deletions on the short arm of chromosome 3. Four regions harboring putative tumor suppressor genes have been described on 3p, but both deletions map outside these regions.45 However, the putative tumor suppressor gene FOXP146 may have been removed by the more proximal deletion, although this cannot be revealed by the SNP data.
In conclusion, SNP arrays appear to be an excellent tool for the parallel analysis of copy number and LOH in patients with CLL. With this technique, recurrent as well as novel aberrations can be readily identified with high resolution. Our findings support the role of MIRN15A/MIRN16-1 as the important genes in the deletion hot spot 13q14. The newly identified gain of 2p16 points toward a potential role of the respective genes in the etiology of CLL. In addition, our data demonstrate that LOH with normal copy number occurs frequently in CLL, and often in regions with known genetic imbalances in CLL.
Authorship
Contribution: D.P. performed research, analyzed data, and wrote the paper; M.P. performed research, analyzed data, and wrote the paper; I.S. performed research; J.R. collected data and analyzed data; C.K. contributed vital analytical tools and analyzed data; U.M.M. contributed vital analytical tools; P.F. contributed vital analytical tools; J.T. contributed vital analytical tools; and H.V. designed research, analyzed data, and wrote the paper.
Conflict-of-interest disclosure: the authors declare no competing financial interests.
Correspondence: Hendrik Veelken, Freiburg University Medical Center, Department of Hematology/Oncology, Hugstetter Strasse 55, D-79106 Freiburg, Germany; e-mail: hendrik.veelken@uniklinik-freiburg.de.
The online version of this article contains a data supplement.
The publication costs of this article were defrayed in part by page charge payment. Therefore, and solely to indicate this fact, this article is hereby marked “advertisement” in accordance with 18 USC section 1734.
We are indebted to A. Lingnau, Proqinase AG, Freiburg, for continuous technical support. We thank R. Mertelsmann, Director of the Department of Hematology/Oncology, for generously assigning departmental funds to this project. We are grateful to L. Ahn-Veelken for critical reading of the manuscript.

