Abstract
In this study, we have elucidated the chromosomal imbalances in the multistep pathogenesis and delineated several critical tumor suppressor gene (TSG) loci in multiple myeloma (MM). By using comparative genomic hybridization, allelotyping, and multicolor interphase fluorescence in situ hybridization, 5 MM cell lines and bone marrow CD138+ plasma cells from 88 Chinese patients with monoclonal gammopathy of undetermined significance (MGUS) and early and advanced stages of MM were investigated. In all MGUS and MM samples, chromosome copy number abnormalities were detected. A higher number of chromosomal imbalances and specific genetic alterations are involved in MGUS to MM transition (−6q, +3p, and +1p) and MM progression (+2p and +9q). In addition to −13q, we first found high frequencies (42% to 46%) of −4q involving high percentages (70% to 74%) of clonal plasma cells in both MGUS and MM, suggesting that inactivation of TSG in this region is also a potentially critical genetic event in MM tumorigenesis. By high-resolution allelotyping, we defined a common deletion region on 4q13.3 and found that a candidate TSG, platelet factor 4, was frequently silenced by promoter hypermethylation in MM (15 of 28) and MM cell lines (5 of 5). These data have opened up a new approach in the molecular targeting therapy and provide novel insights into MM tumorigenesis.
Introduction
Multiple myeloma (MM) is a plasma cell (PC)–derived malignancy with an elusive oncogenesis. Clinical and genetic evidence has suggested a multistep tumorigenesis in which MM development is preceded by the monoclonal gammopathy of undetermined significance (MGUS).1,2 Insights into the MM etiology are largely hindered by the lack of cytogenetic and genetic data of this pre-MM condition. Limited by both the low proliferativity and infiltrations (less than 10%) of the PCs, few cytogenetic studies of MGUS have been reported. By interphase fluorescence in situ hybridization (FISH), aneuploid cells with multiple subclones were found in 57% of MGUS specimens.3 Similar to MM, frequent translocations involving IgH locus at 14q32 were also detected in MGUS.4 These data demonstrated that MGUS was cytogenetically abnormal, but information is only limited to those selected chromosomes and regions being studied. The global picture of the PC genome in MGUS remains unexplored. The genetic events underlying MGUS-MM transition and MM progression are still unclear. Previous studies using microsatellite markers have demonstrated loss of heterozygosity (LOH) of chromosome 13q in MM patients.5 Despite extensive mapping on 13q14, no tumor suppressor gene (TSG) involved in the MM tumorigenesis has been reported so far.5–7
To gain real insights into the genetic changes underlying the multistep tumorigenesis in MM and to identify novel MM-related TSGs, we investigated the malignant PC genome by combined molecular cytogenetic, allelotyping, and expression studies on a total of 88 MGUS and MM samples that were PC enriched using anti-CD138 immunomagnetic sorting. Chromosomal imbalances in MGUS and early and advanced MM were compared sequentially, and the minimal deleted regions (MDRs) were mapped to localize potential MM-related TSGs. Expression of candidate genes within the target MDRs was further examined to confirm their involvement in MM tumorigenesis.
Patients, materials, and methods
Approval was obtained from the Chinese University of Hong Kong institutional review board for these studies. Informed consent was provided according to the Declaration of Helsinki.
Cell lines
Myeloma-derived cell lines RPMI-8226, NCI-H929, U-266, LP-1, and OPM2 were purchased from American Type Culture Collection ([ATCC] Manassas, VA) and German Collection of Microorganisms and Cell Cultures (Deutsche Sammlung von Mikroorganismen und Kulturen [DSMZ], Braunschweig, Germany). These cell lines were cultured and maintained according to suppliers' recommendation and were used in FISH, gene expression, and methylation studies.
Patient samples
With informed consent, bone marrow (BM) aspirate samples were collected prospectively, prior to any treatments, in EDTA bottles from 88 Chinese patients diagnosed with MGUS (n = 19) or MM (n = 69) at the Prince of Wales Hospital and the Pamela Youde Nethersole Eastern Hospital of Hong Kong SAR from 2000 to 2004. The diagnosis and staging of MGUS and MM were made according to the criteria by the International Myeloma Working Group8 and Durie and Salmon,9 respectively. All materials were verified and analyzed in the Cytogenetic and Molecular Hematology Laboratories at the Prince of Wales Hospital. Table 1 summarizes the clinical and laboratory data of the 88 patients with MGUS and MM. All MGUS patients survived, but 20 MM patients died during the study period. All of the MGUS patients were referred from specialty clinics and suffered from concomitant medical conditions requiring active management.
Control samples
Ten peripheral blood (PB) samples from healthy volunteers and 5 BM specimens from individuals with reactive plasmacytosis were recruited for gene expression study as controls of normal peripheral blood mononuclear cells (PBMNCs) and bone marrow plasma cells (BMPCs).
Magnetic cell sorting of CD138+ plasma cells
Mononuclear cells (MNCs) from BM of patients with MGUS, MM, and reactive plasmacytosis were separated using Ficoll-Hypaque density gradient centrifugation (Amersham Biosciences, Piscataway, NJ). Immunomagnetic separation of PCs was performed using anti-CD138–conjugated microbeads (Miltenyi Biotec, Auburn, CA) and the immunomagnetic separation device (MiniMACS; Miltenyi Biotec) according to the manufacturer's protocol. The purity of PCs obtained was more than 95% as confirmed by morphologic inspection.
Comparative genomic hybridization
Genomic DNA was extracted from patients' sorted PCs and normal PB by conventional phenol/chloroform (Amersham Biosciences) method. Tumor DNA from immunomagnetically purified PCs and normal PB DNA from healthy volunteers were differentially labeled with biotin-16-dUTP or digoxigenin-11-dUTP (Roche, Mannheim, Germany) by nick translation, respectively. The labeled DNA and human Cot-1 DNA (Invitrogen, Carlsbad, CA) were cohybridized to normal, sex-matched metaphase slides for 72 hours at 37°C. After hybridization, the digoxigenin-labeled and biotin-labeled DNA were detected with rhodamine-conjugated antidigoxigenin (Roche) and FITC-conjugated avidin (Appligene Oncor, Carlsbad, CA) respectively. Chromosomes were counterstained with 4′6-diamidino-2-phenylindole dihydrochloride (DAPI) (Appligene Oncor) for identification. Images of the hybridized metaphases were acquired with a cooled charge-coupled device camera on the Axioplan 2 fluorescence microscope (Zeiss, Jena, Germany). The images were analyzed using ISIS3 software (MetaSystems, Altlussheim, Germany).
High-resolution allelotyping
Genomewide screening for allelic imbalances (AIs) was performed in 15 MGUS and 15 MM samples using the MD-10 Linkage Mapping Set version 2 (Applied Biosystems, Foster City, CA). A total of 400 microsatellite markers spanning the whole human genome at density of 10 cM were examined, and multiplex PCR reactions were performed according to manufacturer's recommendations. Pooled PCR products were electrophoresed on an ABI PRISM 377 autosequencer (Applied Biosystems). The gel images collected were analyzed with GeneScan Analysis Software version 3.1 (Applied Biosystems). AI was assessed for each informative locus of the MM samples (T) and their corresponding normal control (N) by calculating the allelic ratio (AR). The AR was determined by measuring the peak height of the smaller allele (N1 or T1) relative to that of the larger allele (N2 or T2). Depending on whether the smaller or the larger allele was lost, the AR values of less than 0.5 or more than 1.5 were considered to be indicative of AI.
cIg-FISH
Cytospin slides prepared from the BMPCs of MGUS/MM patients and MM cell lines were subjected to FISH analysis using standard procedure according to the manufacturer's protocol. The probes used were the human BAC clone RP11-19B4 (Sanger Institute, Cambridge, United Kingdom) at 4q13.3, subsequently labeled with SpectrumGreen-dUTP and SpectrumRed-dUTP with nick translation kit (Vysis, Downers Grove, IL) to produce a yellow signal, the LSI-13 SpectrumOrange probe at 13q14.2 (Vysis), and the CEP10 SpectrumGreen reference probe to centromeric region of chromosome 10 (Vysis). The cytoplasmic light chains were stained with clone-specific, FITC-labeled anti-κ and PE-labeled anti-λ antibodies (Beckman Coulter, Fullerton, CA). The cell nuclei were counterstained with DAPI. The slides were then put up for detection of FISH signals on the light chain–restricted clonal PCS.
RNA extraction and RT-PCR
Total RNA from the BMPCs of MM patients, MM cell lines, and normal PBMNCs and BMPCs were obtained by extraction using Trizol reagent (Invitrogen). First-strand cDNA was synthesized using MuLV reverse transcriptase and random hexamers (Applied Biosystems). Messenger RNA expression of putative genes as described in Figure 3 was assessed by semiquantitative reverse transcriptase–polymerase chain reaction (RT-PCR). Gene expression was normalized with respect to endogenous housekeeping control gene GAPDH. For further confirmation of gene expression of PF4, real-time RT-PCR was performed using iCycler real-time PCR detection system (Bio-Rad, Hercules, CA) and SYBR Green PCR master-mix (Applied Biosystems) with reactions for each sample done in triplicate. The expression level of the housekeeping gene ACTB for each sample was determined for normalization. Quantification of relative gene copy number was determined by comparative CT method.
Sodium bisulfite modification and sequencing
The methylation status of PF4 CpG sites was determined by bisulfite sequencing. Genomic DNA (1 μg) was subjected to bisulfite modification using the Methylamp DNA Modification Kit (Epigentek, New York, NY). Primers flanking the 5′ promoter region and exon 1 of PF4 (forward primer: 5′-TTGAGGTTGGAGGTTTTAGTTAAGGTA-3′, reverse primer: 5′-CCCCCAAACAAAAATTATTCTAACC-3′) were used for PCR amplification. The PCR product electrophoresed on 1.5% agarose gel was purified by the QIAquick Gel Extraction Kit (Qiagen, Hilden, Germany) and was cloned using the TA cloning kit (Invitrogen) and transformed into TOP10 competent cells (Invitrogen). Plasmid DNA from 5 bacterial colonies of each sample was extracted using the Mini-M Plasmid DNA extraction system (Viogene, Taipei, Taiwan) and sequenced using the DYEnamic ET Terminator Cycle Sequencing Kit (Amersham Biosciences) on MegaBACE DNA Analysis System (Amersham Biosciences).
5′-Aza-2′-deoxycytidine treatment
MM cell lines RPMI-8226, NCI-H929, U-266, LP-1, and OPM-2 were treated with the demethylating agent 5′-Aza-2′-deoxycytidine (5′-Aza) (Sigma-Aldrich, St Louis, MO) at concentrations of 1, 3, 5, and 10 μM for 4 days. After treatment, cells were harvested and subjected to RNA extraction for subsequent RT-PCR analysis.
Statistical analysis
Statistical analyses were performed using SPSS 10.1 software (SPSS, Chicago, IL). The median number of aberrations among MGUS, MM, and different stages of MM were compared by the median test and Mann-Whitney U test. For comparing the chromosomal abnormalities detected by comparative genomic hybridization (CGH) or karyotyping, frequencies of individual copy number abnormalities (CNAs) and CNA patterns between MGUS and MM, or frequencies among the pathological stages of MM, the Fisher exact test or Pearson χ2 test, where appropriate, was applied.
Results
Involvement of chromosomal imbalances in the multistep tumorigenesis of MM
Chromosomal imbalances in MGUS.
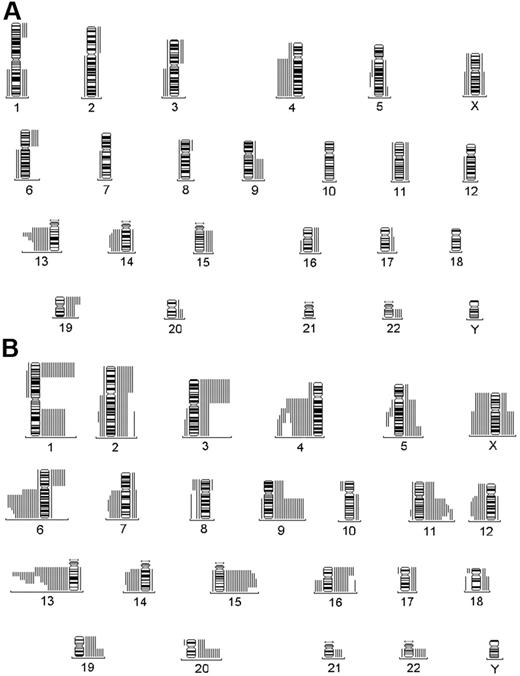
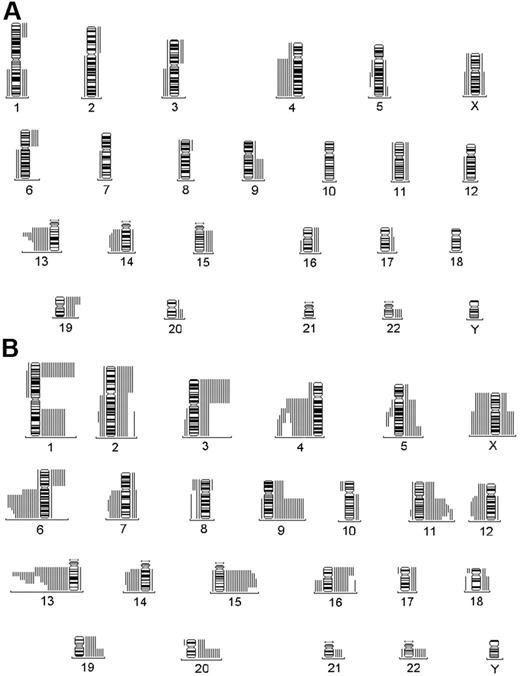
A total of 120 CNAs were identified in the MGUS group (n = 19) (Figure 1A). The median number of CNAs was 4, and most (75%) MGUS patients had up to 7.5 CNAs. The average numbers of chromosomal gain and loss per patient were 3.8 and 2.5, respectively (Table 2). Six MGUS patients showed chromosomal gains only, whereas none exhibited sole chromosomal losses (Table 2). Four CNAs, −13q, −4q, +19p, and −14q, were identified in more than 30% of the MGUS patients (Table 3). Of note, the only IgM-MGUS had +19p and −13q. Two consensus regions of losses, 13q14 and 14q13-q24, could be defined in the MGUS group (Figure 1A).
Genetic alterations by CGH. Summary of total genetic alterations detected by CGH in (A) MGUS and (B) MM. Each line represents the affected region of the chromosome in a single case. Gains are shown on the right side of the ideograms and losses on the left.
Genetic alterations by CGH. Summary of total genetic alterations detected by CGH in (A) MGUS and (B) MM. Each line represents the affected region of the chromosome in a single case. Gains are shown on the right side of the ideograms and losses on the left.
Chromosomal imbalances in MM.
A total of 395 CNAs were identified in the MM group (n = 41) (Figure 1B). The median number of CNAs was 8, and most (75%) MM patients had at least 14 CNAs. The average numbers of chromosomal gain and loss per patient were, respectively, 5.9 and 3.8. Five MM patients revealed sole chromosomal losses, whereas only 1 exhibited sole chromosomal gains (Table 2). Nine CNAs, −13q, −4q, +1p, +15q, −6q, +9q, +3p, +11q, and +1q, were identified in more than 30% of the MM patients (Table 3). Three consensus regions of gains at 5q32-qter, 11q22, and 15q22-q25 were found, whereas 7 consensus regions of losses, 4q13-q24, 5q21, 6q16-q22, 7q22-q31, 12q15-q24.1, 13q14, and 14q13-q24, were delineated (Figure 1B).
CNAs found in both MGUS and MM.
High frequencies of −13q, 78.9% and 80.5%, respectively, and -4q, 42.1%, and 46.3%, respectively, were identified in both MGUS and MM (Table 3), indicating that they are common events found in both stages. The fact that similar frequencies of −13q or −4q were observed in both cohorts suggests that they may not be involved in the MGUS-MM transition.
CNAs involved in MGUS-MM transition and MM progression.
Significantly higher frequencies of −6q (P = .019), +3p (P = 0.034), and +1p (P = .044) were found in the MM than MGUS group (Table 3), suggesting that these alterations may be positively selected for the MGUS-MM transition. On the other hand, +19p, found significantly more frequently in MGUS than MM patients (P = .046) (Table 3), may be a genetic event negatively selected for MGUS-MM transition. Accordingly, +2p (P = .017) and +9q (P = .041) showed significant increases of incidence from early to advanced MM stages (Table 4), supporting the hypothesis that there may be critical changes involved in MM progression.
Localization of tumor suppressor genes on 13q and 4q
Mapping of minimal deleted regions by allelotyping.
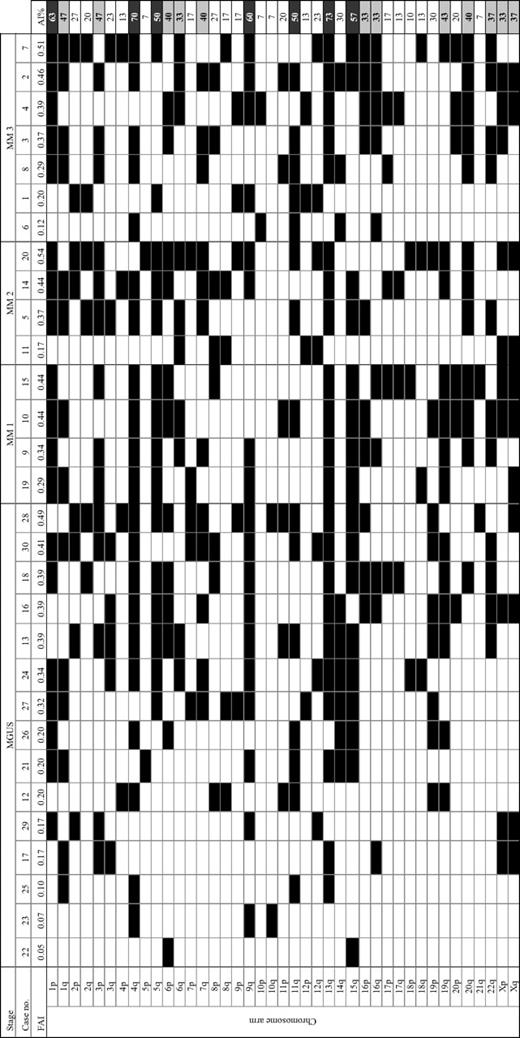
To define the minimal deleted regions (MDRs), BMPC samples from 15 MGUS and 15 MM (stage 1, 2, 3: 4, 4, 7 patients, respectively) patients with CGH information were further selected for allelotyping analysis. The average number of informative loci in these samples was 292 of 400 microsatellite markers analyzed (73%), ranging from 69% to 83%. Frequencies of AI on 41 chromosomal arms ranged from 7% (10p, 10q, 21q) to 73% (13q), with an average of 31% ± 18%. Chromosomal arms with significant (mean + 1 standard deviation) frequencies of AI were 13q (73%), 4q (70%), 1p (63%), 9q (60%), 15q (57%), 5q (50%), and 11q (50%). Figure 2 summarizes the allelic status of each chromosomal arm in all samples studied. The fractional allelic imbalance (FAI) was also determined in each case by the fraction of the total number of informative chromosomal arms displaying AI. In this study, FAI ranged from 0.05 to 0.54, with an average of 0.31.
Allelotyping analysis of 30 MGUS/MM cases. FAI indicates fractional allelic imbalance; shaded boxes, allelic imbalance; AI% shaded in dark gray, percentage greater than 1 SD; AI% shaded in light gray, percentage greater than the mean.
Allelotyping analysis of 30 MGUS/MM cases. FAI indicates fractional allelic imbalance; shaded boxes, allelic imbalance; AI% shaded in dark gray, percentage greater than 1 SD; AI% shaded in light gray, percentage greater than the mean.
Minimal deleted regions on chromosome 13q.
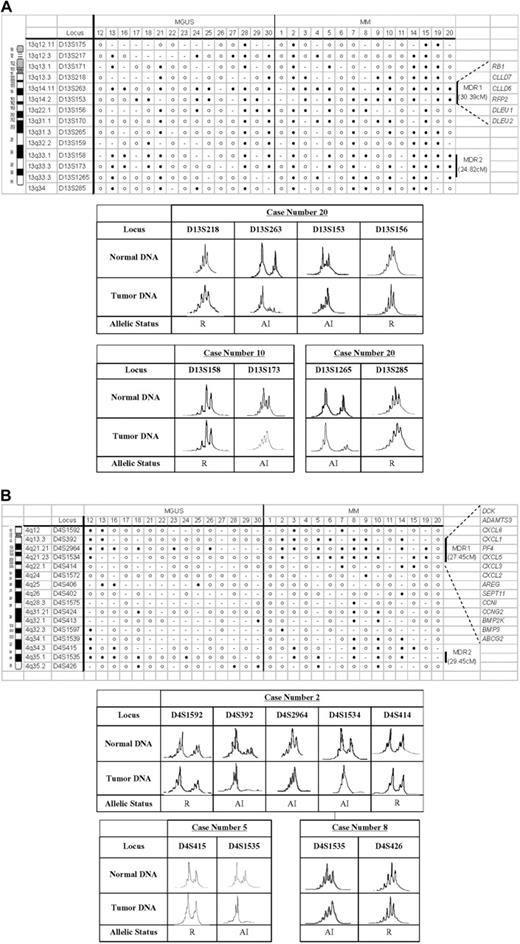
AI of chromosome 13q was observed in 80% (12 of 15) of MM and 73.33% (11 of 15) of MGUS cases. Two MDRs were defined in MM. A 30.39 cM MDR (MDR1) from 13q13.3 to 13q22.1 (D13S218 and D13S156) was defined by cases 7 (upper boundary), 19 (lower boundary), and 20 (upper and lower boundaries). Of the informative cases, 85.71% (12 of 14) of MM and 73.33% (11 of 15) of MGUS showed AI in MDR1. Another MDR (MDR2) of 24.82 cM located on 13q33.1 to 13q34 (D13S158 and D13S285) was defined by cases 10 (upper boundary), 4, and 20 (lower boundary for both). Of the informative cases, AI of MDR2 was identified in 71.43% (10 of 14) of MM and 40% (6 of 15) of MGUS. Figure 3A shows the definition of MDRs on chromosome 13q and representative AI in these MDRs.
Delineation of MDRs. Delineation of MDRs is shown for chromosomes (A) 13q and (B) 4q. The top panels show the microsatellite markers analyzed and their respective chromosomal locations. Vertical lines on the right denote the MDRs defined in each chromosomal region, and candidate genes selected for further mRNA expression analysis are listed beside the MDRs. Filled circles denote allelic imbalance (AI); unfilled circles, retention (R); and dash, noninformative at each specific loci examined. The electropherograms of representative cases for defining the MDRs are shown in the bottom panels.
Delineation of MDRs. Delineation of MDRs is shown for chromosomes (A) 13q and (B) 4q. The top panels show the microsatellite markers analyzed and their respective chromosomal locations. Vertical lines on the right denote the MDRs defined in each chromosomal region, and candidate genes selected for further mRNA expression analysis are listed beside the MDRs. Filled circles denote allelic imbalance (AI); unfilled circles, retention (R); and dash, noninformative at each specific loci examined. The electropherograms of representative cases for defining the MDRs are shown in the bottom panels.
Minimal deleted regions on chromosome 4q.
AI of chromosome 4q was found in 73.33% (11 of 15) of MM and 66.67% (10 of 15) of MGUS cases. Two MDRs were delineated in this region. An MDR of 27.45 cM on 4q12 to 4q22.1 (MDR1) (microsatellite markers D4S1592 and D4S414) was defined by cases 5, 9 (upper boundary), 8, 10, 19 (lower boundary for all), and 2 (upper and lower boundaries). Of the informative cases, 73.33% (11 of 15) of MM and 40% (6 of 15) of MGUS revealed AI in MDR1. Another MDR (MDR2) of 29.45 cM located on 4q34.3 to 4q35.2 (D4S415 and D4S426) was defined by cases 5 (upper boundary) and 8 (lower boundary). Of the informative cases, 62.5% (5 of 8) of MM and 35.71% (5 of 14) of MGUS demonstrated AI in MDR2. Figure 3B shows the definition of MDRs on chromosome 4q and representative AI in these MDRs.
cIg-FISH revealed high incidences of −13q14.2 and −4q13.3 in MGUS and MM.
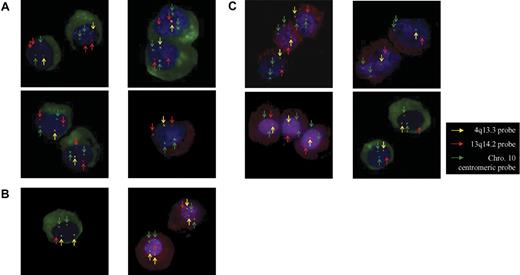
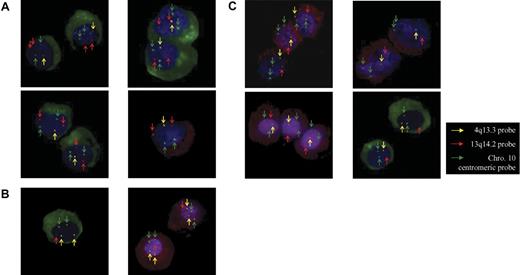
Table 5 summarizes the FISH findings of 13q and 4q on the clonal PCs from the 60 MGUS and MM patients. Frequent deletion of 13q14.2, 68.4% and 80.5%, respectively, and deletion of 4q13.3, 52.6% and 39.0%, respectively, were identified in MGUS and MM. In both cohorts, −13q14.2 only was most frequent whereas concurrent −13q14.2 and −4q13.3 was also common. However, deletion of 4q13.3 only was rare in MM cases. In addition, high and similar percentages of clonal PCs showed −13q14.2, -4q13.3, or concurrent −13q14.2 and −4q13.3 in both MGUS and MM (Figure 4; Table 5). In about 95% of MM cells, concurrent −13q14.2 and −4q13.3 was observed in U-266, LP-1, RPMI-8226, and NCI-H929, whereas −4q13.3 only was found in OPM-2.
Representative examples of 4q13.3 and 13q14.2 aberrations by cIg-FISH. The clonal PCs in all cases are identified by cytoplasmic immunofluorescence staining of κ light chain (green, FITC) or λ light chain (red, PE). The images in the left column are MGUS cases (n = 5) while those in the right column are MM cases (n = 5). Yellow arrows indicate signals by the 4q13.3 region-specific probe (yellow); red arrows, signals by the 13q14.3 region-specific probe (red); and green arrows, signals by the chromosome 10 centromeric reference probe (green). (A) Four representative cases with copy number loss in 4q13.3 (1 yellow) but not 13q14.2 (2 red). (B) Two representative cases with copy number loss in 13q14.2 (1 red) but not 4q13.3 (2 yellow). (C) Four representative cases with copy number losses in both 4q13.3 (1 yellow) and 13q14.2 (1 red). Images were visualized using a Zeiss Axioplan 2 fluorescence microscope equipped with a charge-coupled device camera and a 40×/0.75 numerical aperture oil objective lens. Images were processed using ISIS3 software (MetaSystems).
Representative examples of 4q13.3 and 13q14.2 aberrations by cIg-FISH. The clonal PCs in all cases are identified by cytoplasmic immunofluorescence staining of κ light chain (green, FITC) or λ light chain (red, PE). The images in the left column are MGUS cases (n = 5) while those in the right column are MM cases (n = 5). Yellow arrows indicate signals by the 4q13.3 region-specific probe (yellow); red arrows, signals by the 13q14.3 region-specific probe (red); and green arrows, signals by the chromosome 10 centromeric reference probe (green). (A) Four representative cases with copy number loss in 4q13.3 (1 yellow) but not 13q14.2 (2 red). (B) Two representative cases with copy number loss in 13q14.2 (1 red) but not 4q13.3 (2 yellow). (C) Four representative cases with copy number losses in both 4q13.3 (1 yellow) and 13q14.2 (1 red). Images were visualized using a Zeiss Axioplan 2 fluorescence microscope equipped with a charge-coupled device camera and a 40×/0.75 numerical aperture oil objective lens. Images were processed using ISIS3 software (MetaSystems).
Identification of tumor suppressors on 13q and 4q
Messenger RNA expression studies of target candidate genes in MM.
To identify potential MM-related TSGs, 28 BMPC samples from an additional group of MM patients were further evaluated together with 5 MM cell lines (U-266, LP-1, RPMI-8226, NCI-H929, and OPM-2), 10 normal samples of PBMNCs, and 5 normal samples of BMPCs. We focused on the study of expression of target candidate genes on MDR1s on chromosomes 13q and 4q, because these regions showed AI in most of the informative cases and contained higher numbers of genes, many of which had known functions (Figure 3).
No differential mRNA expression of multiple candidate genes on 13q14 in MM.
Messenger RNA expression levels of candidate genes at 13q13.3-q22.1, including RB1, CLLD7, CLLD6, RFP2, DLEU1, and DLEU2 (Figure 3A), were investigated by semiquantitative RT-PCR. No differential expression was observed between patient MM cells, MM cell lines, and normal PBMNC and BMPC samples (data not shown).
Platelet factor 4 (PF4) on chromosome 4q showed differential reduction or loss of mRNA expression in MM and MM cell lines.
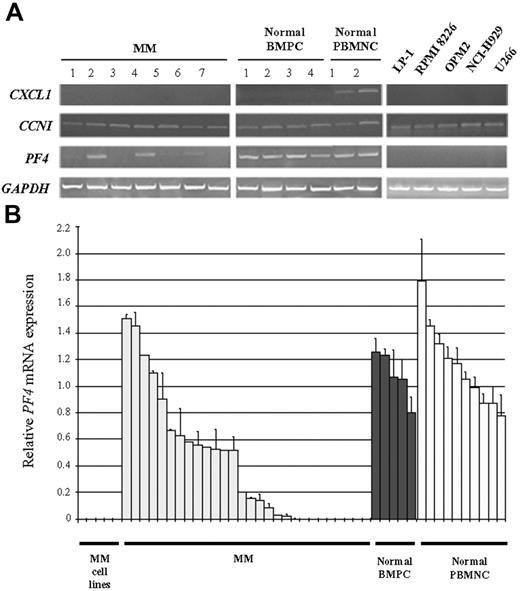
A panel of candidate genes at 4q12-q22.1 (Figure 3B) was further selected for expression studies based on the presence of CpG islands on the promoter sites or available information on their gene functions indicating potential relevance to carcinogenesis. Messenger RNA expression levels of these candidate genes were determined by semiquantitative RT-PCR. No differential expression of CCNG2, BMP3, DCK, ABCG2, ADAMTS3, BMP2K, AREG, CCNI, and SEPT11 was observed between patient MM cells, MM cell lines, and normal BMPCs and PBMNCs. However, mRNA expression of CXCL6, CXCL5, CXCL3, CXCL2, and CXCL1 was detected in normal PBMNCs but not in normal BMPCs, patient MM cells, and MM cell lines. These findings suggest that the down-regulation of these genes is not involved in malignant MM transformation but the normal PC differentiation. Figure 5A shows representative semiquantitative RT-PCR results of CCNI and CXCL1 (data not shown for other genes). By contrast, 15 of 28 (54%) MM patients showed decrease or loss of PF4 expression as compared with normal BMPCs and PBMNCs by semiquantitative RT-PCR (Figure 3A). No detectable expression of PF4 was observed in any of the 5 MM cell lines (Figure 4A). Quantitative RT-PCR of PF4 confirmed an average of 2.667-fold down-regulation in primary MM (P = .008) compared with normal BMPCs, which showed a PF4 expression level similar to PBMNCs (P = .953) (Figure 5B). Taken together, these data indicated that PF4 may be a potential TSG in the tumorigenesis in MM.
Messenger RNA expression of candidate genes of chromosome 4q in primary MM and MM cell lines relative to normal BM plasma cells (BMPCs) and PB mononuclear cells (PBMNCs). (A) Electrophoretic analysis of RT-PCR products shows representative transcript expression of CXCL1, CCNI, and PF4 in MM (cases 1 to 7), normal BMPCs (cases 1 to 4), normal PBMNCs (cases 1 to 2), and MM cell lines (RPMI-8226, LP-1, OPM-2, NCI-H929, and U-266). Nonexpression of CXCL1 is found in normal BMPCs, primary MM, and MM cell lines, and expression of CCNI is observed in all MM and normal samples. Conversely, down-regulation of MM primary samples and negligible expression of PF4 in MM cell lines are observed when compared with expressions in normal BMPCs and PBMNCs. GAPDH expression is displayed for normalization and mRNA quality control. (B) Quantitative RT-PCR shows down-regulation of PF4 in MM and MM cell lines (RPMI-8226, LP-1, OPM-2, NCI-H929, and U-266) relative to normal BMPCs and PBMNCs. The mean and range of fold changes are as follows: MM cell lines, not detected; MM, 0.41, 0 to 1.51; normal BMPCs, 1.08, 0.80 to 1.26; and normal PBMNCs, 1.15, 0.78 to 1.79. Expression level of less than 0.5 (dotted line) is classified as down-regulation. Gene expression is normalized by transcript expression of ACTB. Error bars represent SD.
Messenger RNA expression of candidate genes of chromosome 4q in primary MM and MM cell lines relative to normal BM plasma cells (BMPCs) and PB mononuclear cells (PBMNCs). (A) Electrophoretic analysis of RT-PCR products shows representative transcript expression of CXCL1, CCNI, and PF4 in MM (cases 1 to 7), normal BMPCs (cases 1 to 4), normal PBMNCs (cases 1 to 2), and MM cell lines (RPMI-8226, LP-1, OPM-2, NCI-H929, and U-266). Nonexpression of CXCL1 is found in normal BMPCs, primary MM, and MM cell lines, and expression of CCNI is observed in all MM and normal samples. Conversely, down-regulation of MM primary samples and negligible expression of PF4 in MM cell lines are observed when compared with expressions in normal BMPCs and PBMNCs. GAPDH expression is displayed for normalization and mRNA quality control. (B) Quantitative RT-PCR shows down-regulation of PF4 in MM and MM cell lines (RPMI-8226, LP-1, OPM-2, NCI-H929, and U-266) relative to normal BMPCs and PBMNCs. The mean and range of fold changes are as follows: MM cell lines, not detected; MM, 0.41, 0 to 1.51; normal BMPCs, 1.08, 0.80 to 1.26; and normal PBMNCs, 1.15, 0.78 to 1.79. Expression level of less than 0.5 (dotted line) is classified as down-regulation. Gene expression is normalized by transcript expression of ACTB. Error bars represent SD.
Methylation studies of PF4 in MM
Transcriptional silencing of PF4 was associated with promoter hypermethylation in primary MM and MM cell lines.
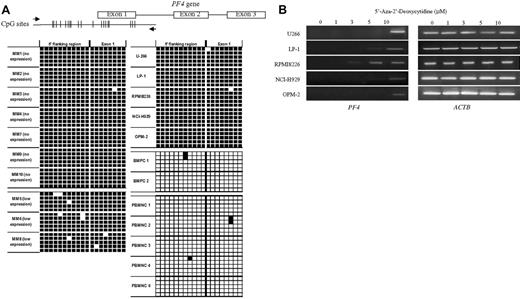
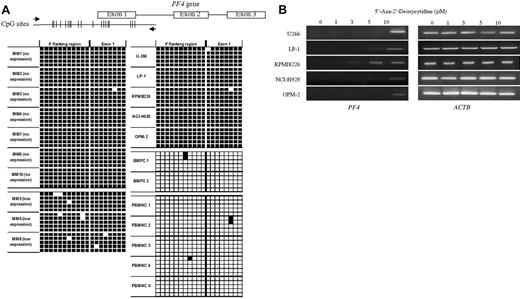
Exploration of the human genome database (UCSC [University of California Santa Cruz] Genome Browser Gateway) revealed that the PF4 gene contains a putative CpG island of 19 CpG sites (251 bp) that spans from the proximal promoter region to exon 1 of the gene. We further tested the 7 normal samples of BMPCs (n = 2) and PBMNCs (n = 5) by bisulfite sequencing and found that the CpG island of PF4 was almost totally unmethylated (Figure 6A). By contrast, we detected dense methylation in the CpG island with almost all CpG sites showing complete methylation (Figure 6A) in the 10 clinical MM samples with undetectable (n = 7) or low (n = 3) levels of PF4 expression. Concordantly, the 5 MM cell lines with no detectable PF4 expression also showed dense CpG island methylation.
Methylation analysis of PF4 gene in primary MM, MM cell lines, and normal cells. (A) Schematic diagram showing the location of CpG sites at the 5′ promoter region and exon 1 of PF4 gene. Black arrows show the primers used for the amplification of the PCR product for bisulfite sequencing. Relative positions of CpG dinucleotides are indicated by vertical lines. The graphic below illustrates the results of bisulfite sequencing, with filled boxes indicating methylation and white boxes unmethylation at each CpG site. Five clones are analyzed for each sample. (B) 5′-Aza-2′-deoxycytidine (5′-Aza) demethylation treatment in MM cell lines. Restoration of PF4 expression in all MM cell lines was observed after treatment with 1, 3, 5 or 10 μM of 5′-Aza for 4 days. ACTB expression was examined for internal control.
Methylation analysis of PF4 gene in primary MM, MM cell lines, and normal cells. (A) Schematic diagram showing the location of CpG sites at the 5′ promoter region and exon 1 of PF4 gene. Black arrows show the primers used for the amplification of the PCR product for bisulfite sequencing. Relative positions of CpG dinucleotides are indicated by vertical lines. The graphic below illustrates the results of bisulfite sequencing, with filled boxes indicating methylation and white boxes unmethylation at each CpG site. Five clones are analyzed for each sample. (B) 5′-Aza-2′-deoxycytidine (5′-Aza) demethylation treatment in MM cell lines. Restoration of PF4 expression in all MM cell lines was observed after treatment with 1, 3, 5 or 10 μM of 5′-Aza for 4 days. ACTB expression was examined for internal control.
Treatment with 5′-Aza-2′-deoxycytidine restored PF4 transcription in the nonexpressing MM cell lines with dense promoter hypermethylation.
PF4 mRNA expression was reactivated in U-266, LP-1, RPMI-8226, NCI-H929, and OPM-2 MM cells after 4 days' treatment by increasing doses (1, 3, 5, 10 μM) of 5′-Aza-2′-deoxycytidine (5′-Aza) (Figure 6B), and PF4 transcript became significantly detectable at 5 to 10 μM 5′-Aza treatment.
Discussion
Our current investigation represents the first systematic CGH study on PC-purified samples from MGUS and low and high stages of MM. The enhanced sensitivity by prior PC purification helps reveal novel aberrations, and the serial changes from MGUS to MM provide novel insights into the involvement of chromosomal imbalances in the multistep tumorigenesis of MM. For the first time, we have identified CNAs in all MGUS and MM patients and found high and similar frequencies of -4q (42.1% to 46.3%) involving a high percentage (70% to 74%) of clonal PC in both patient cohorts. Thus, deletion of 4q is potentially an important genetic event in MM tumorigenesis in addition to −13q, which is widely known.
In our current global genome study on MGUS, in addition to the comparable frequencies of gains of 6p, 9q, and 15q (21% to 26%),3,4 as observed in previous FISH studies, we detected a remarkably higher incidence of −13q (78.9% versus 25% to 50%)3,10,11 and found novel aberrations of +19p (42.1%) and −14q (31.6%) not previously reported in MGUS. More importantly, a high incidence of −4q (42.1%) was first identified by both CGH and FISH. These data confirm that multiple alterations, which may be related to the induction and maintenance of PC clone(s), are already present in the MGUS state, thus further supporting the previous notion that karyotypic instability initiated in MGUS, where specific chromosomal changes may confer a proliferative advantage to PCs for clonal expansion and MGUS-MM transition. In the MM cohort, concordant with previous studies, characteristic numeric abnormalities of MM involving loss of chromosome 6q and 13q and gain of chromosome 1q, 3p, 9q, 11q, 15q, and 19q were also demonstrated. The higher prevalence of 13q loss (80.5% versus 30% to 55%)2,12,13 was remarkable but does again confirm its importance in MM pathogenesis. Like MGUS, we again observed a high incidence of 4q loss (46.3%) in our MM patients; −4q was rarely described in MM. The only study reporting significant frequency of −4q was on plasma cell leukemia (PCL) patients and MM cell lines based on CGH analysis.14 It is possible that this aberration may occur in subpopulations of myeloma cell clones, detectable only after enrichment of PCs or after clonal expansion in advanced diseases like PCL and MM cell lines. Particularly if the aneuploid clone is less than 30% of the studied population, they may escape detection by CGH.
However, given the large fractions of clonal PCs carrying −4q13.3 and −13q14.2 that we observed in our FISH study, the differences between our and previous CGH/FISH studies regarding the frequencies of −13q and −4q are intriguing and could not be adequately explained by the high PC purities of our samples and the differences in disease stages across cohorts.2–4,10–14 This difference is also exemplified by our lower frequency of whole arm loss of 13q (about 40% versus 80% to 90% by previous studies). Thus, the findings on our Chinese cohort may provide first evidence of ethnic-associated biological implications. In fact, we did observe some other differences in the cytogenetic profiles of MM in Chinese by integrated G-banded spectral karyotyping as well.15 Confirmation of this deserves further study. However, no other cytogenetic studies in Chinese populations with MM/MGUS have been reported.
Our FISH data also support the hypothesis that −13q14.2, found in similarly high frequencies and high percentages of all clonal PCs in MGUS and MM, is an early cytogenetic event related to clonal transformation but not MGUS-MM transition in MM tumorigenesis. This observation and interpretation supports the other studies by Fonseca et al12,13 although their frequencies are lower (about 50% in both MGUS and MM). Notably, in MGUS patients with concurrent −13q14.2 and −4q13.3, most (91.4%) clonal PCs carried −13q14.2, but only a fraction (73%) of this −13q14.2 clone also harbored the −4q13.3 (Table 6). These data make us speculate that the event of −4q may come after −13q as a late secondary genetic event during the MGUS stage, and −4q may cooperate with −13q to play a role in maintenance of the malignant PC clone but not in MGUS-MM transition or MM progression as supported by our CGH and FISH data, which showed that the frequencies and percentages of the −13q or −4q or concurrent −13q and −4q were very similar from MGUS to early and advanced MM stages (Table 6).
Multistep pathogenesis driven by changes of genetic alterations is common in cancer development.16,17 From MGUS to MM and further advancement to extramedullary invasion or PCL is a clinically distinct stepwise process in which increasing incidences of abnormal karyotype and Ras and p53 mutations were found with advancing MM stages.1,2 Nevertheless, the genetic mechanisms underlying MGUS to MM transition and MM progression remain unclear. In the current study, we observed evolving cytogenetic profiles of increasing complexity from MGUS to MM and in MM progression, as evident from the significantly increasing median numbers of CNAs found (Table 2). The genomic patterns of established MM are also significantly different from MGUS (P < .001), demonstrating more sole chromosomal gains in the MGUS but more sole chromosomal losses in MM (Table 2).
By comparing the incidences of CNAs of MGUS with MM and of early with advanced MM, we gain further insights into the genetic changes in MGUS-MM transition and MM progression. In particular, +1p, +3p, and −6q may be important genetic events associated with MGUS-MM transition. Likewise, +2p and +9q were implicated as genetic alterations conferring growth advantages for clonal expansion and disease progression. On the other hand, +19p was found more commonly in MGUS than MM, suggesting that it may be negatively selected for MGUS-MM transition. Taken together, our findings support the proposition that it is feasible to use CGH to identify the number of CNAs as well as the number of unique CNAs in MGUS to predict progression (eg, CNA number greater than 8 with +1p, +3p, and −6q) or nonprogression (eg, CNA number less than 4 with +19p) to MM.
By high-resolution genome-wide allelotyping, which provides a more complete profile of chromosomal imbalances than the previous LOH studies investigating only chromosomes 11 and 13,5,18 we observed high prevalence of chromosomal imbalances in 13q, 1p, 4q, 20q, and 5q. AI of chromosome 13q, particularly at 13q14, is common in various types of tumors.19–22 In MM, loss of all or part of chromosome 13 has been most frequent,23,24 and deletion mapping has delineated MDRs at 13q14 and 13q32, respectively.5,6 However, gene transcription and protein expression were not altered in RB1,25 and no mutation of RFP2 was observed.6 In addition to RB1 and RFP2, we found no changes in transcript expression of CLLD7, CLLD6, DLEU1, or DLEU2 in 5 MM cell lines and 28 MM patient samples (data not shown).
More importantly, for the first time in MM, a high frequency of AI (70%) in MGUS and MM was observed on chromosome 4q, where 2 MDRs at 4q12 to 4q22.1 and 4q34.3 to 4q35.2 were delineated in our current study. Although frequent losses of nearby regions were seen in other cancers,26–30 relatively few candidate TSGs were reported on 4q. In this study, we demonstrated frequent differential loss of expression of PF4 in primary MM and MM cell lines as compared with the normal PBMNCs and BMPCs. PF4 is an antiangiogenic ELR-negative chemokine that inhibits angiogenesis in vitro and in vivo31 via suppression of endothelial cell proliferation and migration. When transfected into tumor cells, PF4 functions to inhibit angiogenesis, tumor growth, and metastasis.32,33 Our study first reported allelic loss of chromosome 4q13.3 in MGUS and MM and confirmed frequent loss of PF4 expression in primary MM and MM cell lines, where interphase FISH also revealed −4q13.3. Of interest, recent expression studies by microarray in MM34,35 also reported differential expression of PF4 among other gene candidates. We further demonstrated dense hypermethylation of CpG sites at the 5′ flanking region and exon 1 of PF4 in patient MM cells and MM cell lines showing reduced or loss of PF4 expression but almost no methylation in normal PBMNCs or BMPCs (Figures 5–6). The functional significance of hypermethylation in PF4 was also confirmed by the reactivation of gene expression on treatment with 5′-Aza (Figure 6B). Further investigation in the functional aspects of this gene in MM in vitro and in vivo would provide a better understanding of its tumor suppressor effects in this disease and potentially in other tumors with frequent allelic loss within 4q12-q22.1. Our data have provided a novel gene target for the design of molecular therapy targeting the angiogenesis pathway, which plays an important role in MM tumorigenesis.
Authorship
Contribution: S.H.C. was responsible for performance of experiments, data analysis, and writing of the paper; M.H.L.N., idea generation, research design, and writing of the paper; K.M.L., research design and advice on revision of the paper; A.B.Y.H., performance of experiments and data analysis; K.W.L., critical scientific input in data interpretation; H.S.Y.L., J.C.W.C., R.W.C., W.S.W., and N.P.H.C., patient management, specimen collection, and interpretation of clinical data; H.J. and J.H., data interpretation and discussion; and H.K.N., research design.
Conflict-of-interest disclosure: The authors declare no competing financial interests.
Correspondence: Margaret H. L. Ng, Hematology Section, Department of Anatomical and Cellular Pathology, The Chinese University of Hong Kong, Prince of Wales Hospital, Shatin, N.T., Hong Kong SAR, China; e-mail: margaretng@cuhk.edu.hk.
The publication costs of this article were defrayed in part by page charge payment. Therefore, and solely to indicate this fact, this article is hereby marked “advertisement” in accordance with 18 USC section 1734.
Acknowledgments
This work was supported by a grant from the Research Council of the Hong Kong Special Administrative Region, China (project no. CUHK 4068/02M). We thank the staff from the Hematology Section, Department of Anatomical and Cellular Pathology, Prince of Wales Hospital, for their kind assistance.

