Abstract
To identify previously unknown platelet receptors we compared the transcriptomes of in vitro differentiated megakaryocytes (MKs) and erythroblasts (EBs). RNA was obtained from purified, biologically paired MK and EB cultures and compared using cDNA microarrays. Bioinformatical analysis of MK–up-regulated genes identified 151 transcripts encoding transmembrane domain-containing proteins. Although many of these were known platelet genes, a number of previously unidentified or poorly characterized transcripts were also detected. Many of these transcripts, including G6b, G6f, LRRC32, LAT2, and the G protein–coupled receptor SUCNR1, encode proteins with structural features or functions that suggest they may be involved in the modulation of platelet function. Immunoblotting on platelets confirmed the presence of the encoded proteins, and flow cytometric analysis confirmed the expression of G6b, G6f, and LRRC32 on the surface of platelets. Through comparative analysis of expression in platelets and other blood cells we demonstrated that G6b, G6f, and LRRC32 are restricted to the platelet lineage, whereas LAT2 and SUCNR1 were also detected in other blood cells. The identification of the succinate receptor SUCNR1 in platelets is of particular interest, because physiologically relevant concentrations of succinate were shown to potentiate the effect of low doses of a variety of platelet agonists.
Introduction
Megakaryocytes (MKs) and erythroblasts (EBs) share a common, bipotent progenitor cell when differentiating from hematopoietic progenitor cells (HPCs).1 The close association between the differentiation pathways of the 2 cell types is evidenced by a number of observations. First, there is significant overlap of transcription factor dependency (eg, GATA1,2 GATA2,3 NFE1,4 NFE2,5 and FOG16 ) between the 2 cell types, suggesting the presence of common transcriptional networks and concomitant gene expression. The 2 cell types have also been shown to have a bipotent progenitor (BFU-E/MK) in methylcellulose and single-cell cultures of CD34+ CD38lo hematopoietic stem cells7 and in the bone marrow of normal mice.8 The common origin of MKs and EBs suggests that restriction toward either lineage is a late event in HPC differentiation. Comparative transcriptome analysis of the MK and EB lineages thus gives an insight into the mechanisms of cellular differentiation as well as allowing the identification of novel genes that are expressed following terminal lineage commitment of the MK. The study of the MK transcriptome complements the numerous ongoing gene discovery studies of the platelet transcriptome and proteome9 and, furthermore, may allow the identification of transcripts and proteins that are not readily detectable in platelets using transcriptomic or proteomic approaches.
Here, we report the gene expression profiles of MKs and EBs differentiated in vitro from cord blood–derived HPCs. We compared 5 biologically paired samples (in which the MKs and EBs were differentiated from the same CD34+ HPC harvest) in an experimental design that included extensive technical replication and dye-swaps to minimize false discovery. Statistical analysis of this data identified both well-characterized and novel genes that are differentially expressed between the 2 lineages. The aim of this comparative study was primarily to identify genes encoding novel transmembrane proteins that may act as modulators of platelet function (eg, immunoglobulin superfamily [Ig-SF] members, G protein–coupled receptors [GPCRs], tetraspannins, adaptor molecules, and leucine-rich repeat proteins [LRRs]). Using both purpose-made polyclonal antisera and commercially available antibodies, we confirmed the expression of these novel proteins in platelets. Analysis of transcript and protein expression in mature blood cells shows that some of these proteins are restricted to the MK and platelet lineage. Functional characterization of SUCNR1, a GPCR with succinate as its specific ligand,10 suggests that the expression of SUCNR1 mRNA and protein in MKs and platelets adds a novel and physiologically relevant agonist pathway in platelet activation.
Materials and methods
Umbilical cord blood was collected after informed consent according to the guidelines of Eurocord Nederland. Mononuclear cells were isolated by density gradient centrifugation over Ficoll (1.077 g/cm3; Pharmacia Biotech, Uppsala, Sweden). CD34+ cells were isolated by magnetic cell sorting (91%-98% purity; VarioMACS system; Miltenyi Biotec, Gladbach, Germany) according to the manufacturer's instructions and cryopreserved until required. After thawing, cells were washed in Iscove Modified Dulbecco Medium (BioWhittaker, Berkshire, United Kingdom) with 0.2% (wt/vol) human serum albumin (Sanquin Reagents, Amsterdam, The Netherlands) and cultured in Stemspan expansion medium (StemCell Technologies, Vancouver, Canada). To generate MKs, CD34+ cells (1 × 10⁵/mL) were cultured for 7 days in serum-free medium supplemented with rhTpo (10 ng/mL; Strathmann Biotec AG, Hamburg, Germany) and interleukin-1β (IL-1β; 10 ng/mL; Strathmann Biotec AG). To generate EBs, CD34+ cells (1 × 10³/mL) were cultured for 10 days in the presence of erythropoietin (3 U/mL; R&D Systems, Minneapolis, MN), interleukin-3 (IL-3; 10 ng/mL; Strathmann Biotec), and stem cell factor (100 ng/m; R&D Systems).
Flow cytometry on MKs and antibodies
The following primary antibodies were used for cellular phenotyping: FITC-conjugated monoclonal IgG1 isotype control, anti-CD41, and anti-CD42b (Sanquin Reagents); phycoerythrin (PE)–conjugated IgG1 isotype control (BD Biosciences, San Jose, CA); anti-CD34 (Immunotech, Marseille, France); anti-CD41 and anti-CD235a (DakoCytomation, Cambridgeshire, United Kingdom).
In vitro differentiated MKs were fixed with 1% (wt/vol) paraformaldehyde for 10 minutes. Cells were centrifuged and resuspended in phosphate-buffered saline (PBS) containing 0.2% (wt/vol) bovine serum albumin (BSA) and 5 mM ethylenediaminetetraacetic acid (EDTA). Cells were incubated with primary antibodies for 30 minutes at 4°C, with isotype-matched mouse IgG subtypes as controls. After 30 minutes, the cells were washed with PBS/BSA/EDTA and analyzed on a FACScan or LSRII (Becton Dickinson, San Jose, CA).
Sorting of MKs and EBs
To ensure a high level of purity prior to transcriptome analysis, both MKs and EBs were flow-sorted following culturing. MKs were stained with anti–CD41-FITC, EBs with anti–CD41-PE and anti–CD235-FITC. Both cell types were sorted on a MoFlo cell sorter (DakoCytomation) to obtain highly purified populations of CD41+ MKs and CD235a+/CD41− EBs.
Isolation of RNA and hybridization onto cDNA microarrays
Total RNA was extracted from purified cells using Trizol (Invitrogen, Paisley, United Kingdom), according to the manufacturer's instructions. Extracted RNA was resuspended in RNAse-free, diethylpyrocarbonate-treated water (Ambion, Huntingdon, United Kingdom) and quantified using a NanoDrop spectrophotometer (Nanodrop Technologies, Wilmington, DE). RNA was amplified using an adaptation of the SMART cDNA synthesis kit (BD Clontech, Oxford, United Kingdom), which amplifies RNA by a template switching–polymerase chain reaction (TS-PCR) process.11 Total RNA (100 ng) was mixed with 10 pmol each of SMART CDS 3′ primer IIA (5′-AAGCAGTGGTATCAACGCAGAGTACT30VN-3′) and TS primer (5′-dAAGCAGTGGTATCAACGCAGAGTACGC)r(GGG)-3′). The reaction was denatured at 72°C for 2 minutes and cooled immediately. RNA was reverse transcribed by the addition of 2 μL first-strand buffer (5 ×), 1 μL DTT (20 mM), 1 μL dNTPs (10 mM), and 1 μL PowerScript Reverse Transcriptase, followed by incubation at 42°C for 1 hour. The RT reaction (5 μL) was used as template for global amplification of the cDNA by PCR using Advantage II PCR reagents and the SMART PCR primer (5′-AAGCAGTGGTATCAACGCAGAGT-3′) for 17 cycles of PCR consisting of 95°C for 5 seconds, 65°C for 5 seconds, and 68°C for 6 minutes. Following amplification the product was purified using a PCR clean-up kit (Qiagen, Crawley, United Kingdom). Of the amplified TS-PCR product, 250 ng was labeled by incorporation of Cy3 or Cy5 dCTP using the Bioprime Labelling Kit (Invitrogen), and the labeled products were purified on Autoseq G-50 columns (GE Healthcare, Buckinghamshire, United Kingdom).
Differentially labeled biologically paired MK and EB samples were pooled and hybridized to the Hver 2.1.1 cDNA microarrays (Wellcome Trust Sanger Institute; WTSI). Hybridization and washing of the arrays were performed according to WTSI protocols (http://www.sanger.ac.uk/Projects/Microarrays/). Following hybridization, the slides were promptly scanned at 10-μm resolution on an Agilent Microarray Scanner (G2505B; Agilent Technologies, Stockport, United Kingdom). The images generated were exported into GenePix version 4.1 (Molecular Devices, Sunnyvale, CA) for spotfinding and feature extraction.
In total, 20 cDNA microarrays were hybridized, representing 5 biological replicates each with 4 technical replicates. To control for labeling bias, 2 dye-swaps were performed per pairing.
Statistical analysis of cDNA microarray data
The Limma package12 from Bioconductor (http://www.bioconductor.org) was used to process the expression data. Data were first background corrected and then, in addition to automated and manual flagging of features in GenePix, a further automated quality control step13 was applied to remove poor quality features. A Loess normalization was applied to remove systematic variability, including possible dye bias.14-16
To identify differentially expressed transcripts, we used a linear model similar to those previously developed.12,17 Following the discussion of Repsilber et al18 and Dobbin et al,14 we introduced a new term to take into account the effect of 5 biological replicates in our data and regard it as sample effect. The model is fitted using the lme4 package19 in R (R Development Core Team, http://cran.R-project.org). Differential expression of each feature was assessed by testing the null hypothesis that the corresponding parameter in the model is zero. The P value obtained from this test is then corrected for control of false discovery rate (fdr).20 Differentially expressed genes were identified as those with an average fold difference of 2 or more and an fdr-corrected P value no greater than .05.
Confirmation of transcript expression by quantitative RT-PCR
The differential expression of selected transcripts observed in the microarray experiments was validated by quantitative reverse transcriptase (RT)–PCR. TaqMan mRNA specific assays (Applied Biosystems, Warrington, United Kingdom) were used to measure the relative transcript abundance in MKs and EBs. Transcript levels were also measured in RNA from highly purified populations of platelets, CD4+, CD8+, CD14+, CD16+, and CD19+ peripheral blood cells. Platelets were purified by 3 rounds of centrifugation followed by negative selection with anti-CD45 magnetic beads (Invitrogen) to remove contaminating leucocytes. All other blood cell populations were purified by positive selection from Ficoll-separated peripheral blood mononuclear cells using antibody-conjugated magnetic microbeads (Miltenyi Biotech).
The expression of the following transcripts was examined: leukocyte-specific transcript (LST1, Assay ID HS00394683_m1), tetraspannin NET-7 (TSPAN15, Hs00202548_m1), G6b (Hs00228935_m1), linker for activation of T-cells 2 (LAT2, Hs00247916_m1), succinate receptor 1 (SUCNR1, HS00263701_m1), G6f (Hs00222013_m1), pan-hematopoietic expression (PHEMX, Hs00185077_m1), LRRC32 (Hs00194136_m1), CD61 (ITGB3, Hs00173978_m1), CD41 (ITGA2B, Hs00166246_m1), glycoprotein 6 (GP6, Hs00212574_m1), CD36 (Hs00169627_m1), CD42a (GP9, Hs00236828_m1), CD110 (MPL, Hs00180489_m1), CD235a (Hs00266777_m1), and GAPDH (Hs99999905_m1).
RNA (100 ng) was reverse transcribed using the TaqMan RT kit (Applied Biosystems), from which 0.5 ng cDNA was then used as template for real-time PCR following the manufacturer's instructions (Applied Biosystems). Reactions were incubated at 50°C for 2 minutes then 95°C for 10 minutes, and real-time PCR reactions were performed over 40 cycles (95°C for 15 seconds, 60°C for 1 minute) on an MX-4000 (Stratagene, La Jolla, CA). Threshold values (Ct) were normalized to GAPDH to allow comparison between samples.
G6b splice variants in platelets and MKs
Splice variant–specific primers were designed to identify the predominant isoforms of G6b in platelets and MKs. Briefly, 1 ng platelet or MK cDNA was amplified by 40 cycles of PCR (94°C for 30 seconds, 55°C for 30 seconds, and 72°C for 1 minute). The forward primer ATGGCTGTGTTTCTGCAG was used in all reactions in combination with the following reverse primers: G6b-A/C/G (GACAGAGCAAATCTAGGGA, expected product size 548 bp [base pair], 457 bp, and 548 bp, respectively), G6b-B (AAGTGGAGCAAATCTAGGG, 549-bp product), G6b-D (GACAGAGCATGGGTAGG, 416-bp product), G6-E (GTTTTCACAAGTGGAGCATG, 425-bp product), G6b-F (GACAGAGCTGAAGGATGG, 666-bp product), and G6b-G (CCTTACCGGTTCCTGG, 646-bp product). All primers were obtained from Sigma Genosys (Cambridge, United Kingdom).
Generation of polyclonal antisera against novel platelet proteins
Polyclonal antisera were generated against Escherichia coli–produced recombinant proteins in mice. cDNAs corresponding to the extracellular domains of G6b (NM_025260, corresponding to amino acid residues 18-142), G6f (NM_001003693, amino acid residues 17-234) and LRRC32 (NM_005512, amino acids 29-296) were expressed as N-terminal 6 × His-tagged proteins, which were subsequently refolded and purified from inclusion bodies by Ni-NTA affinity chromatography.
Female Balb/C mice, 6 to 8 weeks old, were immunized to generate polyclonal immune sera. Protein (50 μg/mouse) was formulated with TiterMax Gold (Stratech Scientific, Soham, Cambridgeshire, United Kingdom), and mice were immunized with 200 μL (subcutaneous injection) on days 0 and 14. Subsequent immunizations (50 μg in 200 μL PBS, days 28 and 42) were delivered intraperitoneally. Test bleeds (day 49) were assessed for reactivity and specificity by enzyme-linked immunosorbent assay, fluorescence-activated cell sorting, and Western blot, after which mice were given an intravenous boost of 25 μg protein in 100 μL PBS, followed by killing (+4 days) and terminal bleed. Serum from the terminal bleed was collected and used in assays without further purification.
Glycosidase treatment of platelet lysates
Washed platelets were prepared in 10 mM phosphate buffer, pH 6.5, 0.1% SDS, and 50 mM β-mercaptoethanol. Lysates from approximately 2 × 10⁸ platelets were treated with N-glycosidase F or O-glycosidase as previously described.21 Reactions were then stopped by addition of an equal volume of 2 × Laemmeli buffer containing 10% β-mercaptoethanol and analyzed by sodium dodecyl sulfate–polyacrylamide gel electrophoresis (SDS-PAGE).
Protein detection by Western blot
Mouse monoclonal anti-LAT2 (Clone NAP-07) and rabbit polyclonal anti-SUCNR1 were obtained from Abcam (Cambridge, United Kingdom). The SUCNR1 antibody is a polyclonal rabbit antibody raised against a peptide from the second cytoplasmic loop of the SUCNR1 protein (KYPFREHLLQKKE). Washed platelets (1 × 10⁷/lane) or purified blood cells (0.5 × 10⁶ cells/lane) were lysed in 2 × Laemmeli buffer, and proteins were separated on a 10% Bis-Tris Gel (Invitrogen). Blotting was performed using the Chemiluminescent WesternBreeze kit following the manufacturer's protocol (Invitrogen). Primary antibodies were diluted 1:1000 for LRRC32, G6b, and G6f mouse polyclonals and 1:5000 for the LAT2 mouse monoclonal and SUCNR1 rabbit polyclonal.
Flow cytometry on platelets
Platelets were fixed for 15 minutes at room temperature in 10% formaldehyde (DakoCytomation), washed in PBS/EDTA/BSA, and incubated for 40 minutes with 1 μL antiserum or primary antibody, washed, and detected using the Alexa Fluor-488 signal amplification kit (Invitrogen) according to the manufacturer's instructions. Matched preimmune sera or unlabeled IgG1 were used as a negative control where appropriate. Where the primary antibody was raised against an intracellular antigen (LAT2 and SUCNR1), cells were fixed and permeabilized prior to staining using an Intrastain kit (DakoCytomation) according to the manufacturer's instructions. Samples were analyzed on a Coulter EPICS XL-MCL flow cytometer.
Platelet aggregometry
Whole blood was obtained from blood donors in 3.2% citrate Vacuette tubes (Grenier Bio-one, Gloucester, United Kingdom). Platelet-rich plasma was prepared by centrifugation at 150g for 15 minutes, after which the platelet count was adjusted to 250 × 109/mL using platelet-poor plasma. Platelet aggregation in response to a suboptimal dose of ADP (1 μM; Sigma-Aldrich, Irvine, United Kingdom), thrombin receptor-activating peptide (TRAP-6; Bachem, Torrance, CA) and cross-linked collagen-related peptide (CRP-XL) in the presence of a range of concentrations of succinate in HBS pH 7.4 (50-1000 μM; Sigma-Aldrich) was analyzed using a PAP-4D Aggregometer (Bio-data, Horsham, PA).
Results
Differentiation of CD34+ HPCs
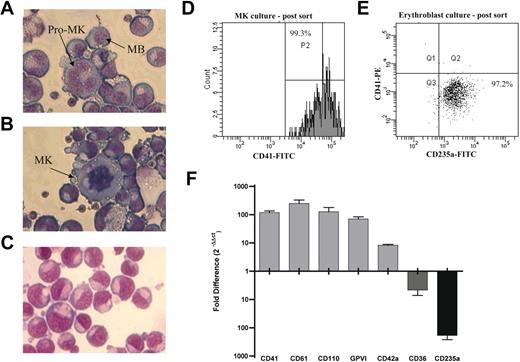
CD34+ cells were isolated from a total of 5 cord blood donations, and paired MK and EB cultures were performed. In the MK cultures 53.1% (range, 31.0%-63.4%) of the cells expressed CD41 (further details of this culture system are summarized in van den Oudenrijn et al22 ). Morphologic analysis of the cells shows that the MKs are predominantly at the megakaryoblast and pro-MK stage of differentiation (Figure 1A), with some larger granular MKs present (Figure 1B). Ploidy and immunohistochemical analysis shows 37.5% of the cells are 4N or higher, and CD42 is expressed on the cell surface (data not shown).23 The EBs are at the pro-erythroblast stage based on the size of the cells (Figure 1C) and glycophorin A (CD235a) expression.24,25 In the EB cultures 66.2% (range, 60.4%-70.2%) of the cells expressed CD235a. The differentiated cells were purified as described (Figure 1D-E), with cell purity prior to RNA isolation being 95.4% ± 2.4% for CD41+ (92.4%-99.3%) and 93.7% ± 7.5 for CD235a+ (80.8%-98.8%). TaqMan real-time PCR was used to confirm differential expression of known lineage-associated transcripts in the purified cell populations following RNA isolation (Figure 1F).
Characterization of MK and EB cultures. (A-B) Megakaryocyte morphology, the MK cultures were predominantly in the megakaryoblast (MB) or promegakaryocyte (pro-MK; horseshoe-shaped nucleus) stage of differentiation, although some large granular MKs (multilobed nucleus) were observed. (C) Erythroblasts (EBs) were in the proerythroblast stage of differentiation. (D) Flow cytometric analysis of MKs and EBs after sorting. After FACS sorting, 99.3% of the cells were positive for CD41. The parallel EB culture (E) was sorted to a purity of 97.2% (based on CD235a expression). (F) Confirmation of differential expression of lineage-associated markers by TaqMan real-time PCR. Data presented as fold difference in expression (corrected for GAPDH) between paired MK and EB cultures. Error bars represent the SEM of biologic (n = 5) and technical (n = 3) replicates combined. Values above the x-axis indicate genes up-regulated in MKs, whereas values below indicate genes up-regulated in EBs. Cells were stained using modified May-Grünwald eosine-methylene blue solution (Merck) and 0.5 mM KH2PO4, pH 7.4. Images were acquired using a Leica DM 1L microscope (Leica, Mannheim, Germany) equipped with a Leica objective C, plan L 40×/0.50 numerical aperture PH2 with a total magnification of 400×. Images were captured using a Leica DC300 digital camera and Leica imaging software (IM500, version 1.20).
Characterization of MK and EB cultures. (A-B) Megakaryocyte morphology, the MK cultures were predominantly in the megakaryoblast (MB) or promegakaryocyte (pro-MK; horseshoe-shaped nucleus) stage of differentiation, although some large granular MKs (multilobed nucleus) were observed. (C) Erythroblasts (EBs) were in the proerythroblast stage of differentiation. (D) Flow cytometric analysis of MKs and EBs after sorting. After FACS sorting, 99.3% of the cells were positive for CD41. The parallel EB culture (E) was sorted to a purity of 97.2% (based on CD235a expression). (F) Confirmation of differential expression of lineage-associated markers by TaqMan real-time PCR. Data presented as fold difference in expression (corrected for GAPDH) between paired MK and EB cultures. Error bars represent the SEM of biologic (n = 5) and technical (n = 3) replicates combined. Values above the x-axis indicate genes up-regulated in MKs, whereas values below indicate genes up-regulated in EBs. Cells were stained using modified May-Grünwald eosine-methylene blue solution (Merck) and 0.5 mM KH2PO4, pH 7.4. Images were acquired using a Leica DM 1L microscope (Leica, Mannheim, Germany) equipped with a Leica objective C, plan L 40×/0.50 numerical aperture PH2 with a total magnification of 400×. Images were captured using a Leica DC300 digital camera and Leica imaging software (IM500, version 1.20).
cDNA microarray analysis
Comparative transcriptome analysis of the MK and EB samples was performed using the Sanger Hver 2.1.1 15K cDNA microarray. This microarray comprises 15 552 features representing approximately 12 000 unique transcripts. We used a biologically paired experimental design, with each MK/EB culture pair being compared directly. A total of 20 hybridizations were performed representing 4 technical replicates per biologic pair. The data were analyzed as described to identify differentially expressed features. In total, 596 features (516 unique annotated transcripts) were up-regulated in MKs relative to EBs (fold change ≥ 2; P < .05), a selection of those encoding transmembrane proteins is shown in Table 1. Another 338 features (298 unique annotated transcripts) were up-regulated in EBs relative to MKs (Table 2). Complete lists of present genes, as well as all differentially expressed genes, are available (Table S1, available on the Blood website; see the Supplemental Materials link at the top of the online article).
Identification of novel MK plasma membrane proteins
The aim of this work was to identify novel or previously uncharacterized components of the MK and platelet plasma membranes. The list of genes up-regulated in MKs relative to EBs was interrogated using the Ensembl Biomart tool26 to identify encoded proteins with transmembrane domains which identified 151 such transcripts (Table S2).
We combined a thorough literature review with bioinformatical analysis of the encoded proteins to identify previously uncharacterized proteins that may have a modulatory role in platelet function. This search was restricted to Ig-SF members, GPCRs, tetraspannins, adaptor molecules, LRR-containing proteins, as well as proteins reported as having a signaling function in other cell types. By this process, we identified G6b, G6f, SUCNR1, TSPAN15, PHEMX, LAT2, and LST1 as candidates for validation. The LRR protein LRRC32 was also included for further investigation, because it was differentially expressed in MKs in preliminary microarray experiments.
Validation and blood cell expression of selected transcripts
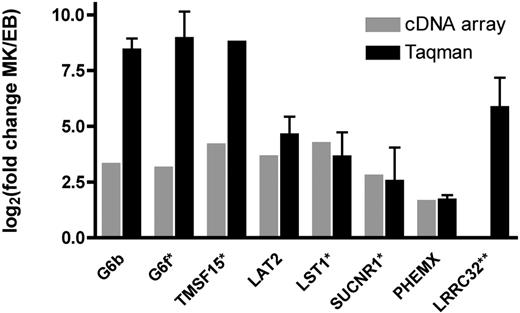
The presence and differential expression of 8 novel transcripts encoding transmembrane proteins was investigated by quantitative RT-PCR. All transcripts tested were detected in the MK samples analyzed, and the direction of the differential expression observed on the microarrays was confirmed by the RT-PCR data. In the case of G6b (359-fold), G6f (514-fold), and TSPAN15 (459-fold) the fold differences observed were higher than those detected on the cDNA arrays (Figure 2).
Confirmation of microarray results using TaqMan real-time PCR. Values for both cDNA array measurements (⊡) and real-time PCR (▪) are plotted as Log2 (fold change). Results are shown as the average for the 5-paired MK/EB comparisons. Although all transcripts were detected by RT-PCR in all 5 of the MK samples, transcripts marked with an asterisk (*) were not detected in all of the EB cultures. Thus, the ratio is based on fewer than 5 comparisons (G6f, n = 2; TMSF15, n = 1; LST1 and SUCNR1, n = 4; all others n = 5). **LRRC32 was identified as differentially expressed in preliminary array experiments and by Taqman real-time PCR. Error bars represent SD of replicates.
Confirmation of microarray results using TaqMan real-time PCR. Values for both cDNA array measurements (⊡) and real-time PCR (▪) are plotted as Log2 (fold change). Results are shown as the average for the 5-paired MK/EB comparisons. Although all transcripts were detected by RT-PCR in all 5 of the MK samples, transcripts marked with an asterisk (*) were not detected in all of the EB cultures. Thus, the ratio is based on fewer than 5 comparisons (G6f, n = 2; TMSF15, n = 1; LST1 and SUCNR1, n = 4; all others n = 5). **LRRC32 was identified as differentially expressed in preliminary array experiments and by Taqman real-time PCR. Error bars represent SD of replicates.
The expression pattern of the selected transcripts in terminally differentiated peripheral blood cells was also determined by quantitative RT-PCR (Table 3). RNA was obtained from purified populations of platelets, B cells (CD19+), T cells (CD4+ and CD8+), monocytes (CD14+), and granulocytes (CD16+). The G6b transcript was detected in MKs and platelets and was substantially more abundant in the former than in CD4+ T cells, monocytes, and B cells (258-fold, 1234-fold, and 77-fold more abundant, respectively) and not detected in CD8+ T cells and granulocytes. The transcript encoding G6f was not detected in any other cells except MKs and platelets, and the transcript encoding SUCNR1 was detected in MKs, platelets, and monocytes (24-fold less abundant than in MKs). LRRC32 mRNA was detected in MKs and to a lesser extent (16-fold less) in B cells. TSPAN15 was also more abundant in MKs than any other cell type tested but showed high levels of expression in CD4+ T cells and is thus not platelet specific. PHEMX, LST1, and LAT2 expression was pleiomorphic, corresponding to their previously confirmed expression in other blood cell types.27-29 Thus, G6b, G6f, LRRC32, and SUCNR1 appear to be the most MK restricted of the transcripts detected.
Confirmation of protein expression in platelets and other blood cells
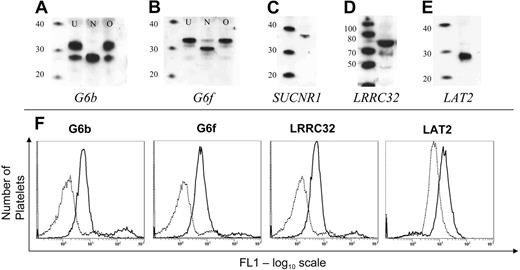
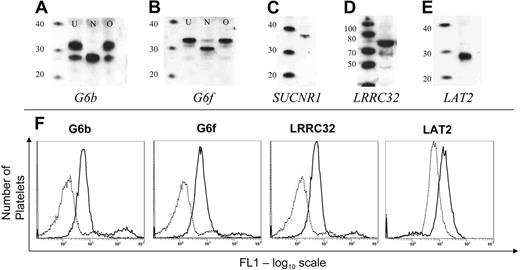
By Western blotting, we were able to demonstrate the presence of all proteins tested in platelets. Two bands were detected for G6b (26 and 32 kDa; Figure 3A, lane U), and N-glycosidase treatment demonstrated that the higher molecular weight band represents an N-glycosylated form of the G6b protein (Figure 3A, lane N). G6f was detected as a 33-kDa protein (Figure 3B, lane U), which when treated with N-glycosidase was detected at 31 kDa (Figure 3B, lane N). Neither G6b nor G6f are O-glycosylated in platelets (Figures 3A-B, lanes marked O). Although the transcripts encoding LRRC32 (72 kDa) and LAT2 (29 kDa) could not be detected in platelets, the corresponding proteins were detected by Western blot (Figure 3C-D). A single band of the correct size was also observed for SUCNR1 (36 kDa; Figure 3E). Furthermore, the expression of G6b, G6f, and LRRC32 on the platelet surface was confirmed by flow cytometry on fixed platelets (Figure 3F). LAT2 was detected in permeabilized platelets (Figure 3F), whereas SUCNR1 could not be detected by flow cytometry because of the unsuitability of the antibody for flow cytometry (data not shown).
Expression of novel transmembrane proteins in platelets. (A-B) G6b and G6f were detected in platelets. N-glycosidase (lanes marked N), but not O-glycosidase (lanes marked O) treatment of a platelet lysate shows that both G6b and G6f are N-glycosylated platelet proteins. The first lane in each blot is a molecular weight marker (MagicMark; Invitrogen; sizes in kDa). (C-E) Detection of SUCNR1, LRRC32, and LAT2 in platelets by Western blot. (F) Flow cytometric detection of novel proteins in platelets. Dotted line shows fluorescence detection of a matched preimmune serum (or in the case of LAT2, murine IgG1), and solid line shows the fluorescence using antisera/antibodies against the cognate antigen.
Expression of novel transmembrane proteins in platelets. (A-B) G6b and G6f were detected in platelets. N-glycosidase (lanes marked N), but not O-glycosidase (lanes marked O) treatment of a platelet lysate shows that both G6b and G6f are N-glycosylated platelet proteins. The first lane in each blot is a molecular weight marker (MagicMark; Invitrogen; sizes in kDa). (C-E) Detection of SUCNR1, LRRC32, and LAT2 in platelets by Western blot. (F) Flow cytometric detection of novel proteins in platelets. Dotted line shows fluorescence detection of a matched preimmune serum (or in the case of LAT2, murine IgG1), and solid line shows the fluorescence using antisera/antibodies against the cognate antigen.
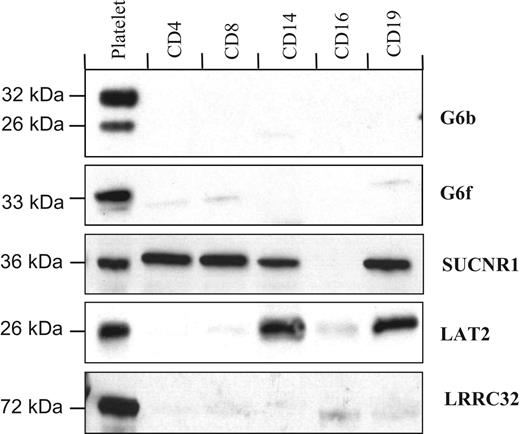
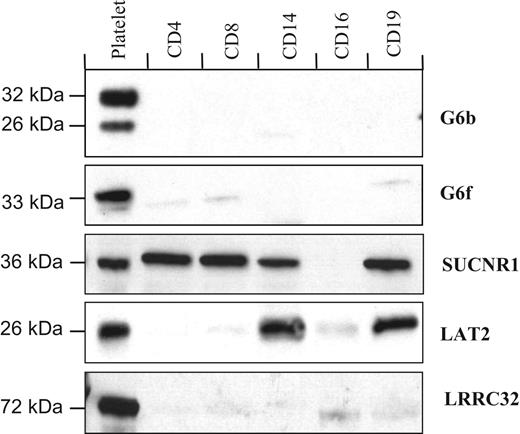
Western blot analysis of the purified populations of blood cells is largely in agreement with the transcript expression data, with G6b, G6f, and LRRC32 proteins undetected in blood cells other than platelets (Figure 4). However, in contrast with the restricted detection of the transcript, the SUCNR1 protein was in T cells, monocytes, and B cells, whereas the LRRC32 protein is restricted to platelets, and LAT2 is expressed in platelets, monocytes, and B cells (Figure 4).
Protein distribution in purified populations of blood cells. G6b, G6f, and LRRC32 are restricted to platelets, whereas LAT2 is also detected in monocytes (CD14+) and B cells (CD19+). The succinate receptor, SUCNR1, was detected in all cells tested except granulocytes.
Protein distribution in purified populations of blood cells. G6b, G6f, and LRRC32 are restricted to platelets, whereas LAT2 is also detected in monocytes (CD14+) and B cells (CD19+). The succinate receptor, SUCNR1, was detected in all cells tested except granulocytes.
Analysis of G6b splice variants present in platelets
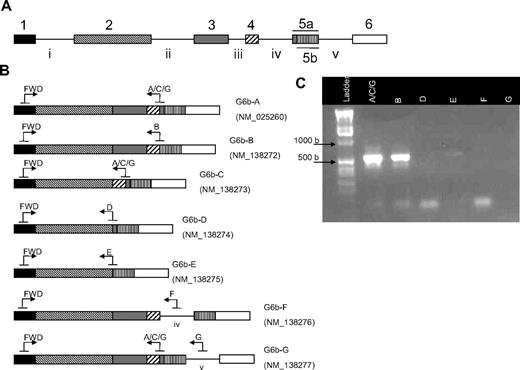
The C6orf25 gene encodes 7 splice variants of the G6b transcript and protein, including transmembrane and secreted isoforms (Figure 5A-B). Splice variant specific PCR primers were used to determine which of these isoforms were most abundant in platelets. Using this approach, we could detect only G6b-A and G6b-B splice variants in platelets (Figure 5C).
Alternative splicing of G6b in platelets. (A) The G6b (c6orf25) gene consists of 6 exons, with the fifth exon containing 2 potential splice acceptor sites (exon 5a or 5b). (B) Seven splice variants of the G6b transcript are annotated in the Entrez Gene database. Transcripts encoding G6b-F and -G contain the intronic sequences IV and V, respectively. Splice variant-specific primer binding sites are represented by arrows. (C) RT-PCR was used to determine which G6b transcripts are expressed in platelets. The reverse primer G6b-A/C/G potentially amplifies G6b-A, -C, and -G (lane 2); however, only G6b-A is detected because the 457-bp band corresponding to G6b-C is not observed nor is any band detected with the G6b-G–specific primer (lane 7). G6b-B (lane 3) is the only other splice variant detected. Expected sizes of PCR products are shown in Table 4.
Alternative splicing of G6b in platelets. (A) The G6b (c6orf25) gene consists of 6 exons, with the fifth exon containing 2 potential splice acceptor sites (exon 5a or 5b). (B) Seven splice variants of the G6b transcript are annotated in the Entrez Gene database. Transcripts encoding G6b-F and -G contain the intronic sequences IV and V, respectively. Splice variant-specific primer binding sites are represented by arrows. (C) RT-PCR was used to determine which G6b transcripts are expressed in platelets. The reverse primer G6b-A/C/G potentially amplifies G6b-A, -C, and -G (lane 2); however, only G6b-A is detected because the 457-bp band corresponding to G6b-C is not observed nor is any band detected with the G6b-G–specific primer (lane 7). G6b-B (lane 3) is the only other splice variant detected. Expected sizes of PCR products are shown in Table 4.
Succinate potentiates the effect of ADP at physiologically relevant concentrations
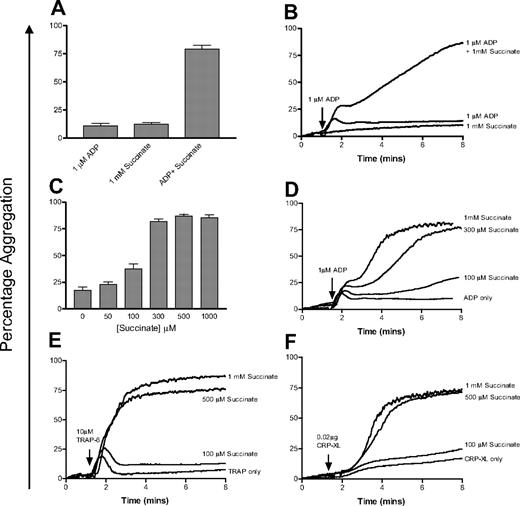
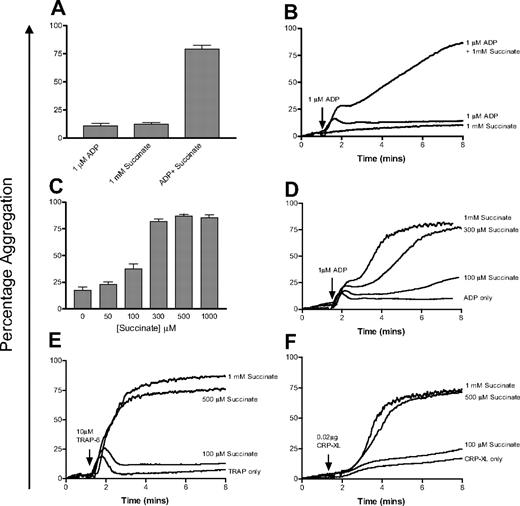
On its own, even high doses of succinate (1 mM) do not cause platelet aggregation. However, in combination with a suboptimal dose of ADP (1 μM) the effect of succinate is profound, with a substantial increase in secondary aggregation (Figure 6A-B). We then investigated the effect of physiologically relevant concentrations of succinate on platelet aggregation. Final aggregation in response to 1 μM ADP averaged 17.3% (± 9.8%) in the 4 donors tested. In the presence of 50 and 100 μM succinate, final aggregation rose slightly to 24.3% (± 9.1%) and 35.8% (± 15.5%), respectively. At higher doses of succinate (0.3-1 mM), final aggregation was higher in all donors tested, averaging 82.2% (± 8.3%) to 86.9% (± 5.1%) aggregation (Figure 6C-D). The presence of succinate has a small effect on primary aggregation in response to ADP, but the main effect is on secondary aggregation (Figure 6D). The same effect was seen when platelets were stimulated with minimally activating doses of CRP-XL or TRAP-6 and succinate (Figure 6E and 6F, respectively).
Succinate potentiates platelet aggregation in response to low doses of agonists. (A) Succinate (1 mM) alone has no effect on platelets, whereas a combination of succinate (1 mM) and ADP (1 μM) significantly increases final aggregation. Error bars are calculated based on duplicate measurements of final aggregation in 4 individuals. (B) A representative aggregometry trace from this experiment. (C) Investigation of the dose response to succinate and ADP. Platelets were costimulated with 1 μM ADP and varying concentrations of succinate (0-1000 μM) and final aggregation was measured. Data are shown as the average of triplicate measurements at each concentration for each of 4 donors; error bars show the SEM of the values obtained. (D) A representative aggregometry trace from this experiment. (E-F) Similar concentrations of succinate also potentiate the effect of low doses of TRAP-6 (10 μM) and CRP-XL (0.02 μg) on platelet aggregation.
Succinate potentiates platelet aggregation in response to low doses of agonists. (A) Succinate (1 mM) alone has no effect on platelets, whereas a combination of succinate (1 mM) and ADP (1 μM) significantly increases final aggregation. Error bars are calculated based on duplicate measurements of final aggregation in 4 individuals. (B) A representative aggregometry trace from this experiment. (C) Investigation of the dose response to succinate and ADP. Platelets were costimulated with 1 μM ADP and varying concentrations of succinate (0-1000 μM) and final aggregation was measured. Data are shown as the average of triplicate measurements at each concentration for each of 4 donors; error bars show the SEM of the values obtained. (D) A representative aggregometry trace from this experiment. (E-F) Similar concentrations of succinate also potentiate the effect of low doses of TRAP-6 (10 μM) and CRP-XL (0.02 μg) on platelet aggregation.
Discussion
Through comparative gene expression profiling of in vitro–differentiated MKs and EBs, we identified subsets of genes that are differentially expressed between the 2 cell types. The initial aim of this work was the identification of novel membrane proteins which modulate platelet function. In total 516 unique genes were up-regulated in MKs when compared with EBs, and 298 genes were up-regulated in the EB. Although the MKs used in this study were differentiated from cord blood–derived CD34+ HPCs, we would expect considerable overlap between the genes expressed in these cells and those expressed in primary bone marrow MKs. The cultured cells are morphologically and phenotypically similar to committed MK progenitors, and a panel of MK- and platelet-specific transcripts are significantly up-regulated in MKs over EBs.
We used publicly available dataset studies to confirm some of our findings. The first published platelet transcriptome study30 identified 2147 transcripts as “present” in the platelet using Affymetrix U95 Av2 microarrays. A total of 157 transcripts (30%) were shared between this list and the MK–up-regulated fraction. The greatest overlap between this and other studies was seen when the data were compared with the study of normal MKs derived from bone marrow CD34+ cells, using Affymetrix U133A microarrays (GEO dataset GSM15648)31 in which approximately 69% (358 transcripts) of the MK–up-regulated transcripts described here were identified as “present.” Less overlap with published platelet proteome studies was observed, because in part of the restricted scale of proteomic studies. Of the 434 proteins described in platelets in the Oxford Glycoproteomics database,32,33 63 were also detected as up-regulated in the MK in these experiments (12% of the up-regulated transcripts). A similar comparison with the more recent study of Martens et al,34 in which 641 platelet proteins were identified, showed that 99 of these platelet proteins were among the MK–up-regulated genes (19% of all up-regulated genes). Taken together, the comparison between this study and those mentioned above shows a 73% overlap (379 of 516 genes) between the MK–up-regulated gene fraction and other published genomic studies of the platelet and MK. The significant overlap between these studies analyzed using considerably different experimental approaches reinforces the validity of in vitro–differentiated MKs as a model for MK transcriptome analysis. A similar comparative analysis of the genes up-regulated in EBs showed that 10% of the encoded proteins were detected in a recent proteomics study of red blood cells.35 An additional comparison with the Hembase Database36,37 which consists of 3 erythroid EST libraries, confirmed that 112 (37.5%) of the 298 EB–up-regulated transcripts had been previously observed in erythroid cells.
Bioinformatical filtering of the MK–up-regulated gene list identified 151 novel transcripts that encode putative transmembrane domain-containing proteins. From this list, genes were selected for further investigation based on 2 criteria. First, the gene must encode a protein that is unknown or poorly characterized in the human platelet. Second, the protein must have structural features or a reported function that suggest a role in platelet function. To this end, we selected 8 transcripts for validation by Taqman real-time PCR. Two Ig-SF proteins (G6b21,38 and G6f39,40 ), 2 tetraspannins (TSPAN1541 and PHEMX27,42,43 ), a single GPCR (SUCNR1),10 an adaptor molecule (LAT2),44,45 an immunomodulatary protein (LST1),29 and the LRR-containing protein LRRC3246,47 were all confirmed to be up-regulated in MKs when compared with EBs. The expression pattern of these transcripts in other blood cells, platelets, T cells (CD4+ and CD8+), B cells, monocytes, and granulocytes, was then examined to determine whether any of these transcripts were uniquely expressed in the MK/platelet lineage. The transcripts encoding G6b, G6f, LRRC32, and SUCNR1 are the most platelet restricted. Using either murine polyclonal antisera generated against E coli–expressed recombinant protein (G6b, G6f, and LRRC32) or commercially available antibodies (LAT2, SUCNR1), we were able to confirm that these proteins are expressed in platelets. Western blot analysis of protein expression in other blood cells confirmed that G6b, G6f, and LRRC32 are platelet specific; we have also confirmed this result by flow cytometry on whole blood (data not shown). Unexpectedly, the SUCNR1 protein appears to be expressed in all cells but granulocytes. The discrepancy between transcript detection and protein detection remains to be clarified, although examination of the GNF gene expression database48 suggests that the SUCNR1 transcript is abundant in CD34+ progenitor cells. The protein may therefore be expressed during hematopoiesis and remain present in terminally differentiated cells, even in the absence of sustained transcription of the gene.
The genes encoding G6b and G6f are located within close proximity to each other (separated by 5.5 kb [kilobase]) in the MHC class III locus on chromosome 6; however, their function is unknown,49 although G6b has been shown to bind heparin with high affinity.38 Both have recently been detected in proteomic studies of the platelet.34,40 Our work corroborates this by confirming expression of the G6b and G6f transcript in MKs and platelets, as well as confirming protein expression on the platelet surface. Our data also suggest the expression of both is restricted to platelets and MKs. Furthermore, we show that G6b is expressed in platelets in both an N-glycosylated and nonglycosylated form, consistent with observations made in G6b-transfected cell lines,21 whereas G6f appears to be present only in its glycosylated form. In addition, we demonstrate that splice variants G6b-A and G6b-B of this gene are expressed in platelets. Both encode transmembrane isoforms of the protein, one of which, G6b-B, contains 2 immunoreceptor tyrosine inhibitory motif (ITIM) domains in its cytoplasmic tail and has been shown to interact with the SH2-containing protein phosphatases SHP-1 and SHP-2 on phosphorylation.21 These features suggest a potential inhibitory role in platelet function, and in agreement with this we have demonstrated that the cross-linking of G6b using polyclonal antiserum inhibits platelet aggregation.66 That 2 splice variants with identical extracellular domains, but different cytoplasmic tails, are expressed on platelets may have functional consequences in modulating the downstream signal on ligand binding.
G6f has been shown to recruit the Src homology 2 domain-containing proteins Grb2 and Grb7 on phosphorylation and activate the Ras-MAP kinase pathway, inducing phosphorylation and activation of ERK (p44/42 MAPK) in K562 cells,39 suggesting it could potentially have an activatory role in platelet or MK signaling. A recent study has indeed shown that the cytoplasmic tail of G6f undergoes phosphorylation and recruits Grb2 in CRP-stimulated platelets.50
The LRR protein LRRC32 and the adaptor molecule LAT2 were also identified in platelets in this study. Transcripts encoding both were expressed in MKs, and, although neither of the transcripts could be detected in platelets, we have demonstrated that the proteins are present. Because platelets cannot synthesize nuclear mRNA, it is not surprising that there is some discrepancy between the detection of transcript and protein in platelets. LRRC32 (GARP, GARPIN) is a 72-kDa protein which consists of 21 extracellular LRRs and a 13-amino acid cytoplasmic tail, the expression of which is restricted to platelets and megakaryocytes. As a structural homologue of GPIbα and GPV, the protein has previously been observed in murine platelets, MKs, and endothelial cells.46,47 No function has yet been identified for LRRC32, but the absence of a long cytoplasmic tail suggests it operates as part of a multiprotein complex. LAT2 (WBSCR5, LAB, or NTAL) has structural and functional similarity to LAT.45,51 LAT2 is expressed in B cells, natural killer cells and mast cells, in which it is coexpressed with LAT.44,52 LAT and LAT2 have been shown to have both synergistic and antagonistic roles in mast cell signaling,28,44 and the same may apply in platelets.
The SUCNR1 gene is located on chromosome 3, in close proximity to P2RY12 and P2RY1 as part of a cluster of 7 genes encoding GPCRs.53 The gene encodes a novel GPCR that has the citric acid cycle intermediate succinate as its ligand. In SUCNR1-transfected cells, succinate induced calcium flux and inhibition of cAMP synthesis, consistent with it being coupled to Gi/G0 and Gq signaling pathways.10
The fact that platelets express a receptor for succinate may be of physiologic significance. More than 2 decades ago, it was shown that succinate could potentiate the effect of several platelet agonists, including ADP, epinephrine, and the endoperoxide analog U46619.54 We have shown that physiologically relevant doses of succinate potentiate the effect of a low dose (1 μM) of ADP on platelet aggregation. In some of the donors we tested, partial potentiation was seen at doses as low as 50 and 100 μM succinate, and in all donors maximal secondary aggregation was observed between 300 and 500 μM. Succinate also had the same effect on suboptimal doses of the GPVI-specific ligand CRP-XL55-57 and the PAR-1 receptor agonist TRAP-6, suggesting that this costimulatory effect is not restricted to ADP. Although further work is under way in our laboratories to clarify the molecular events that mediate this response, Huang et al54 have reported that succinate inhibits cAMP synthesis in platelets, an observation which is consistent with signal transduction through a Gi-coupled GPCR. In SUCNR1-transfected cells, a 5 μM dose of succinate was required to give a half-maximal calcium flux response.10 In the platelet aggregation studies described herein, succinate doses of 100 μM or greater were required to elicit a reproducible secondary response. That succinate alone cannot induce a response, but requires another agonist to initiate aggregation, is also of interest, suggesting it may act as a secondary signal in platelet activation.
The concentration of succinate in normal circulating plasma is between 5.7 and 90 μM,57-62 with succinate levels shown to increase both during exercise (up to 125 μM)60 and in bacterially infected blood cultures (up to 5 mM).63 Succinate is released from papillary muscles into the extracellular space in response to cardiac hypoxia64,65 and can also induce hypertension via a SUCNR1-dependent mechanism.10 The possibility of a connection between elevated succinate levels, enhanced platelet activity, and hypoxia is thus a promising avenue for future research into the role of platelets in the pathologic consequences of atherosclerosis and atherothrombosis.
In conclusion, we have shown that comparative gene expression profiling of MKs and EBs can be used to identify novel transcripts and proteins expressed in their circulating progeny. Furthermore, this experimental approach appears to give a high probability of identifying transcripts and proteins with lineage-restricted expression. A focused approach to the analysis of this microarray data has allowed us to generate and test novel hypotheses about megakaryocyte and platelet biology in health and disease.
Authorship
Contribution: I.C.M. designed and performed research, analyzed data, and wrote the paper; M.R.T. and D.C.T.-T. designed and performed research; A.G. and F.D. designed research and analyzed data; M.S. performed research and provided critical reagents; P.B. performed research; C.F.L. and P.D.E. provided critical reagents; J.-J.Z. designed research; N.A.W. designed research, analyzed data, and wrote the paper; C.E.v.d.S. designed research; and W.H.O. designed research and wrote the paper.
Conflict-of-interest disclosure: The authors declare no competing financial interests.
I.C.M. and M.R.T. contributed equally to this study.
Correspondence: Nicholas A. Watkins, Department of Haematology, University of Cambridge, Cambridge CB2 2PT United Kingdom; e-mail: naw23@cam.ac.uk.
The online version of this article contains a data supplement.
An Inside Blood analysis of this article appears at the front of this issue.
The publication costs of this article were defrayed in part by page charge payment. Therefore, and solely to indicate this fact, this article is hereby marked “advertisement” in accordance with 18 USC section 1734.
We thank Dr Richard Farndale, Department of Biochemistry, University of Cambridge, for the kind gift of CRP-XL. We would also like to acknowledge I. W. de Jong for technical assistance, F. P. J. Mul for cell sorting, and Dr Paul Lyons for assistance in purifying the peripheral blood cell populations.
This work was supported by the European Union 6th Framework Programme (LSHM-CT-2004-503485).

