The mechanisms underlying deregulation of HOX gene expression in AML are poorly understood. The ParaHox gene CDX2 was shown to act as positive upstream regulator of several HOX genes. In this study, constitutive expression of Cdx2 caused perturbation of leukemogenic Hox genes such as Hoxa10 and Hoxb8 in murine hematopoietic progenitors. Deletion of the N-terminal domain of Cdx2 abrogated its ability to perturb Hox gene expression and to cause acute myeloid leukemia (AML) in mice. In contrast inactivation of the putative Pbx interacting site of Cdx2 did not change the leukemogenic potential of the gene. In an analysis of 115 patients with AML, expression levels of CDX2 were closely correlated with deregulated HOX gene expression. Patients with normal karyotype showed a 14-fold higher expression of CDX2 and deregulated HOX gene expression compared with patients with chromosomal translocations such as t(8:21) or t(15;17). All patients with AML with normal karyotype tested were negative for CDX1 and CDX4 expression. These data link the leukemogenic potential of Cdx2 to its ability to dysregulate Hox genes. They furthermore correlate the level of CDX2 expression with HOX gene expression in human AML and support a potential role of CDX2 in the development of human AML with aberrant Hox gene expression.
Introduction
In recent years, substantial progress has been made in understanding the biology of acute myeloid leukemia (AML). One of the pathogenetic hallmarks of AML are chromosomal translocations generating leukemogenic fusion genes that often act as aberrant transcription factors.1 The second key genetic characteristics in AML are mutations, particularly those found in patients with normal karyotype and affecting the receptor tyrosine kinase FLT3 or the nucleophosmin protein (NPM1). Beside these structural genetic changes, large-scale gene expression analyses of cDNA samples from patients with AML have demonstrated that deregulated expression of nonaltered genes characterizes many AML cases. The most prominent example for this is the deregulated expression of homeobox genes in AML.2,–4 Homeobox genes form a highly conserved family of transcription factors known to be key regulators of normal hematopoietic stem cell and progenitor development.5 Several studies have demonstrated that aberrant HOX gene expression profoundly perturbs normal murine and human hematopoietic development and causes leukemia in mice.5,,,–9 The aberrant expression of homeobox genes such as HOXA9 and HOXA10 is strongly associated with certain AML subtypes characterized by MLL fusion genes, NPM1 mutations (NPMc+), and by more rare translocations such as the translocation t(10;11)(p13q14) generating the CALM-AF10 fusion gene.4,10,,–13 All together, deregulated homeobox gene expression characterizes more than every third case of AML. So far, it is largely unknown how the aberrant expression of homeobox genes is initiated in the malignant clone. In cases with 11q23 chromosomal translocations, it is thought that aberrant function of the MLL gene, a known positive upstream regulator of HOX gene expression, is responsible for the perturbed expression of these key regulatory genes of early hematopoietic development.14 In contrast, the aberrant HOX gene expression in patients with AML with normal karyotype and NPM1 mutation is not well understood.15 In particular, the patients with NPMc+ AML demonstrate that aberrant HOX gene expression cannot be just explained by the stage of differentiation at which the leukemic clone is arrested: NPMc+ patients are CD34− in more than 95% of patients, and represent therefore a cell stage in which HOX genes are normally silenced.8,16
Another gene family critically involved in Hox gene regulation is the family of the so-called ParaHox genes, comprising the different “caudal-related homeobox genes” such as CDX1, CDX2, and CDX4, and the GSH2 homeobox gene.17 Several experimental systems have demonstrated that loss of Cdx2 causes homeotic alterations and posterior shifts in Hox expression domains,18 and that consensus-binding sites for the 3 Cdx homologs are present in the promoters of multiple Hox genes.19,,–22 Expression of Cdx2 is tightly restricted to intestinal development in the adult.23 Aberrant expression of CDX2 is associated with intestinal metaplasia,24,25 Barrett epithelium,26 and gastric carcinoma.27 It was previously demonstrated in a single patient with AML carrying the translocation t(12;13)(p13;q12) that this translocation can induce ectopic expression of CDX2 in adult hematopoietic cells beside the expression of the ETV6-CDX2 fusion gene generated by the translocation.28 We have previously shown in a murine leukemia model that the ectopic expression of the Cdx2 and not the ETV6-CDX2 fusion gene is the key transforming event in this type of leukemia.29
We now demonstrate that the ParaHox gene Cdx2 dysregulates expression of leukemogenic Hox genes such as Hoxa10 or Hoxb8 in murine hematopoietic progenitors. Furthermore, we show that loss of the ability of Cdx2 to perturb Hox gene expression by deletion of its N-terminal transactivation domain is paralleled by the inability of the gene to induce AML in vivo. We extended our analyses to human patients with AML and demonstrate that high expression levels of CDX2 were closely associated with HOX gene dysregulation in human AML.
Methods
Patient samples
Mononuclear cells prepared from diagnostic bone marrow or peripheral blood (PB) samples from 115 adult patients with AML were analyzed. The AML cases were classified according to the French-American-British criteria and the World Health Organization classification.30 The study was approved by the ethics committees of all participating institutions, and informed consent was obtained from all patients before they entered the study in accordance with the Declaration of Helsinki (http://www.wma.net/e/policy/b3.htm). As a control, bone marrow mononuclear cells (BMMCs; CellSystem, St Katharinen, Germany) from healthy individuals were analyzed. Cytomorphology, cytochemistry, cytogenetics, and molecular genetics were applied in all cases as described.
Cytogenetics, FISH analysis, and molecular analysis
Cytogenetic analyses were performed using standard techniques. For fluorescence in situ hybridization (FISH), commercially available AML1-ETO, PML-RARa, MLL-AF4, MLL-AF9, MLL-AF10, MLL-AF6, CBFβ-MYH11, or BCR-ABL probes were used according to the manufacturer's instructions (Vysis, Bergisch-Gladbach, Germany).31,32
Microarray
Affymetrix HGU-133 A and B microarrays (Santa Clara, CA) were used to compare the expression of HOX genes in clinical specimens from patients with various subtypes of AML and in normal human bone marrow samples. The expression of 22 genes from the HOX gene cluster, represented by 29 different probesets on the microarrays, were analyzed. RNA extraction, cDNA preparation, in vitro transcription, hybridization, and microarray scanning were performed according to standard protocols as recommended by Affymetrix and as published previously.33 Data analysis was performed using the R 2.4.0 software package (www.R-project.org) and routines from the biostatistics software repository “Bioconductor.”34 Raw microarray data were normalized using the variance stabilizing normalization (vsn) procedure,35 and probe-set expression values were calculated by the median polish method. For the comparison between normal bone marrow and AML specimens with normal karyotype and unmutated nucleophosmin gene, empirical P values and the local false discovery rate for each gene were calculated using the successive exclusion procedure implemented in the Twilight software package.36 To visualize the differences in HOX gene ex-pression, a heatmap showing the expression of the 22 selected genes (29 pro-besets) in 75 clinical samples was constructed. Unsupervised hierarchic clustering using Euclidean distances was performed to group patient samples according to the similarity of their HOX gene expression profiles.
Quantitative PCR and LM-PCR
Expression of CDX1, CDX2, and CDX4 was assayed by the TaqMan real-time quantitative polymerase chain reaction (RQ-PCR) method in total human bone marrow (BM), cord blood cells and mouse BM subpopulations. CDX1, CDX2, and CDX4 primer and probes were used from Applied Biosystems (Foster City, CA; assay IDs: CDX1, Hs00156451 m1; CDX2, Hs01078080 m1; and CDX4, Hs01085517 m1). Quantification of CDX2 expression was performed by RQ-PCR with Applied Biosystems primers. For normalization, the TATA binding protein (TBP) gene was used. Reactions were run in triplicates with 2.5 μL of cDNA in a total reaction volume of 20 μL by using an ABI PRISM 7900 Sequence Detection System (Applied Biosystems).
For quantification of Hox gene expression in vitro, 5-FU murine BM progenitors were transduced with MSCV-Cdx2-IRES-EYFP, MSCV-ΔN-Cdx2-IRES-EGFP, or MSCV-IRES-EGFP. After transduction, EGFP+ or EYFP+ cells were cultured in Dulbecco modified Eagle medium (DMEM) supplemented with 15% fetal bovine serum (FBS), IL-3, IL-6, and stem cell factor (SCF) for 24 hours. Expression levels of HOX genes were determined by the RQ-PCR method as described (Applied Biosystems), and fold expression was determined by the rρCT method. For the linker-mediated PCR (LM-PCR), integrated long-terminal repeats (LTRs) and flanking genomic sequences were amplified and then isolated using a modification of the bubble LM-PCR strategy as previously described.13,37
cDNA constructs and retroviral vectors
The cDNA of Cdx2 was kindly provided by D. G. Gilliland (Division of Hematology/Oncology, Harvard Medical School, Boston, MA) and N. Cross (Department of Hematology, Hammersmith Hospital, London, United Kingdom). Cloning strategies and retroviral vectors were used as described before.29
Flow cytometry and histology
Immunophenotypic analysis of murine single-cell suspensions was performed as previously described.13 Antibodies used for fluorescence-activated cell sorting (FACS) were labeled with phycoerythrin for Gr1, CD11b (Mac1), Sca-1, Ter119, CD4, CD19, and allophycocyanin-conjugated CD11b (Mac-1), CD117 (c-kit), B220, and CD8 (BD Pharmingen, Heidelberg, Germany). For histologic analyses, sections of selected organs were prepared and stained at the Academic Pathology Laboratory (GSF, Munich, Germany) using standard protocols as previously described.29 Photographs from cytospins and colony formation were taken with an Axiovert 135 microscope (Zeiss, Goettingen, Germany), Plan-Neofluar 5×/0.15 NA, equipped with a CoolSNAP camera (Photometrics, Tucson, AZ). Openlab software (Improvision, Coventry, United Kingdom) was used for image processing. Histologic section images were acquired using a Hitachi camera HW/C20 (Hitachi, Tokyo, Japan) installed in a Zeiss Axioplan microscope (Zeiss, Jena, Germany) using Intellicam software (Matrox Electronic Systems, Middlesex, United Kingdom). Plan-Neofluar 10×/0.30 NA, 20×/0.50 NA, and 40×/0.75 NA objectives as well as a Plan Apochromat 63×/1.40 oil objective were used. Images were processed using Adobe Photoshop (Adobe Systems, San Jose, CA).
In vitro assays
GP+ E86 cells, NIH 3T3 cells, and 293T cells were grown in DMEM medium with 10% FBS and 1% penicillin/streptomycin (pen/strep) in a humidified incubator at 37°C and 5% CO2 (complete medium). Primary murine BM cells were plated in complete medium consisting of DMEM supplemented with 15% FBS, 1% pen/strep, 6 ng/mL IL-3, 10 ng/mL IL-6, and 100 ng/mL SCF (Tebu-bio, Offenbach, Germany). IL-3–dependent cell populations from leukemic Cdx2 mice were cultured in vitro in RPMI 20% FBS supplemented with IL-3 (10 ng/mL). Differentiation of clonogenic progenitors was analyzed by plating cells in methylcellulose supplemented with cytokines (primary colony-forming cell [CFC] assays, 500 input cells per dish; Methocult M3434; StemCell Technologies, Vancouver, BC). Serial CFC assays were performed by replating appropriate aliquots of cells obtained by harvesting all of the cells present in the previous CFC assay.
Mice and retroviral infection of primary BM cells
Primary mouse BM cells were transduced as previously described.29 For transduction of Cdx2, W167A-Cdx2 and ΔN-Cdx2 cells were cocultured in complete medium with irradiated (40 Gy from a 137Cs γ-radiation) Cdx2, W167A-Cdx2, and ΔN-Cdx2 producer cells. All transductions were performed with the addition of 5 μg/mL protamine sulfate.
BM transplantation and assessment of mice
Following transduction, cells were cultured in complete medium for 48 hours. After this, lethally irradiated (0.80 Gy) mice were given transplants of highly purified EYFP+/EYFP+ cells alone (2.5-3 × 10⁵ cells per mouse transduced with Cdx2 and W167A-Cdx2, 4-5 × 10⁵ cells per mouse transduced with ΔN-Cdx2) without helper cells (FACSVantage; Becton Dickinson, San Jose, CA). Lethally irradiated secondary recipients (0.80 Gy) were injected with 106 BM cells from a primary diseased mouse with an equal number of nontransduced BM cells from a syngenic normal animal.
Statistical analysis
Data were evaluated using the t test for dependent or independent samples (SPSS, Chicago, IL). Differences with P values less than .05 were considered statistically significant.
Results
Cdx2-induced up-regulation of Hox gene expression depends on its N-terminal transactivation domain
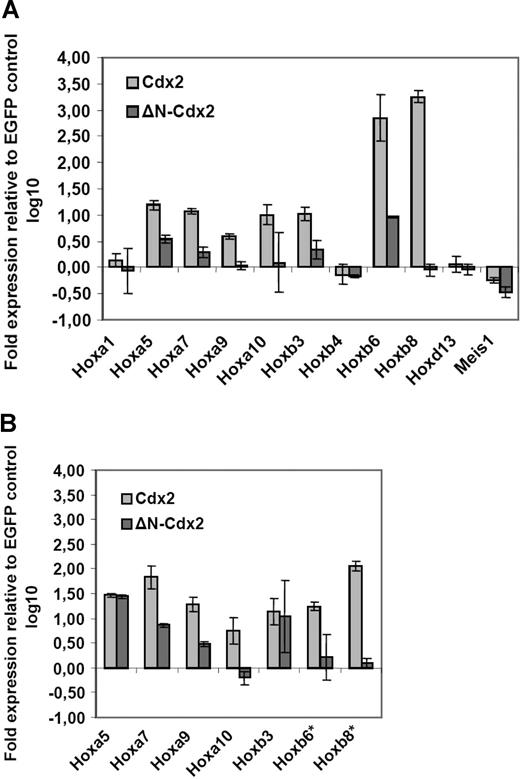
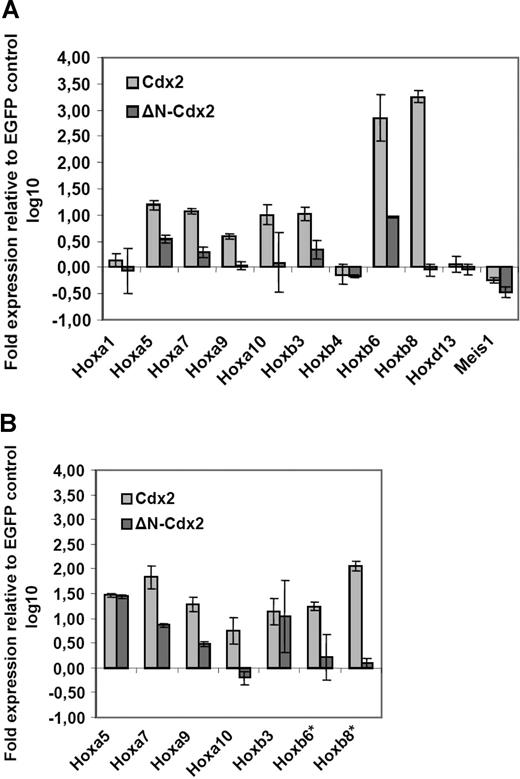
As Cdx2 was shown to function as a positive HOX gene upstream regulator, it was analyzed whether ectopic expression of Cdx2 induced up-regulation of Hox genes in murine hematopoietic progenitor cells. For this, Hox gene expression in murine progenitor cells isolated from 5-fluorouracil (5-FU)–treated bone marrow was determined by quantitative PCR (qPCR) 24 hours after successful retroviral transduction of the cells with the MSCV-Cdx2-IRES-EYFP or the MSCV-IRES-EGFP (control) constructs. Before the qPCR analysis, cells were highly purified by expression of EYFP or EGFP. Ectopic Cdx2 expression induced significant up-regulation of Hox genes with leukemogenic potential such as Hoxb3, Hoxb6, and Hoxb8 or Hoxb9, Hoxa10, Hoxb5, and Hoxa7. In contrast, Hoxb4 or Hoxd13 did not show any major changes in their expression levels (Figure 1A). Thus, these results indicated that ectopic CDX2 is able to up-regulate expression of leukemogenic Hox genes in adult hematopoietic progenitors after a short time interval. Furthermore, we also analyzed whether ectopic Cdx2 expression would alter Hox gene expression in the progeny of clonogenic progenitors performing CFC assays in vitro: in comparison with the EGFP control, primary colonies derived from Cdx2-transduced progenitors showed substantial up-regulation of leukemogenic Hox genes such as Hoxa7, Hoxa9, Hoxa10, Hoxb6, and Hoxb8 (Figure 1B).
Aberrant expression of Cdx2 up-regulates Hox gene expression in murine bone marrow progenitors. (A) Fold expression levels of Hox genes in murine BM progenitors induced by ectopic expression of Cdx2 or the ΔN-Cdx2 mutant (ΔN) referred to the expression level in BM progenitors transduced with the EGFP control vector 48 hours after the end of transduction. (B) Fold expression levels of Hox genes in primary colonies expressing Cdx2, ΔN-Cdx2, or the empty control vector (EGFP). The fold expression was calculated by the rρCT method based on the expression level of the Hox genes in cells transduced with the EGFP control. *Expression of Hoxb6 and Hoxb8 were not detectable in EGFP control cells. Error bars indicate the standard deviations (SD).
Aberrant expression of Cdx2 up-regulates Hox gene expression in murine bone marrow progenitors. (A) Fold expression levels of Hox genes in murine BM progenitors induced by ectopic expression of Cdx2 or the ΔN-Cdx2 mutant (ΔN) referred to the expression level in BM progenitors transduced with the EGFP control vector 48 hours after the end of transduction. (B) Fold expression levels of Hox genes in primary colonies expressing Cdx2, ΔN-Cdx2, or the empty control vector (EGFP). The fold expression was calculated by the rρCT method based on the expression level of the Hox genes in cells transduced with the EGFP control. *Expression of Hoxb6 and Hoxb8 were not detectable in EGFP control cells. Error bars indicate the standard deviations (SD).
It was then tested whether deletion of this domain would affect the ability of Cdx2 to deregulate Hox gene expression. Retroviral expression of the ΔN-Cdx2 mutant lacking the N-terminal transactivation domain (1 amino acid [aa]–179 aa) did not induce up-regulation of Hoxb8, Hoxa9, and Hoxa10 in contrast to nonmutated Cdx2. Furthermore, deletion of the N-terminal domain clearly limited the ability of Cdx2 to up-regulate expression of Hox genes such as Hoxa7, Hoxa9, and Hoxb3, whereas the expression of the nonleukemogenic Hox genes Hoxb4 and Hoxd13 were not changed by both Cdx2 constructs compared with the control (Figure 1A,B).
The transforming potential of Cdx2 is associated with its ability to perturb Hox gene expression
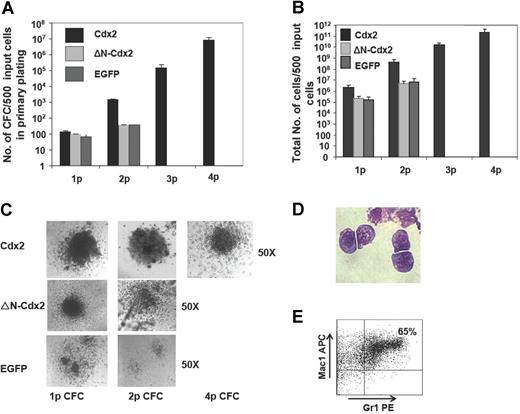
To analyze whether the transforming potential of Cdx2 would correlate with its ability to perturb Hox gene expression in normal hematopoietic progenitor cells, serial replating and in vivo transplantation assays were performed with murine BM progenitor cells expressing Cdx2, ΔN-Cdx2, or EGFP alone. Cells were highly purified based on EGFP or EYFP expression before plating into methylcellulose. In the first CFC assay, expression of Cdx2 resulted in a significantly higher number of colonies compared with EGFP (138 ± 18 vs 65 ± 11 per 500 initially plated cells, respectively; n = 8; P < .02) and a significantly higher yield of cells generated per 500 initially plated cells (2.2 × 10⁶ ± 4.4 × 10⁵ vs 1.6 × 10⁵ ± 5.2 × 10⁴; n = 5; P < .01; Figure 2A,B). Furthermore and in contrast to the control, colonies expressing Cdx2 were serially replatable (at second CFC assay 14 000 ± 2403 vs 374 ± 14 EGFP; n = 8; P < .002) with a significant higher yield of cells compared with the control (4.5 × 10⁸ ± 1.8 × 10⁸ vs 7.4 × 10⁶ ± 4.0 × 10⁶ EGFP; n = 8; P < .001; Figure 2A,B). After 3 rounds of replating, on average 60% (± 10%) of the Cdx2-expressing colonies were classified as CFU blasts (Figure 2C). This was confirmed by cytospin preparations of colonies demonstrating a primitive myelomonoblastic morphology of the clonogenic cells (Figure 2D). Immunophenotypic characterization of cells at that time point documented coexpression of the myeloid markers Gr1 and Mac1 in 70% (± 10%) of the cells (n = 3) and positivity for Sca-1 in 50% (± 7%) of the cells, respectively, confirming the primitive phenotype of the colonies (Figure 2E). Cells isolated from tertiary CFC assays showed unlimited growth in liquid culture supplemented with IL-3. In order to test the leukemic potential of cells isolated from tertiary CFC assays, lethally irradiated mice received transplants of 1 × 10⁶ (n = 4): all the mice developed AML after a median latency time of 8 weeks (data not shown). Thus, ectopic Cdx2 expression conferred leukemogenic properties to hematopoietic progenitors after serial replating in vitro.
Cdx2 confers self-renewal properties to murine 5-FU BM progenitors. (A) Serial replating capacity of BM progenitors constitutively expressing Cdx2, ΔN-Cdx2, or the empty control vector (EGFP). (B) Yield of cells generated in the serial replating assays of BM progenitors constitutively expressing Cdx2, ΔN-Cdx2, or the empty control vector (EGFP). (C) Morphology of colonies obtained from Cdx2-, ΔN-Cdx2–, and EGFP-expressing BM cells in replating assays. (D) Blast morphology of cells after the fourth replating (May-Grunwald-Giemsa–stained cytospin preparations). (E) Coexpression of the myeloid markers Gr1 and Mac1 on Cdx2+ cells obtained from the fourth round of replating. p indicates plating. Error bars indicate SD.
Cdx2 confers self-renewal properties to murine 5-FU BM progenitors. (A) Serial replating capacity of BM progenitors constitutively expressing Cdx2, ΔN-Cdx2, or the empty control vector (EGFP). (B) Yield of cells generated in the serial replating assays of BM progenitors constitutively expressing Cdx2, ΔN-Cdx2, or the empty control vector (EGFP). (C) Morphology of colonies obtained from Cdx2-, ΔN-Cdx2–, and EGFP-expressing BM cells in replating assays. (D) Blast morphology of cells after the fourth replating (May-Grunwald-Giemsa–stained cytospin preparations). (E) Coexpression of the myeloid markers Gr1 and Mac1 on Cdx2+ cells obtained from the fourth round of replating. p indicates plating. Error bars indicate SD.
Although in the primary CFC assay expression of ΔN-Cdx2 in hematopoietic progenitor cells increased the colony number and the yield of cells compared with the EGFP control (97 ± 4 vs 65 ± 11 EGFP per 500 initially plated cells, respectively; n = 5; P < .03), N-terminal deletion resulted in a significant loss of hematopoietic activity compared with Cdx2 (97 ± 4 vs 138 ± 18; n = 8; P < .01; Figure 2A). In addition, hematopoietic progenitors expressing the N-terminal deleted mutant did not achieve any serial replating capacity after the first round of replating or leukemogenic potential after propagation in methylcellulose as observed for ectopic Cdx2 expression (Figure 2B). Taken together, these data indicated that loss of the transforming activity of Cdx2 in vitro was paralleled by its loss to up-regulate expression of leukemogenic Hox genes.
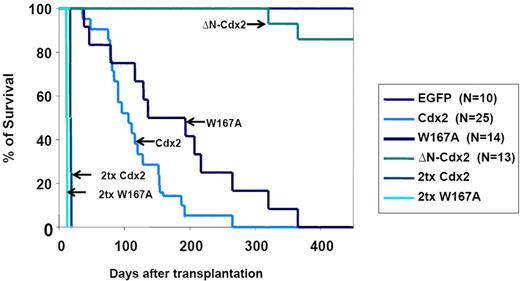
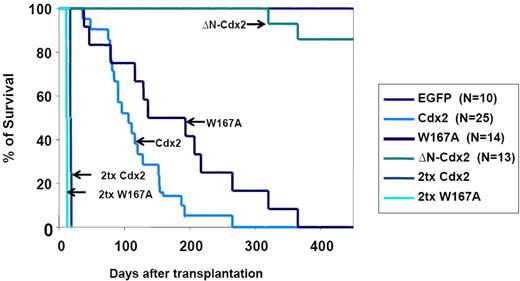
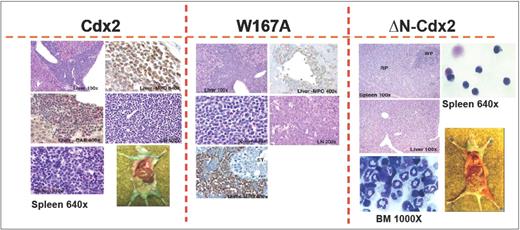
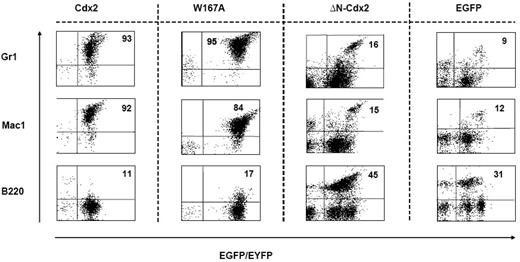
To confirm the crucial role of the N-terminal transactivation domain for AML development in vivo, murine hematopoietic progenitors constitutively expressing Cdx2 or ΔN-Cdx2 were highly purified by EYFP+ or EGFP+ expression, respectively, and injected into lethally irradiated recipient mice directly after sorting (2.5-3 × 10⁵ cells per mouse transduced with Cdx2 and W167A-Cdx2, 4-5 × 10⁵ cells per mouse transduced with ΔN-Cdx2). Mice that received transplants of BM cells expressing Cdx2 became moribund after a median of 116 days (n = 25) after transplantation (Figure 3). Furthermore, inactivation of the putative Pbx-interacting site of Cdx2 (W167A-Cdx2 mutant) did not change the phenotype or the time until disease development significantly (median latency time, 172 days; n = 14; Figure 3). All the mice showed elevated peripheral white blood cell count, suffered from splenomegaly, and were anemic. More detailed hematologic analyses demonstrated that the animals had developed AML with a high percentage of blasts in BM, spleen and PB (Table 1). Histologic sections demonstrated infiltration of myeloid blasts in multiple nonhematopoietic organs, including the testis. Immunohistochemistry showed positivity of the blasts for myeloperoxidase and chloracetate esterase (Figure 4) and negativity for B220 and CD3 (data not shown), indicating the myeloid nature of the blast population. Immunophenotypic characterization of PB, BM, and spleen in diseased mice confirmed the predominance of myeloid Mac1+ and Gr-1+ cells and the reduction of lymphoid cells compared with the EGFP control mice (Figure 5; Table 1). Analysis of the clonality of the disease by Southern blotting demonstrated different intensities and patterns of proviral signals in the different hematopoietic organs consistent with an oligoclonal nature of the disease (Figure S1, available on the Blood website; see the Supplemental Materials link at the top of the online article). Sequencing of retroviral integration sites (n = 9; 3 independent transplantation experiments) in the diseased mice that received transplants of BM cells expressing Cdx2 or W167A-Cdx2 did not show any recurrent integration sites, arguing against insertional mutagenesis as a key factor in this disease model (Table 2).
Survival of mice that received transplants. Survival curves of mice that received transplants of BM cells expressing Cdx2 (n = 25), the W167A-CDX2 mutant (n = 14), or the ΔN-Cdx2 mutant (n = 13). The control group received transplants of BM infected with the EGFP control retrovirus (n = 10). The survival time of secondary recipient mice that received transplants of BM from diseased primary animals from the Cdx2 or W167A-CDX2 cohort is indicated. Tx indicates transplantation.
Survival of mice that received transplants. Survival curves of mice that received transplants of BM cells expressing Cdx2 (n = 25), the W167A-CDX2 mutant (n = 14), or the ΔN-Cdx2 mutant (n = 13). The control group received transplants of BM infected with the EGFP control retrovirus (n = 10). The survival time of secondary recipient mice that received transplants of BM from diseased primary animals from the Cdx2 or W167A-CDX2 cohort is indicated. Tx indicates transplantation.
Histology of mice that received transplants. Immunohistologic analyses of different organs of a representative leukemic Cdx2 or W167A-Cdx2 mouse compared with a healthy animal from the ΔN-Cdx2 cohort. The spleen (Giemsa staining, ×640) of the analyzed Cdx2 and W167A-Cdx2 animals shows an infiltration with blast cells in contrast to the ΔN-Cdx2 animal that received a transplant. The liver of the Cdx2 and W167A-Cdx2 mice demonstrates perivascular infiltration with leukemic cells. Positivity for myeloperoxidase (MPO) and chloracetate esterase (CAE) confirmed the myeloid nature of the cells (×100 and ×400). May-Grunwald-Giemsa–stained cytospin preparations of cells isolated from the spleen (×640) or BM (×1000) of ΔN-Cdx2 mice that received transplants show mature lymphoid and myeloid cells, respectively. LN indicates lymph node; RP, red pulp; WP, white pulp; and CAE, chloracetate esterase.
Histology of mice that received transplants. Immunohistologic analyses of different organs of a representative leukemic Cdx2 or W167A-Cdx2 mouse compared with a healthy animal from the ΔN-Cdx2 cohort. The spleen (Giemsa staining, ×640) of the analyzed Cdx2 and W167A-Cdx2 animals shows an infiltration with blast cells in contrast to the ΔN-Cdx2 animal that received a transplant. The liver of the Cdx2 and W167A-Cdx2 mice demonstrates perivascular infiltration with leukemic cells. Positivity for myeloperoxidase (MPO) and chloracetate esterase (CAE) confirmed the myeloid nature of the cells (×100 and ×400). May-Grunwald-Giemsa–stained cytospin preparations of cells isolated from the spleen (×640) or BM (×1000) of ΔN-Cdx2 mice that received transplants show mature lymphoid and myeloid cells, respectively. LN indicates lymph node; RP, red pulp; WP, white pulp; and CAE, chloracetate esterase.
Immunophenotype of cells isolated from the spleens of mice that received transplants. Expression of the myeloid markers Gr1 and Mac1 and the lymphoid marker B220 on cells isolated from the spleen of representative animals that received transplants of BM cells transduced with different constructs as indicated. The proportion of positive cells within the EGFP+ or EYFP+ compartment is indicated.
Immunophenotype of cells isolated from the spleens of mice that received transplants. Expression of the myeloid markers Gr1 and Mac1 and the lymphoid marker B220 on cells isolated from the spleen of representative animals that received transplants of BM cells transduced with different constructs as indicated. The proportion of positive cells within the EGFP+ or EYFP+ compartment is indicated.
In contrast, mice transplanted with hematopoietic progenitor cells expressing the ΔN-Cdx2 (n = 13) did not develop any disease in 11 of 13 patients (Figures 3,Figure 4–5; Table 1). A total of 2 mice developed AML after a very long latency time of 365 and 400 days after transplantation (Figure 3). To exclude that ΔN-Cdx2 perturbed hematopoiesis without obvious clinical symptoms, 3 mice without disease manifestations were killed 120 days after transplantation. Engraftment with ΔN-Cdx2–positive cells was 90% (± 10%) at that time point. There were no signs of splenomegaly, and the histopathology of the organs showed a normal tissue architecture (Figure 4). Moreover, cytospin preparations from BM and spleen showed differentiated myeloid and lymphoid cells, and immunophenotyping did not demonstrate a myeloid infiltration in the spleen as seen in mice that received transplants of Cdx2 or the W167A mutant (Figures 4,5). In summary, these experiments indicated that deletion of the N-terminal transactivation domain of Cdx2 eliminates its ability of the protein to dysregulate Hox gene expression and to transform hematopoietic progenitors in vitro and in vivo.
CDX2 is highly expressed in patients with AML with normal karyotype
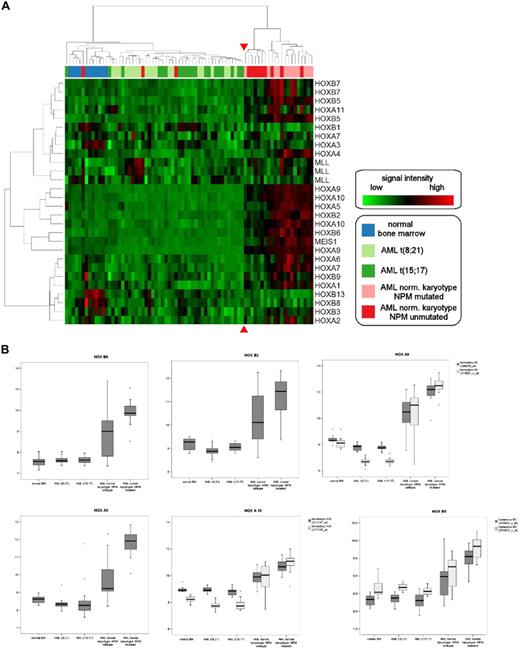
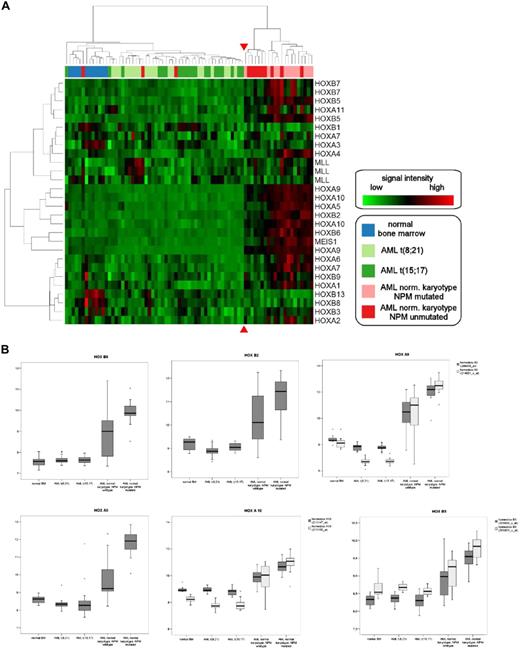
As the experimental data in the murine system suggested that ectopic expression of CDX2 is linked to dysregulated HOX gene expression in AML, we focused on patients with normal karyotype and NPM1 mutation (NPMc+ AML), previously shown to aberrantly express HOX genes12 (Table S1). We confirmed these data using oligonucleotide microarray analysis and extended these findings to the patient group with normal karyotype without the NPM1 mutation (NPMc−). A total of 24 patients with normal karyotype, 12 patients with NPMc+ AML and 12 patients with NPMc− AML, was analyzed. Patients with normal karyotype and NPM1 mutation were characterized by aberrant expression of multiple HOXA cluster genes such as HOXA10, HOXA9, and HOXA7, and HOXB cluster genes such as HOXB5 and HOXB6 (Figure 6A-B). However, patients with NPMc− AML with normal karyotype also showed dysregulated HOX gene expression compared with patients with AML expressing the PML-RARA (n = 20) or AML1-ETO (n = 20) fusion gene or compared with normal healthy donors (n = 11).
Hierarchic clustering of CDX2-positive AML samples according to HOX gene expression. (A) Unsupervised hierarchic clustering according to HOX gene expression demonstrates HOX gene deregulation in patients with normal karyotype with or without NPM1 mutation compared with samples with abnormal karyotype or normal bone marrow samples. The red arrows highlight the boundary between the 2 main clusters. The genes and samples were permutated. (B) Expression of individual HOX genes in CDX2-positive AML samples with normal and abnormal karyotype. Log expression levels of 6 different HOX genes in 75 clinical samples are shown in box-and-whisker plots. Expression was determined by Affymetrix HGU-133 A and B microarrays. The plots show the normalized expression values in normal BM samples (n = 11), AML with t(8;21) (n = 20), AML with t(15;17) (n = 20), and AML with normal karyotype with (n = 12) and without NPM1 mutation (n = 12). The bar indicates the median expression levels and the box shows the 25th and 75th percentiles, while the whiskers show the maximum and minimum values. Outliers (values that are more than 1.5 interquartile ranges above the 75th or below the 25th percentile) are represented by open circles.
Hierarchic clustering of CDX2-positive AML samples according to HOX gene expression. (A) Unsupervised hierarchic clustering according to HOX gene expression demonstrates HOX gene deregulation in patients with normal karyotype with or without NPM1 mutation compared with samples with abnormal karyotype or normal bone marrow samples. The red arrows highlight the boundary between the 2 main clusters. The genes and samples were permutated. (B) Expression of individual HOX genes in CDX2-positive AML samples with normal and abnormal karyotype. Log expression levels of 6 different HOX genes in 75 clinical samples are shown in box-and-whisker plots. Expression was determined by Affymetrix HGU-133 A and B microarrays. The plots show the normalized expression values in normal BM samples (n = 11), AML with t(8;21) (n = 20), AML with t(15;17) (n = 20), and AML with normal karyotype with (n = 12) and without NPM1 mutation (n = 12). The bar indicates the median expression levels and the box shows the 25th and 75th percentiles, while the whiskers show the maximum and minimum values. Outliers (values that are more than 1.5 interquartile ranges above the 75th or below the 25th percentile) are represented by open circles.
We performed unsupervised hierarchic clustering using the expression levels of 21 genes from the HOX gene cluster in the 64 patient samples and 11 healthy controls: in this analysis, all 12 NPMc+ AML samples with normal karyotype and 9 of the 12 NPMc− samples with normal karyotype formed 1 main cluster. The other main cluster consisted of all the samples with t(8;21) or t(15;17) translocations, the 11 normal bone marrow samples, and the 3 NPMc− samples with normal karyotype, which had shown no perturbation of HOX gene expression (Table S1). Of note, only 1 of the 21 patients with AML with normal karyotype showed an up-regulation of the MLL gene, which is known to be an upstream regulator of HOX genes (Figure 6A).
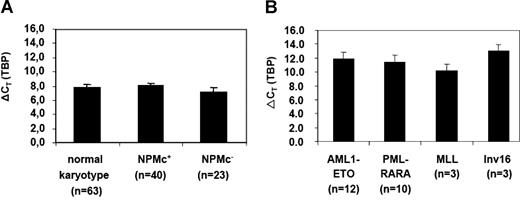
As AML with normal karyotype separated from the other cytogenetic AML subgroups by their pattern of HOX gene expression, we analyzed expression of CDX2 and other members of the CDX gene family in normal human and murine hematopoietic cells and different AML subgroups using quantitative PCR. CDX1, CDX2, and CDX4 were not detectable in normal human BM (n = 3), CD34+ human BM (n = 3), and human cord blood cells (n = 2). We also could not detect the CDX2 transcript in human CD34+/CD38−, CD34+/CD38+, and CD34−/CD38+ BM cells from healthy donors in up to 45 cycles of qRT-PCR (n = 3). Cdx1 and Cdx2 were also not detectable in murine samples, whereas Cdx4 was expressed in murine BM and splenic cells as previously reported39 (Table S2; n = 3). A total of 71 patients with normal karyotype (AML NPMc+ = 45 patients; NPMc− = 26 patients) was analyzed for CDX2 expression. Of the patients with NPMc+ AML, 89% showed aberrant expression of CDX2 as did 88% of the patients without the NPM1 mutation (Figure 7A; Tables 3, S1). Sequencing of the complete coding region of CDX2 in 5 patients with NPMc+ AML did not show any mutations or deletions. To test whether FLT3 mutation would affect expression levels of CDX2 in the patients with normal karyotype, we analyzed the 4 subgroups characterized by NPM1 mutation with our without FLT3 mutation (AML NPMc+ ± FLT3 mutation) and the NPMc− patients with or without FLT3 mutation (AML NPMc− ± FLT3 mutation): as illustrated in Table 4 there was no major difference in the expression level between the different patient cohorts.
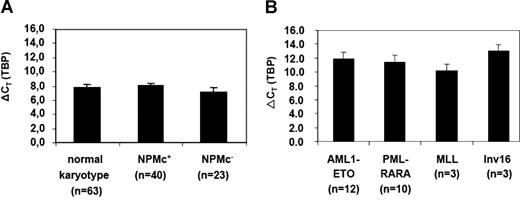
Quantification of CDX2 expression in patients with AML by RQ-PCR. (A) Expression levels of CDX2 in patients with AML with a normal karyotype with (NPMc+) or without NPM1 mutation (NPMc−) or (B) in different AML subgroups with abnormal karyotype. A total of 115 samples were analyzed. The number of patients who were positive for CDX2 expression and were therefore evaluated for expression levels are indicated. ΔCT values were obtained by normalization for the housekeeping gene TBP; the mean values (± SD) are shown. The expression level of the gene is inversely correlated with the ρCT value.
Quantification of CDX2 expression in patients with AML by RQ-PCR. (A) Expression levels of CDX2 in patients with AML with a normal karyotype with (NPMc+) or without NPM1 mutation (NPMc−) or (B) in different AML subgroups with abnormal karyotype. A total of 115 samples were analyzed. The number of patients who were positive for CDX2 expression and were therefore evaluated for expression levels are indicated. ΔCT values were obtained by normalization for the housekeeping gene TBP; the mean values (± SD) are shown. The expression level of the gene is inversely correlated with the ρCT value.
We extended this analysis to 44 patients with abnormal karyotype and detected aberrant CDX2 expression in 64% (28 of 44) of the patients: 12 of 24 patients with the translocation t(8;21)(q22;q22), 10 of 10 patients with the translocation t(15;17)(q22;q11), 3 of 4 patients with inv16, and 3 of 6 patients with MLL-associated translocations showed expression of CDX2 (Figure 7B; Tables 3, S1).
Importantly, when the expression level of the CDX2 was compared between patients with AML with normal and abnormal karyotypes, there was a more than 14-fold higher expression level in the patient group with normal karyotype (n = 42) compared with the group with aberrant karyotype (n = 28)(ØρCT 8.23 vs ØρCT 11.66, respectively; P < .001). A total of 3 NPMc− patients with normal karyotype showed the same low level of expression of CDX2 (range, ρCT 10.55-11.55) as patients with AML with aberrant karyotype. Of note, these were the same 3 patients shown before to have no perturbation of HOX gene expression and thereby fall into the same cluster as patients with AML with t(8;21) or t(15;17) according to HOX gene expression.
When the CDX2 expression level was analyzed in the different cytogenetic subgroups of patients with aberrant karytoype, patients characterized by expression of the AML1-ETO, PML-RARA, and CBFβ-Myh11 showed uniformly low expression levels. Interestingly, the 3 patients with MLL fusion, a subgroup known to be characterized by HOX gene dysregulation, showed a higher expression of CDX2 compared with the t(8;21) or t(15;17) cytogenetic subgroups. These data indicated that high expression levels of CDX2 are associated with HOX gene dysregulation in AML. To analyze whether expression of other members of the CDX gene family might be associated with HOX gene dysregulation in patients with normal karyotype, we determined transcription of CDX1 and CDX4 in 23 patients of this AML subgroup: in contrast to CDX2, CDX1 and CDX4 were not detectable in any of the patients tested, pointing to a key role of CDX2 in this patient group.
Discussion
Leukemias are initiated by a minor fraction of leukemic stem cells (LSCs) that have maintained or reacquired the capacity for indefinite proliferation through accumulated genetic alterations mutations and/or epigenetic changes.40 Aberrant expression of homeobox genes, detectable in more than every third case of AML, is thought to contribute to the infinite self-renewal properties of LSCs. The molecular mechanisms that mediate aberrant HOX gene expression in leukemias are known only for a minority of cases, namely those involving rearrangements of specific HOX genes or rearrangements of the trithorax group gene MLL.14,39,41,–43 In this study, we now demonstrate that the Cdx2 gene is able to up-regulate several HoxA and HoxB cluster genes such as Hoxa5, Hoxa7, Hoxa9, Hoxa10, or Hoxb8; Hoxb6 and Hoxb3 previously have been shown to induce AML in mice or perturb normal hematopoietic development.7,44,,,–48 Interestingly, Cdx2 did not change the expression of Hox genes with no reported leukemogenic potential such as Hoxb4 or Hoxb13, suggesting that Cdx2 is able to perturb in particular expression of Hox genes with transforming potential. Our findings are consistent with data in nonhematopoietic cells that documented the ability of Cdx genes to alter Hox gene expression patterns.49,–51 The ability of Cdx2 to dysregulate Hox gene expression was clearly dependent on its N-terminal transactivation domain. This is in line with data that previously showed that the N-terminal transactivation domain, in contrast to the portion C-terminal of the homeodomain, is necessary for transcriptional activation of downstream target genes such as Hox genes and directly interacts with the transcriptional cofactor CBP.52,–54 Furthermore, it was shown that deletion of the N-terminal transactivation domain did not only abrogate the ability of Cdx2 to perturb Hox gene expression, but also eliminated the transforming activity of the gene in vitro and in vivo. Particularly in serial replating assays, considered to be a surrogate test for the self-renewal of hematopoietic progenitors, the N-terminally deleted mutant did not transfer infinite self-renewal properties to transduced progenitor cells as observed for Cdx2. Furthermore and in contrast to the ΔN mutant, Cdx2-expressing cells acquired leukemia-initiating potential in mice that received transplants after serial replating. This clear difference in the transforming potential between Cdx2 and its N-terminal deleted mutant was further confirmed by BM transplantation assays, showing rapid development of AML in mice that received transplants of Cdx2 in contrast to mice that received transplants of BM cells expressing the ΔN mutant. Inactivation of the putative Pbx-interacting site in Cdx2, however, did not change the transforming potential of the gene. These findings parallel data on the transforming activity of Cdx4: deletion of its N-terminal transactivation domain but not the inactivation of the putative Pbx interacting site resulted in loss of its hematopoietic activity and ability to perturb Hox gene expression.39 Like Cdx2, Cdx4 up-regulated leukemogenic Hox genes such as 5′-located HoxA cluster genes or HoxB cluster genes such as Hoxb3 or Hoxb8.39 Taken together, these data indicate that the key role of the N-terminal transactivation domain for the alteration of Hox gene expression is conserved between the different Cdx family members. However, in the murine BM transplantation model, Cdx4 had a comparably low leukemogenic potential compared with Cdx2, with only half of the animals developing AML after a long-latency time of 300 days after transplantation.39 The reason for this is not yet understood, but it is interesting to note that in contrast to Cdx2, Cdx4 also up-regulated Hox genes such as the nonleukemogenic Hoxb4. Therefore, it might be that ectopic expression of Cdx2 induces a more pronounced shift toward the expression of 5′-located leukemogenic Hox genes compared with Cdx4.
Strikingly, in human AML, high CDX2 expression levels were clearly correlated with perturbed HOX gene expression: whereas ectopic expression of CDX2 was detected in AML subtypes with our without aberrant HOX gene expression, high transcript levels of the HOX upstream regulator were closely associated with HOX gene dysregulation. This was in particular demonstrated for the large group of patients with AML and normal karyotype independent of their NPM1 mutational status, counting for 50% of all patients with human AML. These patients had a more than 14-fold higher expression of CDX2 compared with t(8;21)- or t(15;17)-positive patients. The association of high CDX2 expression and HOX gene perturbation was further underlined by the finding that the 3 NPMc− patients with low CDX2 expression did not show HOX gene perturbation and fell into the same group as the t(8;21)- or t(15;17)-positive patients with AML when unsupervised clustering according to HOX gene expression was performed. Of note, in our study, expression of other members of the CDX gene family were not associated with dysregulated HOX gene expression in human AML with normal karyotype, as all 23 samples tested were negative for expression of CDX1 and CDX4. In a recent report, Bansal et al detected expression of CDX4 in 3 of 16 patients with AML and normal karyotype, indicating that expression of CDX4 can occur in this AML subtype, but at low frequency.39
Taking the well-known role of Cdx2 as an upstream regulator of Hox genes and the close correlation between high expression levels of CDX2 and HOX gene perturbation in human AML into account, it is intriguing to speculate that the initiation of high CDX2 expression levels might be a key step in the development of AML with aberrant HOX gene expression. This concept would provide a model for the biology of the large group of patients suffering from AML with normal karyotype. Particularly in the NPMc+ patients, which are more than 95% CD34−, induction of HOX gene dysregulation by high expression levels of CDX2 would be an intriguing explanation, because in this AML subtype aberrant HOX gene expression cannot be explained by the accumulation of CD34+ myeloid blasts, which also express high levels of multiple Hox genes during normal hematopoiesis. Our data are in line with a most recent report that also analyzed the role of ectopic CDX2 in human AML55 : based on the observation that high-level amplification of the CDX2 locus can occur in patients with AML with complex karyotype, patients with AML with aberrant and normal karyotypes were evaluated for ectopic CDX2 expression. As in our data set, the vast majority of patients with normal karyotype or translocation t(15;17) showed ectopic expression of CDX2. In contrast to our data, in which 12 of the 24 patients with AML1-ETO were negative for CDX2, 8 of the 10 patients reported by Scholl et al were positive. Consistent with the presented data, this report also documented that expression levels substantially vary between different genetically defined AML subgroups, but did not correlate CDX2 expression levels with HOX gene deregulation in AML.
Of note, in the report by Scholl et al, Cdx2 was able to up-regulate HoxB8 transcript levels, although to a much lesser extent compared with the up-regulation of HoxB8 observed in this study. Furthermore, the authors did not see any change in expression of leukemogenic HoxA cluster genes such as HoxA9. In addition, Hox genes associated with leukemogenesis such as HoxA10 or HoxB3 were even down-regulated compared with the control.55 In contrast, this study could demonstrate that Cdx2 expression is associated with up-regulation of leukemogenic Hox genes in the murine experimental system as well as in patients with AML. Interestingly, recent data described up-regulation of HOXA9, HOXA2, and HOXA7 after stable transfection of the esophageal squamous epithelial cell line HET1A with CDX2, and increased CDX2 and HOX gene expression in primary tissues of patients with esophageal cancer.51,56 This suggests that CDX2-induced up-regulation of leu-kemogenic HOX genes might be a common mechanism in the development of cancer.
However, despite the intriguing correlation between the expression levels of CDX2 and perturbed HOX gene expression in human AML, it is still uncertain to which extent the observed deregulation of this gene family is caused by CDX2: thus, although the transcript levels of CDX2 were comparable between NPMc+ and NPMc− patients, there was generally a higher expression level of individual HOX genes in patients with the NPM1 mutation. Therefore, other not-yet-defined mechanisms might be responsible for HOX gene perturbation in these patients. Another aspect is that CDX2 most probably is not exerting its transforming activity solely through induction of aberrant HOX gene expression. Another key question is how the ectopic expression of CDX2 is induced in human AML. Analyses of the promoter region of CDX2 in patients with AML did not show any mutations or hypomethylation as an explanation for the aberrant expression of the gene.55 Another possible explanation could be that constitutive activation of upstream regulators of CDX2 would induce high expression levels of the gene in human AML. It was shown that Cdx genes are upstream regulated by the Wnt/β-catenin signaling pathway, the retinoic acid signaling pathway, and the FGF pathway.57,–59
Taken together, our data underline that aberrant expression of CDX2 is widespread in human AML. In addition, they show that high expression of this gene closely correlates with aberrant HOX gene expression in patients with AML, supporting a model in which CDX2 plays an important role in the development of AML with dysregulated HOX gene expression.
The online version of this article contains a data supplement.
The publication costs of this article were defrayed in part by page charge payment. Therefore, and solely to indicate this fact, this article is hereby marked “advertisement” in accordance with 18 USC section 1734.
Acknowledgments
We want to thank Bianka Ksienzyk and Nicole Behm for their excellent technical assistance and the members of the GSF animal facility for excellent breeding and maintenance of animals. Furthermore, we want to thank B. Falini for his fruitful discussions.
This work was supported by a grant of the DFG (SFB 684 project A7 to V.P.S.R. and C.B.), the Deutsche Krebshilfe (70-2968-Fe I to M.F.B.), and the Bundesministerium für Bildung und Forschung (NGFN2 grant 01GS0448 to C.B. and M.F.B.).
Authorship
Contribution: V.P.S.R. designed and performed experiments and wrote the manuscript; S.T, V.M.N., N.A., K.P., and K.S. performed experiments; B.H, K.M, S.K.B, and A.D. performed data analysis; L.Q.-M. performed the histopathology; W.H. and M.F-B. designed experiments; and C.B. designed the study and wrote the manuscript.
Conflict-of-interest disclosure: The authors declare no competing financial interests.
Correspondence: Christian Buske, CCG Leukemia GSF, Marchioninistr 25, 81377, Munich, Germany; e-mail: buske@gsf.de.

