Multiple myeloma (MM) is an incurable hematologic malignancy characterized by recurrent chromosomal translocations. Patients with t(4;14)(p16;q32) are the worst prognostic subgroup in MM, although the basis for this poor prognosis is unknown. The t(4;14) is unusual in that it involves 2 potential target genes: fibroblast growth factor receptor 3 (FGFR3) and multiple myeloma SET domain (MMSET). MMSET is universally overexpressed in t(4;14) MM, whereas FGFR3 expression is lost in one-third of cases. Nonetheless, the role of MMSET in t(4;14) MM has remained unclear. Here we demonstrate a role for MMSET in t(4;14) MM cells. Down-regulation of MMSET expression in MM cell lines by RNA interference and by selective disruption of the translocated MMSET allele using gene targeting dramatically reduced colony formation in methylcellulose but had only modest effects in liquid culture. In addition, MMSET knockdown led to cell-cycle arrest of adherent MM cells and reduced the ability of MM cells to adhere to extracellular matrix. Finally, MMSET knockdown and knockout reduced tumor formation by MM xenografts. These results provide the first direct evidence that MMSET plays a significant role in t(4;14) MM and suggest that therapies targeting this gene could impact this particular subset of poor-prognosis patients.
Introduction
Recurrent chromosomal translocations are central to the pathogenesis, diagnosis, and prognosis of hematologic malignancies. In the past decade, it has become apparent that approximately 50% of multiple myeloma (MM) cases harbor recurrent translocations involving the immunoglobulin heavy chain (IgH) locus on chromosome 14q32.1,2 The translocation t(4;14)(p16;q32) is the second most common translocation in MM, affecting 15% of patients, and is associated with the worst prognosis.3 The t(4;14) dysregulates 2 genes on chromosome 4. The FGFR3 gene is placed under the control of the IgH 3′ α enhancers, and the MMSET/NSD2/WHSC1 gene is placed under the control of the IgH intronic μ enhancer. FGFR3 has transforming activity in vitro and in vivo, but approximately 30% of t(4;14) MM patients do not express FGFR3, whereas overexpression of MMSET isoforms is a universal feature of t(4;14) cases.4,–6 Furthermore, the poor prognosis of t(4;14) persists irrespective of FGFR3 expression.5 These data suggest that MMSET may be the primary, or at least a cooperating, oncogene in this translocation.
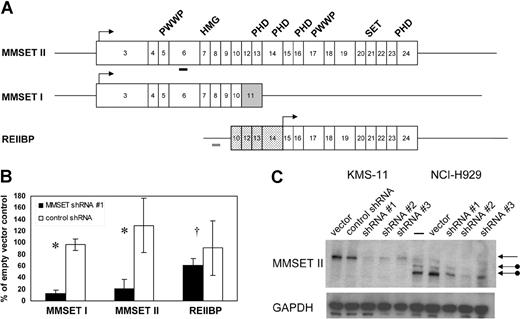
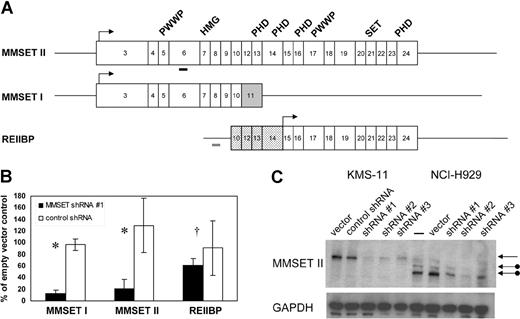
MMSET is capable of producing 3 major isoforms (Figure 1A). MMSET II encodes the full-length protein of 1365 amino acids. MMSET I is a shorter isoform of 647 amino acids, generated by alternative splicing, and is identical to the N-terminal portion of MMSET II.7,8 A 584 amino acid isoform, known as REIIBP, sharing identical C-terminal sequences to MMSET II, is generated from a transcript initiating in intron 9 of the MMSET locus.9 MMSET isoforms share various conserved protein domains suggesting a role in DNA-binding and chromatin modification, including PWWP domains, an HMG domain, PHD zinc fingers, and a C-terminal SET domain characteristic of histone methyltransferases. In transient transfection assays in 293T and HeLa cells, MMSET I, but not MMSET II, has been shown to behave as a transcriptional repressor and to coimmunoprecipitate with corepressor proteins, such as HDAC1 and mSin3b.10 Depending on their location, translocation breakpoints in t(4;14) MM may produce unaltered MMSET isoforms or may lead to truncations at the N-termini of MMSET I and MMSET II, which may affect their intracellular localization.5,10 Therefore, it has been unclear whether the translocations would cause a gain of function, loss of function, or dominant-negative effect.
Stable RNA interference of MMSET I and MMSET II isoforms in t(4;14) + MM cells. (A) Structure of transcripts originating from the MMSET locus. Boxes indicate protein-coding exons, beginning with exon 3 for MMSET I and II. Lines indicate 5′ and 3′ untranslated regions (not shown to scale). MMSET II splices from exon 10 to exons 12-24, whereas MMSET I splices from exon 10 to exon 11, which is shaded gray. The untranslated exons 10 and 12-14 of REIIBP are stippled. REIIBP translation begins in exon 15. Arrows indicate major translation initiation sites. The conserved protein domains PWWP, HMG, PHD, and SET are indicated above the corresponding exons. Thick bars indicate positions of MMSET shRNA 1 (black) and control (gray) short hairpin RNAs. (B) Real-time quantitative RT-PCR analysis of MMSET I, MMSET II, and REIIBP transcripts in KMS-11 cells stably transduced with MMSET shRNA lentivirus or control shRNA lentivirus. Transcript levels are relative to empty vector–transduced cells. Results are means (± SD) of at least 2 independent lentiviral infections (*P < .05, †P = .45 by Student t test). (C) Immunoblotting with antisera recognizing a C-terminal epitope of MMSET demonstrates reduction of full-length MMSET protein by 3 different shRNAs in KMS-11 (lanes 1-5) and NCI-H929 (lanes 6-10). The top arrow indicates full-length MMSET II, translated from the first ATG codon in exon 3. The lower arrows indicate MMSET II isoforms consistent with translation from downstream ATG codons in exons 4 and 6 in NCI-H929 cells, which have a translocation breakpoint between exons 3 and 4.
Stable RNA interference of MMSET I and MMSET II isoforms in t(4;14) + MM cells. (A) Structure of transcripts originating from the MMSET locus. Boxes indicate protein-coding exons, beginning with exon 3 for MMSET I and II. Lines indicate 5′ and 3′ untranslated regions (not shown to scale). MMSET II splices from exon 10 to exons 12-24, whereas MMSET I splices from exon 10 to exon 11, which is shaded gray. The untranslated exons 10 and 12-14 of REIIBP are stippled. REIIBP translation begins in exon 15. Arrows indicate major translation initiation sites. The conserved protein domains PWWP, HMG, PHD, and SET are indicated above the corresponding exons. Thick bars indicate positions of MMSET shRNA 1 (black) and control (gray) short hairpin RNAs. (B) Real-time quantitative RT-PCR analysis of MMSET I, MMSET II, and REIIBP transcripts in KMS-11 cells stably transduced with MMSET shRNA lentivirus or control shRNA lentivirus. Transcript levels are relative to empty vector–transduced cells. Results are means (± SD) of at least 2 independent lentiviral infections (*P < .05, †P = .45 by Student t test). (C) Immunoblotting with antisera recognizing a C-terminal epitope of MMSET demonstrates reduction of full-length MMSET protein by 3 different shRNAs in KMS-11 (lanes 1-5) and NCI-H929 (lanes 6-10). The top arrow indicates full-length MMSET II, translated from the first ATG codon in exon 3. The lower arrows indicate MMSET II isoforms consistent with translation from downstream ATG codons in exons 4 and 6 in NCI-H929 cells, which have a translocation breakpoint between exons 3 and 4.
Despite the aforementioned data, there has been no direct demonstration of any activity of the MMSET proteins in MM cells. We have taken the approach of reducing MMSET levels in t(4;14) + MM cell lines by RNAi, as well as by selective disruption of the translocated, overexpressed MMSET allele using somatic cell gene targeting. We demonstrate that MM cells rely on MMSET expression for clonogenic growth and tumorigenicity in vivo, suggesting that MMSET is an important oncogene in the t(4;14) translocation.
Methods
Cell culture
KMS-11 (gift of P. Leif Bergsagel, Mayo Clinic, Scottsdale, AZ), U266, NCI-H929, and Raji cells were grown in RPMI-1640 (Invitrogen, Carlsbad, CA) with 10% fetal bovine serum (Hyclone, Logan, UT), 100 U/mL penicillin and 100 μg/mL streptomycin (Invitrogen).
RNA interference
Sequences encoding short hairpin RNAs were cloned into the XhoI and HpaI sites of a modified pLentilox 3.7 vector (gift of Luk van Parijs, Whitehead Institute for Biomedical Research, Cambridge, MA) in which the NheI/EcoRI fragment encoding GFP was replaced by a blunted HindIII/ClaI fragment containing the puromycin resistance gene from pBabe puro. Target sequences were as follows: MMSET short hairpin RNA (shRNA) 1, 5′-GCTATTGAAACCAATTTCA, MMSET shRNA 2, 5′-GCACGCTACAACACCAAGTTT, MMSET shRNA 3, 5′-GCACAGTCTTCGGAAGAGAGACACAATCA and 5′-GGGTTTATGATTTGAAACT and 5′-GGCATTGCTGCAGAGTCTTTGGGAGAAAT for control shRNAs. Lentiviruses were produced by transiently cotransfecting 293T cells with the shRNA-expressing lentivirus vector, packaging plasmid pCMVΔR8.91 and VSV-G envelope plasmid pMD.G (created by Didier Trono, University of Geneva, Switzerland, kind gifts of Xiaobing Yu, Johns Hopkins University, Baltimore, MD) using Fugene 6 (Roche Diagnostics, Indianapolis, IN) or TransIT-293 (Mirus Bio, Madison, WI) according to the manufacturers' instructions. Cells were infected with lentiviruses in the presence of 8 μg/mL polybrene (Sigma-Aldrich, St Louis, MO). Two days after infection, cells were selected in puromycin (Sigma-Aldrich) and maintained thereafter in medium containing puromycin.
Targeted disruption of MMSET by homologous recombination
Targeted disruption of MMSET was conducted with an adeno–associated viral vector as described.11,12 The targeting cassette contains a short synthetic intron, an internal ribosome entry site and a promoter-less neomycin resistance gene followed by a polyadenylation signal, all flanked by loxP sites.13 5′- and 3′-homology arms were constructed by high-fidelity PCR, using genomic DNA from the KMS-11 cell line as template. The targeting vector was transduced into KMS-11 cells and antibiotic selection was performed with 400 μg/mL G418 (GIBCO, Carlsbad, CA). Neomycin resistant colonies were expanded, and PCR-based screening was performed to identify cells that had undergone homologous integration of the targeting vector as described.14,15 Targeted cells were infected with an adenovirus encoding Cre recombinase to remove the selection cassette, followed by single-cell dilution and screening by PCR for successful Cre recombination. Primer sequences for PCR and for identifying IgH-MMSET fusion transcripts by reverse transcription–polymerase chain reaction (RT-PCR) are shown in Table S1 (available on the Blood website; see the Supplemental Materials link at the top of the online article).
cDNA synthesis and quantitative real-time RT-PCR
Total RNA was extracted from cells using the RNeasy mini kit (Qiagen, Valencia, CA) according to the manufacturer's instructions, with on-column DNAase I digestion. Complementary DNA was synthesized using First Strand cDNA synthesis kit (GE Amersham, Pittsburgh, PA). Real-time PCR was performed using the MyiQ system (BioRad, Hercules, CA) using cDNA as template. Reactions were performed in triplicate and repeated at least twice. Transcript levels were normalized to glyceraldehyde-3-phosphate dehydrogenase (GAPDH) levels in the same samples in each experiment, expressed as ΔCt. MMSET primer sequences are in Table S1. Target gene and adhesion molecule primer sequences are available on request.
Immunoblotting
Whole cell protein extracts prepared in Laemmli sample buffer were resolved by SDS-PAGE using 4% to 12% NuPage gels (Invitrogen), transferred to Invitrolon PVDF membranes (Invitrogen), and probed with primary and horseradish peroxidase-conjugated secondary antibodies. Primary antibodies were rabbit polyclonal anti-REIIBP (gift of Dr Charles Garlisi, Schering-Plough Research Institute, Kenilworth, NJ) and mouse monoclonal anti-GAPDH (6C5; ab 8245, Abcam, Cambridge, MA). Proteins were visualized with Western Lightning Plus (PerkinElmer Life and Analytical Sciences, Waltham, MA).
Cell-cycle analysis
Cells were fixed in phosphate-buffered saline/3% formaldehyde/0.4% NP-40 containing 2 μg/mL Hoechst 33258 (Invitrogen). DNA content was measured with a BD LSR flow cytometer (BD Biosciences, San Jose, CA), and percentages of G0/G1, S, and G2/M phase cells were determined using Modfit LT software (Verity Software House, Topsham, ME).
Adhesion assay
Cells (106 KMS-11) transduced with either empty vector lentivirus or MMSET shRNA lentivirus were seeded in triplicate in complete RPMI 1640 medium in a 6-well plate coated with growth factor–reduced BD Matrigel (BD Biosciences) according to the manufacturer's instructions. After allowing cells to adhere 6 hours at 37°C, the medium was removed, and the wells were washed gently with Hanks balanced salt solution (Invitrogen). Washes were pooled with the medium, and the suspended cells were counted using a hemacytometer.
Methylcellulose colony formation assays
Methylcellulose media consisted of RPMI 1640 containing 1.1% methylcellulose (Aqua Solutions, Deer Park, TX), 30% fetal bovine serum, 100 U/mL penicillin, 100 μg/mL streptomycin, and puromycin at the appropriate concentration for each cell line. Cells were plated at a density of 500 cells/mL in 1 mL volume in humidified 24-well plates. Colonies were counted between 10 and 15 days after plating. For photomicrographs, plates were viewed with an Eclipse TE2000-S microscope using a CFI Plan Fluor DL 4×/0.17 lens (Nikon, Melville, NY). Images were acquired using a SPOT RT KE monochrome cooled CCD camera and SPOT version 4.0.1 software (Diagnostic Instruments, Sterling Heights, MI).
Xenograft studies
Eight- to 10-week-old female athymic nude mice (Harlan, Indianapolis, IN) were injected subcutaneously in the bilateral flanks with 100 μL Hanks balanced salt solution containing 107 KMS-11 cells stably transduced with empty vector lentivirus or MMSET shRNA lentivirus, or with 107 parental or gene–targeted KMS-11 cells. Twenty-four-week-old NOD/SCID mice were injected subcutaneously bilaterally with 5 × 10⁶ (2 mice each) or 107 (2 mice each) NCI-H929 cells stably transduced with empty vector lentivirus or MMSET shRNA lentivirus. Injection sites were examined for tumors weekly. NCI-H929 tumors grown in NOD/SCID mice were weighed at the end of the observation period (all tumors grew for an identical period of time). The Institute of Laboratory Animals Resources Guide for the Care and Use of Laboratory Animals was followed in all experiments.16
MTT assay
Cells were seeded in 96-well plates at 2500 cells/well in 0.2 mL final volume. Drugs were added at the indicated concentrations. After 44 hours of incubation, MTT (Sigma-Aldrich) was added to a final concentration of 0.5 mg/mL, and cells were incubated for 4 hours. Formazan crystals were solubilized by addition of 10% SDS/0.1 M HCl. Absorbance was read on a plate reader.
Statistical analysis
Student t tests were calculated with Excel version 2003 software (Microsoft, Redmond, WA) using an unpaired 2-sided analysis. Tumor frequencies were compared using a χ2 test. A P value less than .05 was considered statistically significant.
Results
Stable knockdown of MMSET expression in MM cell lines
To test the contribution of MMSET dysregulation to the pathogenesis of t(4;14) MM, we attempted to deplete MMSET levels with shRNA expressed from a lentiviral vector. Stable pools of virally transduced t(4;14) + KMS-11 and NCI-H929 MM cells were selected with puromycin and analyzed for MMSET isoform expression by quantitative real-time RT-PCR (qPCR) at time points ranging from 4 days to 2 months after infection. As shown in Figure 1B, an shRNA targeting MMSET exon 6 reduced RNA levels of full-length MMSET (MMSET II) and the N-terminal isoform (MMSET I) without significantly affecting the level of the C-terminal isoform (REIIBP). MMSET I transcript levels were reduced by 85% and MMSET II transcripts by 80% relative to cells transduced with empty lentiviral vector, a variety of shRNA constructs targeting other regions of the MMSET gene, or shRNA against firefly luciferase (Figure 1B and data not shown). To control for a nonspecific induction of interferon response genes, which has been reported with some RNAi studies, we performed qPCR for oligoadenylate synthase 1 and enolase 1.17,18 Neither gene was up-regulated in MMSET shRNA cells versus controls (data not shown).
Immunoblotting with antisera generated against a C-terminal epitope common to full-length MMSET and REIIBP demonstrated knockdown of MMSET II at the protein level.9 Depletion of MMSET II protein correlated with depletion of mRNA and was observed with 3 different MMSET shRNAs (Figure 1C). Unlike KMS-11 cells, NCI-H929 cells have a translocation breakpoint 3′ of the major translation initiation site of MMSET.7,8 It has been demonstrated by transient expression of MMSET-GFP fusion cDNAs that MMSET proteins can be translated in vivo from ATG codons in MMSET exons 4 and 6.5,10 We demonstrate that NCI-H929 cells do indeed express truncated MMSET II proteins consistent with translation from exons 4 and 6. The smallest isoform, consistent with usage of the exon 6 ATG, is the most abundant and is expressed in excess over the full-length protein, which is expressed from the nontranslocated allele (Figure 1C). These results confirm that the translocation (4;14) results in selective overexpression of the translocated MMSET allele, most likely from the influence of the strong IgH enhancer.
Selective disruption of the translocated MMSET allele by somatic cell gene targeting
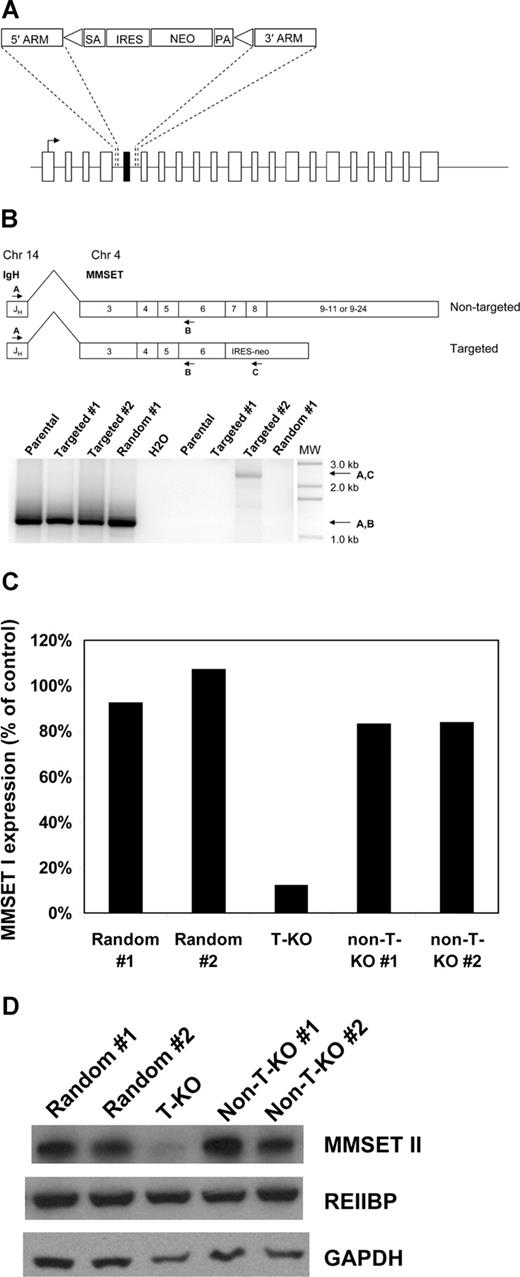
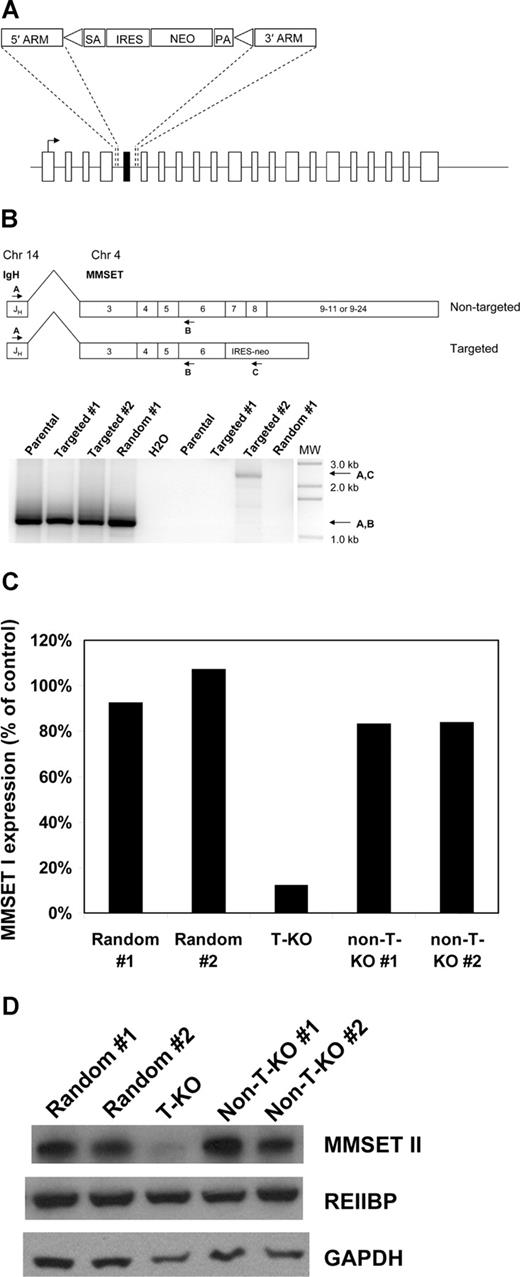
Off-target and other nonspecific effects have been described in RNA interference studies.19,–21 In addition, RNA interference does not always elucidate the same phenotypes that are seen with more traditional methods of ablating gene function, such as gene knockout by homologous recombination.22 To independently validate our RNA-interference studies and with the goal of creating an MMSET-null phenotype in human myeloma cells, we attempted to disrupt the MMSET gene in KMS-11 cells by homologous recombination. A targeting construct was designed to delete MMSET exon 7, replacing it with a neomycin resistance cassette flanked by loxP sites (Figure 2A). On subsequent Cre-loxP recombination, the neomycin resistance cassette is removed, leaving an intronic loxP site in place of exon 7. Deletion of exon 7 is predicted to shift the reading frame of the 3′ transcript, leading to a premature stop codon just after exon 6. The predicted truncated protein would lack all conserved domains except for the N-terminal PWWP domain. Successful homologous recombination events were identified by PCR screening (Figure S1). Three clones with heterozygous deletion of exon 7 were expanded, along with 2 random integrant clones, where the neomycin resistance cassette had integrated nonhomologously elsewhere in the genome. To determine whether homologous recombination in the targeted clones had occurred on the translocated allele or the intact chromosome 4 allele of MMSET, we performed a series of experiments. First, RT-PCR was used to detect and verify IgH-MMSET fusion transcripts from the translocated allele as described.23 As expected, fusion transcripts were detected in all clones (Figure 2B). Next, RT-PCR using the IgH JH6 forward primer and a neomycin resistance gene reverse primer was performed to determine whether any of the clones that had undergone homologous recombination had disrupted the translocated allele. As shown in Figure 2B, a product of the correct predicted size is seen in one targeted clone (hereafter referred to as T-KO) indicating disruption of the translocated MMSET allele. Finally, using RT-PCR primers that span the deleted exon 7, the targeted T-KO clone shows a smaller fusion transcript compared with randomly integrated clones and clones that targeted the nontranslocated MMSET allele (hereafter referred to as non-T-KO). This analysis was performed on clones after Cre-loxP deletion of the neomycin resistance cassette, using the JH6 forward primer and a reverse primer on MMSET exon 12. As shown in Figure S2, the T-KO clone displays a transcript size consistent with splicing from exon 6 to exon 8.
Selective disruption of the translocated allele of MMSET by gene targeting in KMS-11 cells. (A) Schematic of the full-length MMSET exon structure. The targeting construct is designed to delete exon 7, which is shown in black. SA indicates splice acceptor; ARM, homology arm; IRES, internal ribosome entry site; NEO, neomycin resistance gene; and PA, polyadenylation signal. Triangles represent loxP sites. After Cre-loxP recombination, a single loxP site is left in place of the deleted exon 7. Splicing from exon 6 to exon 8 results in a reading frame shift and premature termination of translation after exon 6. (B) Detection of KMS-11 cells with targeted disruption of the translocated allele of MMSET. The translocation(4;14) generates fusion transcripts initiating in the IgH JH region on chromosome 14 that splice to exon 3 of MMSET. RT-PCR with primers A and B demonstrates fusion transcripts in parental KMS-11 cells, 2 clones with targeted deletion of MMSET exon 7, and a control clone with random integration of the targeting vector (bottom, lanes 1-4). RT-PCR with primers A and C indicate fusion transcripts spliced to the neomycin cassette, which can be generated only by targeting of the translocated MMSET allele (bottom, lane 8). MW indicates DNA size ladder. (C) Differential transcription of the translocated and nontranslocated MMSET alleles revealed by gene targeting. Q-PCR analysis for the intact MMSET I isoform was performed as described using cDNA from 2 random integrant control KMS-11 clones, a clone with disruption of the translocated MMSET allele (T-KO) and 2 clones with disruption of the nontranslocated allele (non-T-KO). Intact MMSET I was detected using an exon 7-specific forward primer. Normalized MMSET I transcript levels are expressed as a percentage of the average of the levels in the 2 random integrant clones. (D) Immunoblotting demonstrates extensive depletion of full-length MMSET protein in T-KO cells but not in non-T-KO cells. REIIBP protein levels are unaffected by deletion of MMSET exon 7, as would be predicted.
Selective disruption of the translocated allele of MMSET by gene targeting in KMS-11 cells. (A) Schematic of the full-length MMSET exon structure. The targeting construct is designed to delete exon 7, which is shown in black. SA indicates splice acceptor; ARM, homology arm; IRES, internal ribosome entry site; NEO, neomycin resistance gene; and PA, polyadenylation signal. Triangles represent loxP sites. After Cre-loxP recombination, a single loxP site is left in place of the deleted exon 7. Splicing from exon 6 to exon 8 results in a reading frame shift and premature termination of translation after exon 6. (B) Detection of KMS-11 cells with targeted disruption of the translocated allele of MMSET. The translocation(4;14) generates fusion transcripts initiating in the IgH JH region on chromosome 14 that splice to exon 3 of MMSET. RT-PCR with primers A and B demonstrates fusion transcripts in parental KMS-11 cells, 2 clones with targeted deletion of MMSET exon 7, and a control clone with random integration of the targeting vector (bottom, lanes 1-4). RT-PCR with primers A and C indicate fusion transcripts spliced to the neomycin cassette, which can be generated only by targeting of the translocated MMSET allele (bottom, lane 8). MW indicates DNA size ladder. (C) Differential transcription of the translocated and nontranslocated MMSET alleles revealed by gene targeting. Q-PCR analysis for the intact MMSET I isoform was performed as described using cDNA from 2 random integrant control KMS-11 clones, a clone with disruption of the translocated MMSET allele (T-KO) and 2 clones with disruption of the nontranslocated allele (non-T-KO). Intact MMSET I was detected using an exon 7-specific forward primer. Normalized MMSET I transcript levels are expressed as a percentage of the average of the levels in the 2 random integrant clones. (D) Immunoblotting demonstrates extensive depletion of full-length MMSET protein in T-KO cells but not in non-T-KO cells. REIIBP protein levels are unaffected by deletion of MMSET exon 7, as would be predicted.
MMSET transcript levels were measured by qPCR using an exon 7-specific forward primer to detect intact MMSET I and MMSET II transcripts. Intact MMSET I levels were reduced by 90% and MMSET II levels by 85% in T-KO cells, compared with levels in non-T-KO cells and 2 random integrants (Figure 2C and data not shown). The more than 50% reduction is consistent with increased transcription from the translocated allele, as would be predicted from the influence of the strong IgH intronic enhancer. Immunoblotting confirmed significant reduction in full-length intact MMSET II protein levels in T-KO cells. As predicted, REIIBP levels do not differ significantly between targeted and control clones (Figure 2D).
In preliminary attempts to disrupt the second MMSET allele in T-KO cells, we were only able to isolate clones that had retargeted the translocated allele (data not shown). This may reflect lethality of complete disruption of MMSET or insufficient transcription from the remaining allele to generate adequate levels of neomycin resistance because the neomycin resistance gene is expressed from the endogenous promoter of the targeted locus. Nonetheless, T-KO cells are genotypically near-knockouts by virtue of the differential allelic expression of MMSET and recapitulate expression levels found in stable shRNA knockdown clones.
MMSET knockdown severely reduces clonogenic growth of MM cells
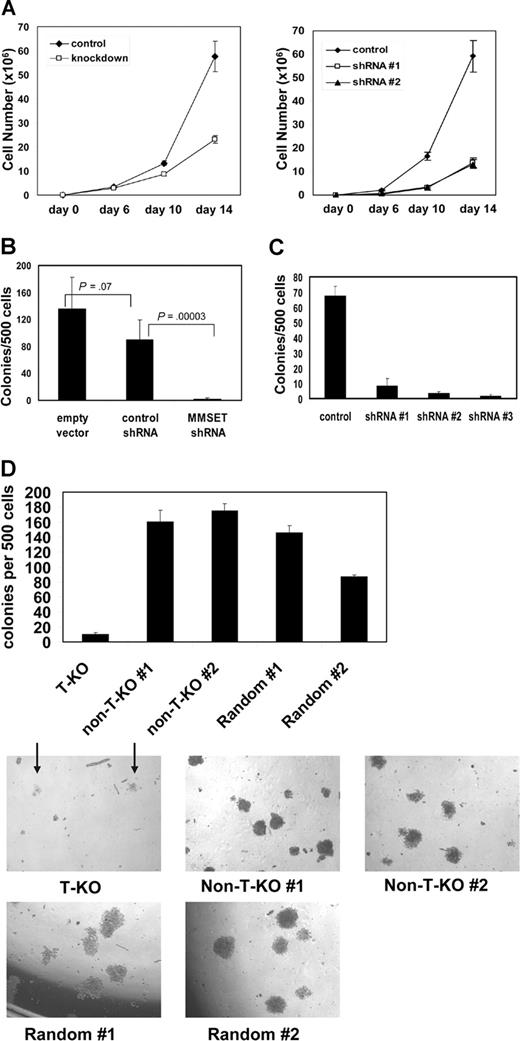
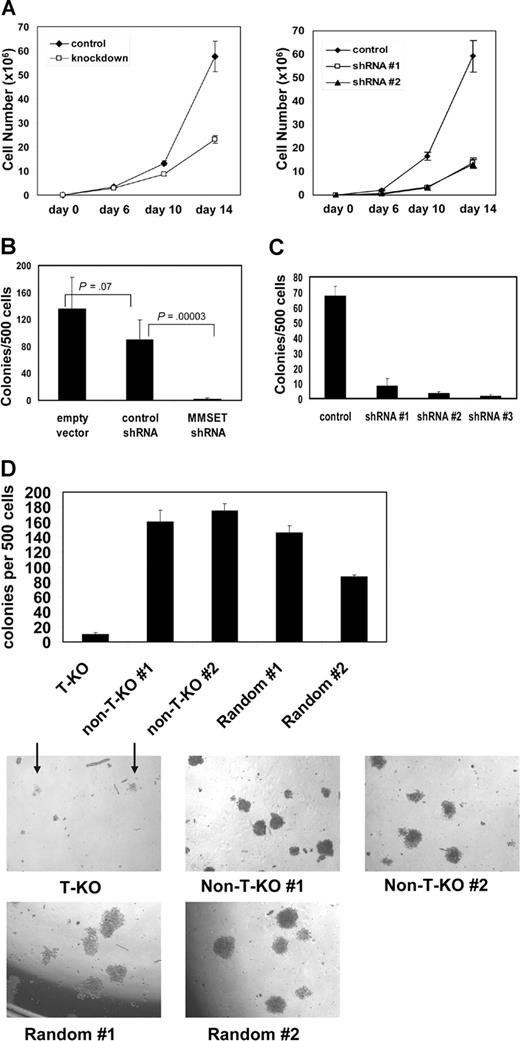
Both KMS-11 and NCI-H929 cells with MMSET knockdown grew more slowly than their control counterparts, although they could be cultured for several months under drug selection (Figure 3A). Although the differences in growth kinetics in liquid culture were subtle, such culture conditions do not adequately assess all relevant aspects of growth. To assay their clonogenic capacity, we cultured control and knockdown cells in methylcellulose. MMSET knockdown KMS-11 and NCI-H929 cells exhibited a striking loss of colony formation relative to controls (Figure 3B,C). T-KO cells were also severely impaired in their ability to grow in methylcellulose, as indicated by reduced colony number and size. In contrast, non-T-KO cells were indistinguishable from random integrant control clones (Figure 3D). MMSET knockdown was repeated in the non-t(4;14) MM cell line U266 and the Burkitt lymphoma cell line Raji. In both cell lines, MMSET knockdown also led to a 6- to 10-fold reduction in colony formation (Figure S3). MMSET shRNA reduced MMSET isoforms I and II to a similar degree in these cell lines as in KMS-11 cells (data not shown). Although U266 and Raji cells do not carry a (4;14) translocation, they express significant levels of MMSET isoforms5,24 (data not shown).
Reduced growth and clonogenicity of MMSET knockdown and knockout MM cells. (A) 105 empty vector control or MMSET shRNA-transduced KMS-11 cells (left) or NCI-H929 cells (right) were plated in triplicate on day 0. Average cell counts (mean ± SD) are presented. (B) MMSET shRNA, but not control shRNA, severely reduces KMS-11 colony formation in methylcellulose. Error bars represent SD. Student t test P values are indicated. (C) Three different MMSET shRNAs reduce methylcellulose colony formation of t(4;14)+ NCI-H929 MM cells. Error bars represent SD. (D) Disruption of the translocated MMSET allele (T-KO) dramatically reduces both the number (top) and size (bottom) of methylcellulose colonies. Arrows indicate T-KO colonies. All photomicrographs are at 4× magnification. Error bars represent SD.
Reduced growth and clonogenicity of MMSET knockdown and knockout MM cells. (A) 105 empty vector control or MMSET shRNA-transduced KMS-11 cells (left) or NCI-H929 cells (right) were plated in triplicate on day 0. Average cell counts (mean ± SD) are presented. (B) MMSET shRNA, but not control shRNA, severely reduces KMS-11 colony formation in methylcellulose. Error bars represent SD. Student t test P values are indicated. (C) Three different MMSET shRNAs reduce methylcellulose colony formation of t(4;14)+ NCI-H929 MM cells. Error bars represent SD. (D) Disruption of the translocated MMSET allele (T-KO) dramatically reduces both the number (top) and size (bottom) of methylcellulose colonies. Arrows indicate T-KO colonies. All photomicrographs are at 4× magnification. Error bars represent SD.
MMSET knockdown preferentially affects adherent growth of KMS-11 cells
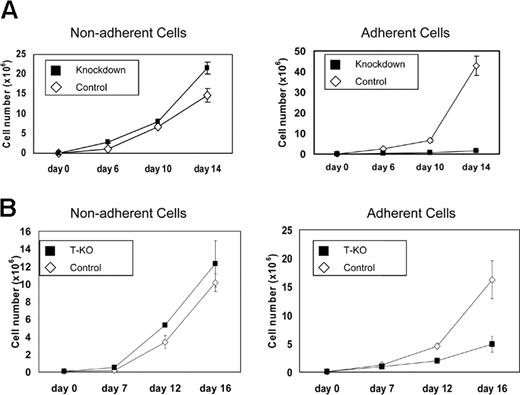
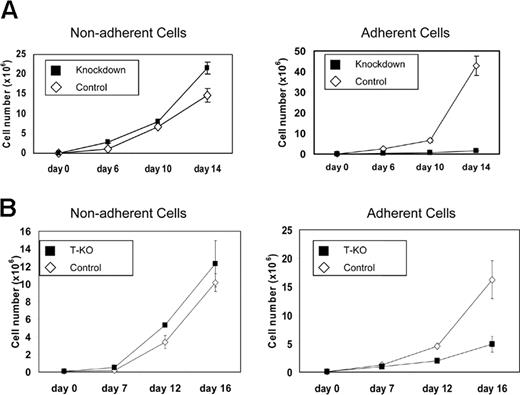
KMS-11 cells grow as a mixture of adherent and nonadherent cells in standard tissue culture flasks. MMSET-knockdown KMS-11 cells exhibited a striking shift to nonadherent growth. Although total cell numbers expanded at a rate that was only slightly slower in the knockdown cells, control cells grew preferentially adherent, whereas more than 90% of the MMSET knockdown cells were nonadherent. Adherent MMSET knockdown cells proliferated more slowly than control cells (Figure 4A). Similar effects were seen when T-KO cells were cultured (Figure 4B). Cell-cycle analysis by flow cytometry showed that adherent knockdown cells shifted from S-phase to G0/G1 relative to controls. In contrast, there was little difference between the nonadherent population of the control and knockdown cells (Table 1).
MMSET knockdown or disruption affects adherent growth of KMS-11 cells. (A) 105 empty vector control or MMSET shRNA-transduced KMS-11 cells were plated in triplicate in tissue culture flasks (day 0). Nonadherent and adherent cells were counted on the indicated days and then pooled and replated. (B) T-KO or random integrant control KMS-11 clones were plated and analyzed as in panel A. Average cell counts (mean ± SD) are presented.
MMSET knockdown or disruption affects adherent growth of KMS-11 cells. (A) 105 empty vector control or MMSET shRNA-transduced KMS-11 cells were plated in triplicate in tissue culture flasks (day 0). Nonadherent and adherent cells were counted on the indicated days and then pooled and replated. (B) T-KO or random integrant control KMS-11 clones were plated and analyzed as in panel A. Average cell counts (mean ± SD) are presented.
Reduced adhesion of MMSET-knockdown KMS-11 cells
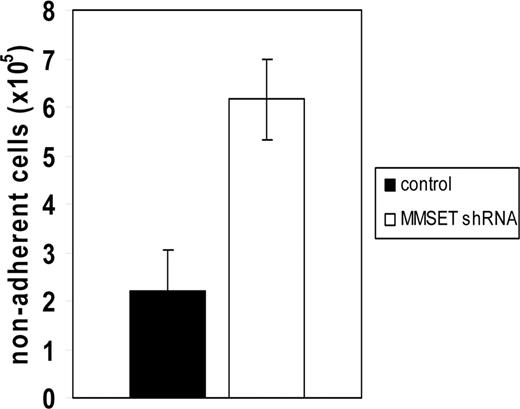
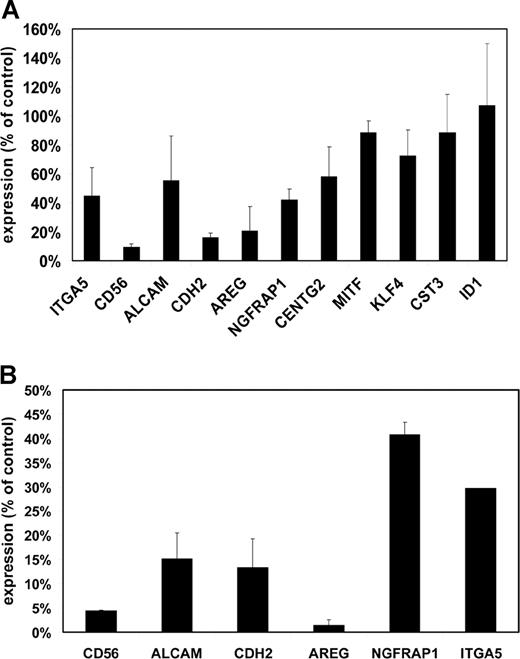
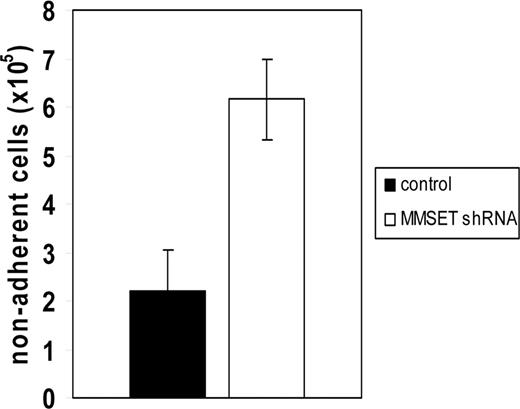
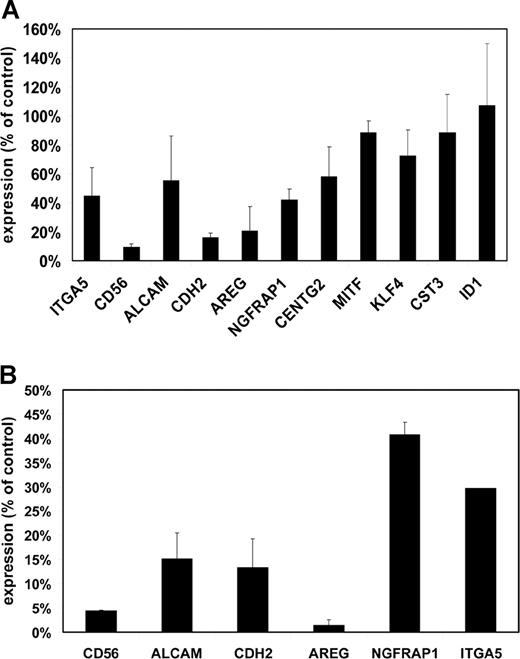
Loss of adhesion was also observed when MMSET knockdown cells were plated on Matrigel, a more physiologic adhesion substrate consisting of extracellular matrix. Because of the short-term nature of this experiment, differences in cell proliferation do not affect the interpretation of cell numbers adhering to this substrate. Under these conditions, MMSET knockdown cells demonstrated a markedly reduced ability to adhere relative to control cells (Figure 5). To discover why the MMSET knockdown cells had such a reduction in substrate adhesion, we screened a panel of adhesion molecules reported to be expressed in MM cells by qPCR. For most of the genes analyzed, transcript levels were not reduced by MMSET knockdown (Table S2). Reductions greater than 2-fold were observed for integrin α5 (ITGA5), N-cadherin (CDH2), and CD56 (Figure 6A). The CD56 antigen (also known as neural cell adhesion molecule) was reduced approximately 10-fold in the MMSET knockdown cells.
Reduced adhesion of MMSET knockdown KMS-11 cells. 106 KMS-11 cells transduced with empty vector lentivirus or MMSET shRNA lentivirus were seeded in triplicate in a 6-well plate coated with Matrigel and allowed to adhere for 6 hours before washing and counting nonadherent cells. Error bars represent SD; P = .004 by Student t test.
Reduced adhesion of MMSET knockdown KMS-11 cells. 106 KMS-11 cells transduced with empty vector lentivirus or MMSET shRNA lentivirus were seeded in triplicate in a 6-well plate coated with Matrigel and allowed to adhere for 6 hours before washing and counting nonadherent cells. Error bars represent SD; P = .004 by Student t test.
Decreased expression of adhesion molecules and other target genes in MMSET knockdown and knockout cells. (A) Quantitative real-time PCR was performed on cDNA prepared from empty vector lentivirus– or MMSET shRNA lentivirus–transduced KMS-11 cells. Expression for each gene was normalized to GAPDH expression levels. Control cell gene expression was set at 100%, and the level in MMSET shRNA cells is expressed relative to controls. SD values are shown. (B) Q-PCR was performed as in panel A using cDNA from KMS-11 cells with disruption of the translocated MMSET allele (T-KO) or a random-integrant control clone. Normalized T-KO gene expression is expressed as a percentage of the expression in the control cells. Error bars represent SD.
Decreased expression of adhesion molecules and other target genes in MMSET knockdown and knockout cells. (A) Quantitative real-time PCR was performed on cDNA prepared from empty vector lentivirus– or MMSET shRNA lentivirus–transduced KMS-11 cells. Expression for each gene was normalized to GAPDH expression levels. Control cell gene expression was set at 100%, and the level in MMSET shRNA cells is expressed relative to controls. SD values are shown. (B) Q-PCR was performed as in panel A using cDNA from KMS-11 cells with disruption of the translocated MMSET allele (T-KO) or a random-integrant control clone. Normalized T-KO gene expression is expressed as a percentage of the expression in the control cells. Error bars represent SD.
We also analyzed the expression of several genes whose expression has been reported to correlate with the t(4;14) in microarray gene expression profiling of primary MM samples, including activated leukocyte cell adhesion molecule (ALCAM), amphiregulin (AREG), nerve growth factor receptor associated protein 1 (NGFRAP1), CDH2, centaurin γ2 (CENTG2), microphthalmia transcription factor (MITF), Kruppel-like factor 4 (KLF4), and Cystatin C (CST3).25,–27 The initiator of DNA binding (ID1) gene, which has been reported as a potential MMSET target gene based on its up-regulation after transient transfection of MMSET I into K562 leukemia cells, was also analyzed.24 KMS-11 cells showed reductions in ALCAM, AREG, NGFRAP1, and CDH2 after MMSET knockdown (Figure 6A). In contrast, we did not find any differential expression of ID1 or several other potential target genes. Comparison of our T-KO cells with control clones also showed similar down-regulation of these same genes, consistent with them being either direct or indirect targets of MMSET (Figure 6B). Non-T-KO cells did not show reduced expression of these transcripts (data not shown).
MMSET knockdown does not alter drug sensitivity of t(4;14) MM cells
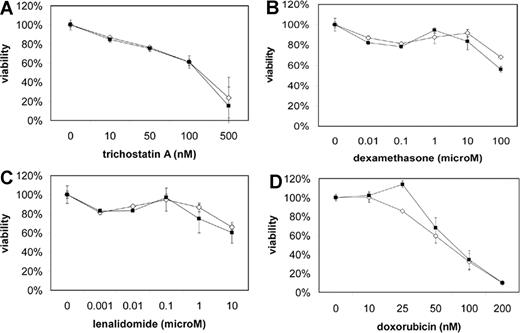
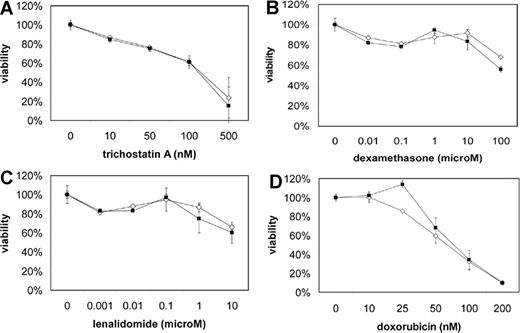
Because patients with the t(4;14) have a short disease-free and overall survival, we examined the effect of MMSET knockdown on the sensitivity of KMS-11 and NCI-H929 cells to a variety of drugs, including dexamethasone, doxorubicin, and lenalidomide, using a MTT viability assay. KMS-11 and NCI-H929 cells were resistant to many of these drugs, but MMSET knockdown did not enhance sensitivity (Figure 7). Interestingly, KMS-11 cells remained quite sensitive to the histone deacetylase (HDAC) inhibitor trichostatin A, despite being resistant to other drugs. Because MMSET has been reported to interact with HDACs, one might have predicted synergy between MMSET knockdown and HDAC inhibition. However, we did not observe any enhanced sensitivity to trichostatin A.
MMSET knockdown does not enhance sensitivity of t(4;14) MM cells to chemotherapy. Empty vector (◇) and MMSET shRNA-transduced (■) KMS-11 (A-C) and NCI-H929 (D) cells were subjected to MTT viability assays using the indicated drug concentrations. Error bars represent SE.
MMSET knockdown does not enhance sensitivity of t(4;14) MM cells to chemotherapy. Empty vector (◇) and MMSET shRNA-transduced (■) KMS-11 (A-C) and NCI-H929 (D) cells were subjected to MTT viability assays using the indicated drug concentrations. Error bars represent SE.
MMSET expression is required for MM tumor growth in vivo
To test the contribution of MMSET expression to the tumorigenicity of KMS-11 cells, stable pools of control and MMSET shRNA-bearing KMS-11 cells were injected subcutaneously in the flanks of athymic nude mice. Control KMS-11 cells formed tumors within 1 week in all cases, whereas MMSET-knockdown cells failed to form tumors in the majority of cases even after 5 weeks after inoculation (Table 2). Gene–targeted KMS-11 clones differed in their tumorigenicity according to which allele was targeted. The non-T-KO clone formed tumors with similar frequency to parental KMS-11 cells, whereas the T-KO clone failed to form tumors (Table 2). We were unable to establish NCI-H929 xenografts using a nude mouse model. However, in preliminary experiments with xenografting NCI-H929 cells into NOD/SCID mice, MMSET knockdown cells formed tumors that were more than 4-fold smaller than control tumors, although the sample size used in these studies was not large enough to statistically assess an effect on tumor frequency. In total, these in vivo studies strongly suggest that MMSET has an important role in the tumorigenicity of multiple myeloma cells.
Discussion
MMSET is implicated in MM pathogenesis by its constant overexpression in t(4;14) MM and its persistent association with a poor prognosis irrespective of FGFR3 expression. However, to date, there has not been any direct evidence that MMSET is a critical gene for either the pathogenesis or maintenance of MM. In the present study, we have demonstrated that t(4;14)–positive MM cells depend on continued MMSET overexpression for their clonogenic growth in semisolid medium, the type of growth most closely linked to the transformed phenotype. In addition, our data suggest that MMSET overexpression resulting from chromosomal translocation dramatically affects the tumorigenicity of MM cells in a xenograft model. These results support a contributing role for MMSET in the translocation (4;14). Interestingly, cells without the t(4;14), including the non-MM cell line Raji, also showed reduced clonogenic growth with MMSET knockdown. This suggests that the MMSET gene may have a more global role in cell growth, adhesion, and tumorigenicity. The fact that knockdown and knockout of MMSET I and II cause a severe growth phenotype suggests that this translocation results in a gain-of-function of one or both of these isoforms. Consistent with this hypothesis, targeted disruption of the translocated MMSET allele reduced MMSET I and II expression by 80% to 90% and generated loss-of-function phenotypes that were not seen with targeting of the nontranslocated allele. Our shRNA constructs do not reduce expression of the C-terminal isoform, REIIBP, and we have thus far been unable to specifically target REIIBP by RNAi. Therefore, our findings do not exclude a possible role for REIIBP in t(4;14) MM. We are currently generating isoform-specific knockouts of MMSET to delineate the contributions of the individual isoforms to MM pathogenesis. Furthermore, our results do not exclude a role for FGFR3 overexpression or activating mutations in FGFR3 in t(4;14) MM.
Reduction of MMSET expression led to a dramatic decrease in the ability of KMS-11 MM cells to adhere to substrate and also led to relative G0/G1 cell-cycle arrest in the adherent cells. Whether this effect on adhesion is related to the loss of clonogenicity and tumor formation is unclear at present. There is a great deal of experimental evidence linking anchorage–independent growth in vitro with tumorigenicity in vivo, although most of the data apply to epithelial or mesenchymal tumors. Nontransformed fibroblasts and epithelial cells undergo cell-cycle arrest and apoptosis on loss of attachment to substrate, and they are incapable of growth in semisolid media. In contrast, MMSET knockdown in KMS-11 cells causes cell-cycle arrest preferentially under adherent growth conditions. In MM, abnormal adhesion to bone marrow stromal cells may play an important role in the proliferation and survival of the malignant clone.28 Indeed, the transcription factor c-maf, which is overexpressed as a result of the t(14;16) in MM, has been linked to myeloma pathogenesis by up-regulating integrin Β7 and increasing adhesion to bone marrow stroma.29,30 It is possible that aberrant up-regulation of adhesion proteins may be a pathogenetic mechanism common to recurrent MM chromosomal translocations. In this light, it is intriguing that several adhesion molecules, including α5 integrin, ALCAM, CDH2/N-cadherin, and CD56/neural cell adhesion molecule, are down-regulated when MMSET expression is reduced. We are currently performing functional studies to determine the role of adhesion proteins in the growth and adhesion phenotypes we have observed in MMSET knockdown cells.
Putative MMSET target genes have been previously identified by transiently transfecting MMSET cDNA into nonmyeloma cell lines and by comparing microarray gene expression profiles between t(4;14)+ and t(4;14)− myeloma cases.24,,–27 The latter approach is likely to miss genes such as CD56, which are commonly expressed in both t(4;14)+ and t(4;14)− cases, whereas the former approach does not recapitulate the context and temporal regulation of MMSET in MM cells. We have shown that several genes whose expression correlates with the presence of the t(4;14) in primary myeloma cells, including AREG, ALCAM, CDH2, and NGFRAP1, are down-regulated by MMSET knockdown and by disruption of the translocated, overexpressed MMSET allele, suggesting that they may be bona fide MMSET target genes. Other genes whose expression correlates with the t(4;14), such as KLF4 and MITF, are unaffected. Some of these genes may be targets of FGFR3 overexpression, as is likely for KLF4.31 MM cell lines with differential allelic knockout of MMSET will provide a useful system to determine the target genes of MMSET overexpression in a biologically relevant manner. Identification of MMSET target genes will guide our understanding of how dysregulation of this gene contributes to this aggressive form of MM and may lead to novel therapeutic approaches for patients with this poor-prognosis translocation.
The online version of this article contains a data supplement.
The publication costs of this article were defrayed in part by page charge payment. Therefore, and solely to indicate this fact, this article is hereby marked “advertisement” in accordance with 18 USC section 1734.
Acknowledgments
This work was supported by the Flight Attendant Medical Research Institute (B.H.P. and J.L.), National Institutes of Health grant NCI CA109274, the Elsa Pardee Foundation, the Summer Running Fund (B.H.P.), the Avon Foundation (B.H.P.), and the Higgins Foundation (R.J.A.). J.L. was the recipient of an American Society of Clinical Oncology Foundation Young Investigator Award.
National Institutes of Health
Authorship
Contribution: J.L. and B.H.P. conceptualized work, analyzed data, and wrote the manuscript; J.L., A.M.A., H.K., J.P. Garay, J.P. Gustin, and Q.W. performed essential laboratory research; and R.J.A. and W.M. provided critical evaluation of the work.
Conflict-of-interest disclosure: The authors declare no competing financial interests.
Correspondence: Josh Lauring or Ben Ho Park, Department of Oncology, Sidney Kimmel Comprehensive Cancer Center, Johns Hopkins University, 1650 Orleans St, Rm 186, Baltimore, MD 21231; e-mail: jlaurin1@jhmi.edu or bpark2@jhmi.edu.

