Abstract
The World Health Organization (WHO) classification contributes to refined classification and prognostication of myelodysplastic syndromes (MDSs). Flow cytometry might add significantly to diagnostic and prognostic criteria. Our analysis of bone marrow samples from 50 patients with MDS showed aberrant expression of differentiation antigens in the myelomonocytic lineage. This also accounted for refractory anemia (RA) with or without ringed sideroblasts (RS), indicating multilineage dysplasia. In 38% of patients, CD34+ myeloid blasts expressed CD5, CD7, or CD56. Flow cytometry data were translated into a numerical MDS flow-score. Flow-scores increased significantly from RA with or without RS, refractory cytopenia with multilineage dysplasia (RCMD) with or without RS up to refractory anemia with excess of blasts-1 (RAEB-1) and RAEB-2. No significant differences were observed between WHO cytogenetic subgroups. Flow-scores were highly heterogeneous within International Prognostic Scoring System (IPSS) subgroups. Patients in progression to advanced MDS or acute myeloid leukemia had a significantly higher flow-score compared with non–transfusion-dependent patients. In 60% of patients with transfusion dependency or progressive disease, myeloid blasts expressed CD7 or CD56, in contrast to only 9% of non–transfusion-dependent patients. Moreover, all patients with pure RA with or without RS with aberrant myeloid blasts showed an adverse clinical course. In conclusion, flow cytometry in MDS identified aberrancies in the myelomonocytic lineage not otherwise determined by cytomorphology. In addition, flow cytometry identified patients at risk for transfusion dependency and/or progressive disease independent of known risk groups, which might have impact on treatment decisions and the prognostic scoring system in the near future.
Introduction
Myelodysplastic syndromes (MDSs) represent a heterogeneous group of myeloid neoplasms characterized by abnormal differentiation and maturation of myeloid cells, bone marrow failure, and a genetic instability with enhanced risk to transform to acute myeloid leukemia (AML).1,2 The substantial differences in clinical behavior of pure refractory anemia (RA) with or without ringed sideroblasts (RS) versus refractory cytopenia with multilineage dysplasia (RCMD) with or without RS and refractory anemia with excess of blasts-1 (RAEB-1) versus RAEB-2 subgroups with distinct treatment options necessitates a clear diagnostic strategy. A considerable difference in overall survival (OS) between patients with RA with or without RS and those with RCMD with or without RS is obvious. Although no significant difference in OS between patients with RCMD and those with RAEB-1 is observed, a significant difference in leukemia-free survival (LFS) could be noticed. In addition, karyotype significantly affects OS in the World Health Organization (WHO) RA with or without RS, RCMD with or without RS, and RAEB-1 subgroups.3,4 Recently, refined definitions and standards in the diagnosis and treatment of MDS were proposed in a report from an international working conference in Vienna convened in 2006.5,6 In the proposed minimal diagnostic criteria, flow cytometric analysis of bone marrow cells in MDS is introduced as a cocriterion in cases where MDS-related (decisive) criteria do not support the diagnosis of MDS
Characterization of normal bone marrow cells by flow cytometry is well established.7 Several reports indicate that characterization of dysplastic cells by flow cytometry in patients with MDS is feasible, and this approach enables the identification of specific aberrancies on both the immature and mature myelomonocytic cells.8-20 However, extensive correlations with clinical parameters are lacking. The current study aimed to investigate aberrancies on progenitor and maturing cells of the myelomonocytic lineage in low- and intermediate-1 (int-1)–risk MDS by 4-color flow cytometry. We showed that flow cytometry might support identification of specific subgroups within well-defined and validated MDS classification systems with varying clinical course. From these data, we hypothesize that the type and/or amount of aberrancies detected by flow cytometry in bone marrow cells in MDS reflects different disease entities with different clinical behavior and prognosis, which might affect treatment strategies in near future. Since new drugs are emerging in low- and int-1–risk MDS, such as lenalidomide, bevacizumab, and drugs interfering with signal transduction pathways (eg, farnesyl transferase inhibitors), a more sophisticated classification method with clinical impact is warranted.
Methods
Patients and control samples
Bone marrow samples were drawn from 50 patients suspected to have MDS. The median age of the patients with MDS at presentation was 68 years (range, 27-88 years). Control normal bone marrow samples were obtained from 15 healthy volunteers and 3 patients undergoing cardiac surgery. The median age of the controls was 59 years (range, 27-83 years). All samples were drawn after informed consent was obtained in accordance with the Declaration of Helsinki. The protocol was approved by the ethical committee at the VU University Medical Center.
Bone marrow morphology and karyotyping in MDS
Cytologic review of all bone marrow aspirates of suspected patients with MDS and normal control bone marrow (May-Grünwald-Giemsa and Perl stain for iron) were evaluated in accordance with WHO criteria by 2 independent hematologists (A.A.v.d.L., G.J.O.), both experienced in MDS diagnosis and classified as RA, refractory anemia with ringed sideroblasts (RARS), RCMD, RCMD-RS, RAEB-1 and RAEB-2, MDS unclassified (MDS-U), hypoplastic MDS, and MDS-myeloproliferative disease (MDS/MPD).21 In case of any in concordance (n = 4), both hematologists reviewed and discussed the final classification according to WHO. Conventional karyotyping and recording was assessed according to the International System for Human Cytogenetic Nomenclature (ISCN).22 By consensus, at least 20 to 25 bone marrow metaphases were examined. In certain cases in which clear-cut demonstration of clonal aberrations were noted, 10 metaphases were considered as sufficient. In those cases where no metaphases could be analyzed, additional fluorescence in situ hybridization (FISH) was performed according to recently published recommendations.5 Such FISH investigations included 5q31, CEP7, 7q31, CEP8, 20q, and CEPY; FISH for p53 was not performed.
Classification of MDS and definitions of transfusion dependency and disease progression
MDS was classified according to WHO.21 Risk assessment was evaluated by the International Prognostic Scoring System (IPSS).23 Cytogenetic subgroups were defined according to WHO.21 The WHO classification–based prognostic scoring system (WPSS) was calculated according to a recent proposal.3,4 Transfusion dependency was evaluated and defined as the requirement of 3 units of packed cells per month for at least a period of 4 months. Disease progression was defined as an increase in WHO subgroup to at least RAEB-1 and/or AML within 18 months after diagnosis of MDS (n = 9; median, 4 months; range, 2-15 months).
Flow cytometric analysis of bone marrow samples
Immunophenotypical analysis was performed using 4-color flow cytometry. A panel of reagents, defined by the Dutch Working Party on Flow Cytometry in MDS, was used to characterize cell populations by flow cytometry (Table 1). Antibodies were selected based on previous studies and recent recommendations by an international study group.5,6,9-13,15-17,19 Monoclonal antibodies used in this study were obtained from the indicated sources: fluorescein isothiocyanate (FITC)–conjugated CD5 (clone DK23) and CD16 (DJ130c) from DakoCytomation (Glostrup, Denmark); fluorescein isothiocyanate (FITC)–conjugated CD7 (M-T701), CD15 (MMA), CD34 (HPCA2), and HLA-DR (L243) from Becton Dickinson ([BD], San Jose, CA); fluorescein isothiocyanate (FITC)–conjugated CD36 (CLB-IVC7) from Sanquin (Amsterdam, the Netherlands); phycoerythrin (PE)–conjugated: CD7 (M-T701), CD11b (D12), CD13 (L138), CD19 (SJ25C1), CD33 (P67.6), CD56 (My31), CD117 (104D2), and CD123 (9F5) from BD; peridinin-chlorophyll protein (PerCP)–conjugated CD45 (2D1) from BD; and allophycocyanin (APC)–conjugated CD11b (D12), CD13 (L138), CD14 (MoP9), CD33 (P67.6), CD34 (HPCA2), and HLA-DR (L243) from BD and allophycocyanin (APC)–conjugated CD117 (104D2) from DakoCytomation.
Analysis was performed on total nucleated bone marrow cells after NH4Cl lysis of erythrocytes. All samples were processed and analyzed within 24 hours. Samples were analyzed using a FACSCalibur (BD); per sample, a minimum of 105 white blood cells was collected. Data were analyzed using Cell Quest software (BD). The different cell compartments (progenitor cells, granulocytes, and monocytes) were identified using CD45 expression and sideward light scatter (SSC). The granulocytic population was identified as CD45dim/bright/SSCint/high; the monocytic population was identified as CD45dim/bright/SSCint/CD14+. Progenitor cells were identified as CD45lowSSClow cells in a CD45/SSC dot-plot and confirmed with a back-gating technique. B-cell progenitors were identified as a cluster that had the lowest SSC and relatively low CD45 expression among CD34+ cells.19 Myeloid progenitor cells were identified by a higher SSC and wider distribution of CD45 expression.
Within each cell compartment, expression of several antigens and phenotypic patterns of maturation were analyzed; results were compared with normal bone marrow samples. Aberrant expression of certain antigens was defined as more than 0.5 log different from normal expression of that specific antigen. Aberrancies in the progenitor cells (blasts), granulocytes, and monocytes were evaluated per subpopulation as listed in Table 2. In Table 3, the presence of single or multiple aberrancies in each individual patient are indicated by lowercase letters (blast, b; granulocyte, g; and monocyte, m) or uppercase letters (B, G, and M), respectively. Wells et al defined a guideline for scoring dysplasia in the myelomonocytic lineage. This guideline was applied to translate our data into a numerical MDS flow-score as summarized in Table 4.12
Statistics
The Mann-Whitney U test was used to compare MDS flow-scores between the MDS subgroups identified by morphology, cytogenetics, IPSS, transfusion dependency, and WPSS. Correlations between variables were examined by Spearman rank order correlation. P values less than .05 were regarded as significant.
Results
Patient characteristics
A total of 50 consecutive patients were referred to the hospital for analysis of a suspected diagnosis of MDS. Patients were classified as RA (n = 8), RARS (n = 5), RCMD (n = 14), RCMD-RS (n = 13), RAEB-1 (n = 3), RAEB-2 (n = 3), MDS-U (n = 2), hypoplastic MDS (n = 1), and MDS/MPD (n = 1). Adequate cytogenetic data and/or FISH analysis were available for 46 patients. Cytogenetics, IPSS, transfusion dependency, disease status, and WPSS are depicted in Table 3.
Flow cytometric evaluation of bone marrow in MDS
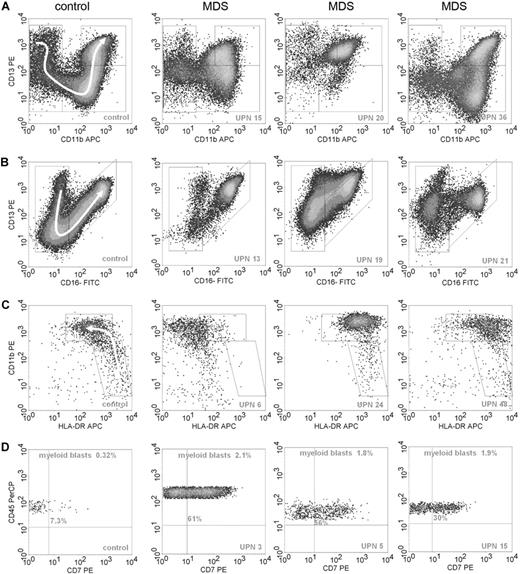
A 4-color flow cytometric procedure was performed that comprised all differentiation stages of granulocytic and monocytic subpopulations, which is instrumental for the recognition of various subpopulations within these compartments in normal bone marrow samples. Some examples of normal and aberrant granulo- and monocytopoiesis are shown in Figure 1. Results for each cell type are summarized in Table 3.
Examples of flow cytometric differentiation patterns for granulocytes and monocytes and lineage infidelity marker expression on myeloid progenitor cells. (A) The relationship between CD11b (x-axis) and CD13 (y-axis) during granulocyte maturation in 1 normal control (left graph) and 3 MDS samples; UPNs correspond to Table 3. Granulocytes were selected by CD45 expression and intermediate to high SSC. A white arrow in the panel of the control sample on the left indicates the development of granulocytes from immature to mature forms. Graphs of patients with MDS demonstrate abnormal maturation or aberrant antigen expression compared with the control sample. (B) The relationship between CD16 (x-axis) and CD13 (y-axis) for granulocytes. Development from immature to mature granulocytes is illustrated by a sickle-shaped white arrow in the graph of the control sample. Graphs of patients with MDS show aberrant antigen expression and maturation compared with the normal control. (C) The relationship between HLA-DR (x-axis) and CD11b (y-axis) during monocyte maturation. Monocytic cells were selected by SSC, CD45, and CD14 expression. A white arrow in the control sample depicts normal maturation of immature blasts toward maturing monocytes. The monocytic subpopulation in the MDS samples either lack expression of HLA-DR or show overexpression of this antigen or overexpression of CD11b. (D) Expression of CD7 (x-axis) on myeloid progenitors, defined by CD45dimSSClow/int and CD34 expression, is depicted. Percentages of myeloid blasts and percentages of CD7+ blasts are indicated in the graphs.
Examples of flow cytometric differentiation patterns for granulocytes and monocytes and lineage infidelity marker expression on myeloid progenitor cells. (A) The relationship between CD11b (x-axis) and CD13 (y-axis) during granulocyte maturation in 1 normal control (left graph) and 3 MDS samples; UPNs correspond to Table 3. Granulocytes were selected by CD45 expression and intermediate to high SSC. A white arrow in the panel of the control sample on the left indicates the development of granulocytes from immature to mature forms. Graphs of patients with MDS demonstrate abnormal maturation or aberrant antigen expression compared with the control sample. (B) The relationship between CD16 (x-axis) and CD13 (y-axis) for granulocytes. Development from immature to mature granulocytes is illustrated by a sickle-shaped white arrow in the graph of the control sample. Graphs of patients with MDS show aberrant antigen expression and maturation compared with the normal control. (C) The relationship between HLA-DR (x-axis) and CD11b (y-axis) during monocyte maturation. Monocytic cells were selected by SSC, CD45, and CD14 expression. A white arrow in the control sample depicts normal maturation of immature blasts toward maturing monocytes. The monocytic subpopulation in the MDS samples either lack expression of HLA-DR or show overexpression of this antigen or overexpression of CD11b. (D) Expression of CD7 (x-axis) on myeloid progenitors, defined by CD45dimSSClow/int and CD34 expression, is depicted. Percentages of myeloid blasts and percentages of CD7+ blasts are indicated in the graphs.
Aberrant immunophenotype of myeloid progenitor cells and decreased lymphoid progenitors in MDS
In 28% of the patients with MDS (14 of 50), the total percentage of progenitor cells was increased compared with that of control bone marrow samples. The median percentage of myeloid progenitor cells, identified as CD45dimSSClow/int cells, was 2.4% in the total group of patients with MDS (range, 0.3%-11%) and 1.2% in the control bone marrow samples (range, 0.7%-2.3%). In the morphologically identified subgroups RCMD with or without RS, RAEB-1, and RAEB-2, the percentage of myeloid progenitor cells was significantly increased compared with that of the healthy controls (P = .004, P = .007, and P = .007, respectively). The percentage of early precursor B cells, identified in the CD45lowSSClow region showing coexpression of CD34 and CD19, was significant lower in the MDS samples compared with the control samples (median, 0.05%; range, 0.01%-0.62% and 0.26%; range, 0.10%-0.62%, respectively; P < .001). Significant decreases in early B-cell progenitors were not only seen in the RCMD with or without RS, RAEB-1, and RAEB-2 subgroups, but in the RA with or without RS subgroup as well (P = .009, P < .001, P < .001, and P = .001, respectively). This resulted in an increased ratio of myeloid versus lymphoid progenitor cells in 39 of the 50 patients with MDS (P < .001 compared with healthy controls).
In AML, the expression of a lineage infidelity marker on myeloid progenitor cells, asynchronous expression, or aberrant expression levels of certain antigens is designated as leukemia-associated phenotype (LAP). Analysis of LAP has been successfully applied to monitor minimal residual disease in AML.6,24 Expression of lineage infidelity markers was also analyzed in the MDS samples. In 38% (19 of 50) of the patients, lineage infidelity marker expression was observed on CD34+ myeloid blasts (Table 3). Expression of either CD7 or CD56 was observed in 9 and 8 patients, respectively; 2 patients showed coexpression of more than 1 lineage infidelity marker (either CD5 and CD7 or CD5 and CD56). In 9 patients, expression of lineage infidelity markers did not coincide with an increased percentage of myeloid progenitor cells. Expression of CD19 on myeloid progenitors was not detected in this group of patients. Other aberrant phenotypes were asynchronous expression of CD11b and low or overexpression of CD34, HLA-DR, CD13, and CD117. Taken as a whole, 28 of 50 patients showed an increased percentage of myeloid progenitors and/or an aberrant immunophenotype of the myeloid progenitors.
Aberrant immunophenotype of granulocytes in most patients with MDS
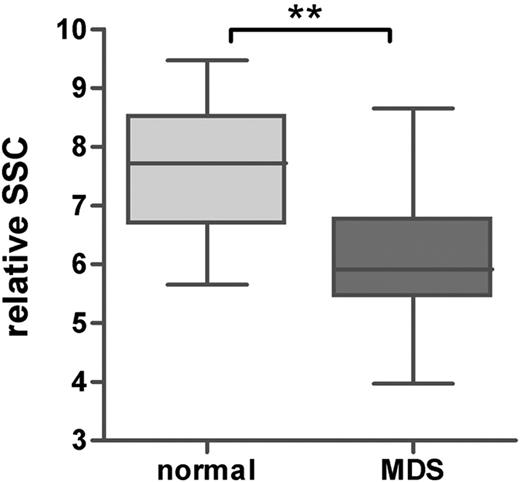
In the patients with MDS, the percentage of maturing myeloid cells, further referred to as granulocytes, was significantly lower compared with that of the healthy controls (median, 66% [range, 8%-89%] and 78% [range, 67%-87%] for patients with MDS and healthy controls, respectively; P < .001). The percentage of granulocytes was decreased in the morphologically identified subgroups RCMD with or without RS, RAEB-1, and RAEB-2 compared with that of healthy controls (P < .001, P = .05, and P = .006, respectively). Although not significant, a trend toward a lower percentage of granulocytes was shown in RA with or without RS (P = .096). Furthermore, the relative SSC of the granulocytes, expressed as ratio to the SSC of the lymphocytes, was significantly lower in all MDS subgroups (P = .002 compared with healthy controls; Figure 2). This indicates that hypogranularity, a cytologic feature of granulocytes in MDS, could be detected by flow cytometry in all morphologic subgroups, including patients with pure unilinage RA with or without RS. It is noted that in RA with or without RS according to the definition in WHO, dysgranulopoiesis may not exceed 10% of granulocytes. Subtle aberrancies detected by flow cytometry may account for the observed decrease in SSC. As can be seen from Table 5, only in 2 patients was the SSC of the total granulocytic subpopulation below the mean minus 2 SD of healthy controls (unique patient no. [UPN] 4 and 11).
Granularity of mature granulocytes in healthy controls and patients with MDS. Granularity was defined as ratio of the SSC of the granulocytes and lymphocytes. Horizontal bars are means, box is 75th percentile, and whiskers are SD. **P < .001 (Mann-Whitney U test).
Granularity of mature granulocytes in healthy controls and patients with MDS. Granularity was defined as ratio of the SSC of the granulocytes and lymphocytes. Horizontal bars are means, box is 75th percentile, and whiskers are SD. **P < .001 (Mann-Whitney U test).
In 14 patients, only a single immunophenotypic abnormality was observed using flow cytometry; 32 patients showed multiple abnormalities. In most patients, abnormal relations between CD13, CD16, CD11b, and CD15 were prominent. A fewer number of patients showed expression of HLA-DR (8 of 50 patients), CD34 (1 of 50 patients), or lineage infidelity markers (CD5, 1 of 50 patients; and CD56, 9 of 50 patients). In most patients, the expression of infidelity markers on the more mature cells was similar to that on the immature CD34+ myeloid progenitors (except for UPN 50). No differences were observed between the number of basophils (CD123+, HLA-DR−, CD45dimSSClow) in the MDS and control samples (P = .846). Eosinophils were not evaluated. Overall, flow cytometry identified aberrancies in granulocytopoiesis in 92% (46 of 50) of the patients with MDS.
Aberrant immunophenotype of monocytes in most patients with MDS
In 40% (20 of 50) of the MDS samples, a striking relative monocytopenia was detected (in relation to the number of lymphocytes; less than mean minus SD of control samples); in 12% (6 of 50) of the patients, a relative monocytosis was observed (more than mean plus 2 SD of controls). Furthermore, the SSC of the monocytes was significantly lower in MDS (expressed as ratio to the lymphocytes: P = .001) compared with healthy controls.
In 14 patients, a single aberrancy was observed, either an abnormal number of monocytes or an aberrant marker expression; in 32 patients, multiple aberrancies were identified. In most patients, abnormal relations between CD14, CD36, CD11b, and HLA-DR were prominent, which indicated aberrant differentiation of monocytes. A fewer number of patients showed expression of CD34 (2 of 50 patients) or lineage infidelity markers (CD5, 1 of 50 patients; CD7, 1 of 50 patients; and CD56, 7 of 50 patients). Expression of CD56 was only scored as aberrant when its intensity exceeded that of CD56 expression as detected on monocytes in some of the normal samples by 1 log. In all but UPN 50, lineage infidelity marker expression on monocytes equaled its expression on the CD34+ myeloid progenitor cells.
Monocytes from 1 patient totally lacked expression of CD14; moreover, granulocytes in this patient were negative for CD16. Both antigens are known to be phosphatidyl inositol–linked proteins that are deficient in paroxysmal nocturnal hemoglobinuria. In this particular patient, the latter diagnosis was excluded by appropriate diagnostic tools. On the whole, flow cytometry identified aberrancies in monocytopoiesis in 92% (46 of 50) of the patients with MDS.
Flow cytometry is more sensitive with respect to analysis of aberrancies than cytomorphology
In most of the 18 normal control bone marrow samples, no flow cytometric aberrancies were present. All control samples showed highly consistent maturation and differentiation patterns. In 4 control samples, monocytopenia was observed. Of these, 3 had no additional aberrancies within this subpopulation; in the other sample, heterogeneous CD13 expression was observed. One control sample showed a heterogeneous CD13 expression on monocytes; in this sample, CD13 was lower on granulocytes as well. In another control sample, a lower CD11b expression was seen on granulocytes. No aberrancies were detected with respect to the myeloid progenitor cells.
In 49 patients with MDS defined by current morphology criteria, aberrant expression of differentiation antigens was demonstrated in 1 or more subpopulations (progenitor cells, granulocytes, and/or monocytes). Multiple aberrancies in different subpopulations were more prominent in RCMD with or without RS (18 of 27 patients) and RAEB-1 and RAEB-2 (6 of 6 patients) compared with that of RA with or without RS (2 of 13 patients). Strikingly, in almost all patients with MDS classified by morphology as RA with or without RS and MDS-U, flow cytometry detected aberrancies in the myelomonocytic lineage. The flow cytometric aberrancies in these distinct subgroups are depicted in Table 5. This is of particular interest, since these cases are characterized morphologically by unilineage dysplasia. Of utmost importance is the detection of CD7 expression on the myeloid progenitor cells in 3 patients with RA and 1 patient with RARS, since CD7 expression on progenitor cells is associated with worse prognosis.10 In all of these patients, blast percentages were within normal range. In 1 patient, monocytes also expressed CD7. One patients with MDS-U also had myeloid blasts within normal range that expressed lineage infidelity markers. In the other patients with MDS-U (UPN 48), no dysplasia was observed by flow cytometry. This patient appeared to have only dysmegakaryopoiesis by morphology, which was not studied by flow cytometry.
In 3 patients classified as RCMD with or without RS, aberrancies were only detected in 1 of the myeloid subpopulations, either the granulocytes or the monocytes. In addition to this, an abnormal low percentage of early B-cell progenitor cells as compared with their myeloid progenitors was observed.
Percentages of progenitor cells as assessed by cytomorphology and flow cytometry correlated significantly (Spearman r = .532; P < .001). The percentage of myeloid progenitors in RCMD with or without RS was increased compared with that of RA with or without RS and normal control bone marrow (median, 1.6%, 2.5%, and 1.2% in RA with or without RS, RCMD with or without RS, and controls, respectively). Although blast counts in these MDS subgroups were within the normal range (cytological criterion, below 5%), flow cytometric aberrancies were detected. The frequency of lineage infidelity marker expression on myeloid blasts in RCMD with or without RS (33%) equaled that in patients with RA with or without RS (31%). Accordingly, a further increased percentage of myeloid blasts were found in RAEB-1 and RAEB-2; lineage infidelity marker expression was seen in 67% of these patients.
The MDS flow-score correlates significantly to WHO subgroups
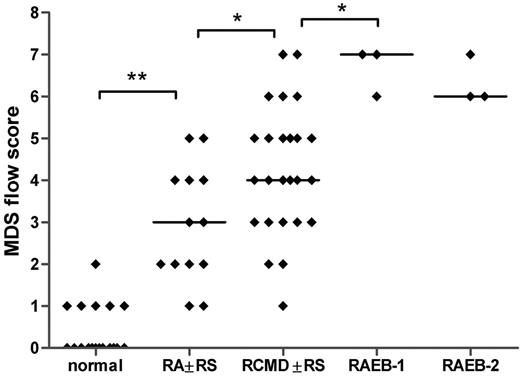
All flow cytometry data of patients with MDS and controls were translated into a numerical MDS flow-score according to the flow cytometric scoring system proposed by Wells et al (Tables 2,Table 3–4).12 The relation between the MDS flow-scores and the different morphologic subgroups is depicted in Figure 3. The median MDS flow-score in RA with or without RS, RCMD with or without RS, RAEB-1, and RAEB-2 is significantly increased compared with the median flow-score of normal bone marrow samples (Spearman r = .813; P < .001). Even though flow-scores are heterogeneous within each subgroup, mean flow-scores between each adjacent subgroup differed significantly, except for RAEB-1 and RAEB-2. Since only a few patients are classified as MDS-U and hypoplastic MDS, no statistical analysis could be performed in these subgroups.
MDS flow-scores in healthy controls and patients with MDS classified by morphology. The MDS flow-score represents the presence of dysplastic features in myeloid blasts, granulocytes, and monocytes as detected by flow cytometry. Flow-scores were calculated according to the scoring system as proposed by Wells et al12 (Tables 2, 4); individual scores for the patients with MDS are depicted in Table 3. Spearman r = .813; P < .001. The few patients that were classified as MDS-U, MDS/MPD, or hypoplastic MDS are not included in this graph. Horizontal bars are medians.*P < .05; **P < .001.
MDS flow-scores in healthy controls and patients with MDS classified by morphology. The MDS flow-score represents the presence of dysplastic features in myeloid blasts, granulocytes, and monocytes as detected by flow cytometry. Flow-scores were calculated according to the scoring system as proposed by Wells et al12 (Tables 2, 4); individual scores for the patients with MDS are depicted in Table 3. Spearman r = .813; P < .001. The few patients that were classified as MDS-U, MDS/MPD, or hypoplastic MDS are not included in this graph. Horizontal bars are medians.*P < .05; **P < .001.
The MDS flow-score is not correlated to WHO cytogenetics
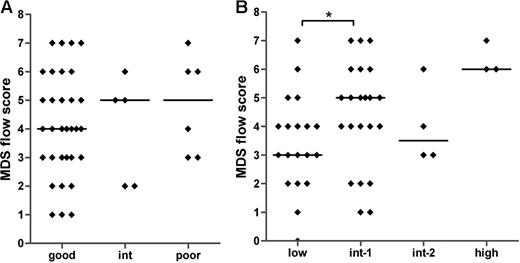
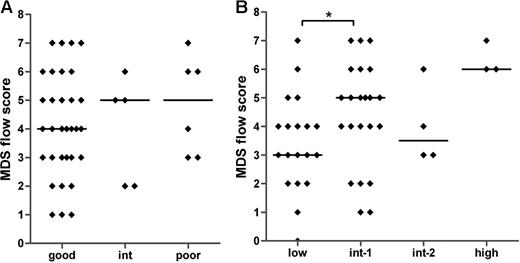
Large variations in the MDS flow-scores are seen within each of the defined cytogenetic and IPSS subgroups (Figure 4A,B). No significant correlation was found between the MDS flow-score and the cytogenetic risk groups (Spearman r = .093; P = .546). A significant difference was observed between the median MDS flow-score of the IPSS low and int-1 groups (P = .042) and between the low and high IPSS subgroups (P = .018). In addition, the MDS flow-score correlates significantly to the IPSS subgroups (Spearman r = .361; P = .01). These data suggest that the MDS flow-score indicates different disease entities within a specific WHO-defined cytogenetic and IPSS subgroup. Therefore, additional clinical data might underscore the role of flow cytometry in MDS.
MDS flow-scores in MDS patients classified by cytogenetics and IPSS. No correlation was detected between MDS flow-scores and cytogenetic risk groups (A). (B) The relationship between the flow-scores and IPSS (Spearman r = .361; P = .01). Horizontal bars are medians. *P < .05 (Mann-Whitney U test).
MDS flow-scores in MDS patients classified by cytogenetics and IPSS. No correlation was detected between MDS flow-scores and cytogenetic risk groups (A). (B) The relationship between the flow-scores and IPSS (Spearman r = .361; P = .01). Horizontal bars are medians. *P < .05 (Mann-Whitney U test).
The MDS flow-score correlates significantly to transfusion dependency, disease progression, and WPSS
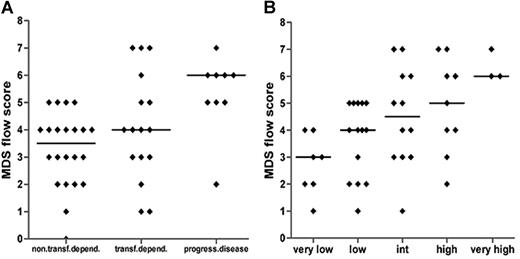
MDS flow-scores are rather heterogeneously distributed within each well-characterized and validated WHO, WHO-cytogenetic, and/or IPSS subgroup. Since these classification systems affect clinical decisions, the MDS flow-score might contribute to a more sophisticated classification with clinical implications. For that reason, patients were grouped according to transfusion dependency or disease progression toward at least RAEB-1 within 18 months. The median MDS flow-score was significantly higher in patients with progression toward high-risk MDS as compared with patients with a low or no transfusion need (P = .001; Figure 5A). A trend toward significance was seen for transfusion dependency versus progressive disease. In accordance with the observations described, a clear increase in the MDS flow-score is observed parallel to an increase in the WPSS score (Figure 5B; Spearman r = .513; P < .001).
MDS flow-scores in relation to clinical parameters. (A) Flow-scores in relation to transfusion dependency (non/low versus dependent) or disease progression toward at least RAEB-1 (Spearman r = .448; P = .002); patients with RAEB-2 were excluded. (B) Patients are subdivided by WPSS. Spearman r = .513; P < .001. Horizontal bars are medians.
MDS flow-scores in relation to clinical parameters. (A) Flow-scores in relation to transfusion dependency (non/low versus dependent) or disease progression toward at least RAEB-1 (Spearman r = .448; P = .002); patients with RAEB-2 were excluded. (B) Patients are subdivided by WPSS. Spearman r = .513; P < .001. Horizontal bars are medians.
Expression of lineage infidelity markers on myeloid progenitors might identify patients with MDS clinically at risk
Most strikingly, in 15 of 25 patients with transfusion dependency and/or in progression to advanced disease stages, lineage infidelity markers were detected on myeloid blasts. In contrast, in only 2 of 22 transfusion-independent patients, lineage infidelity markers were observed on myeloid blasts.
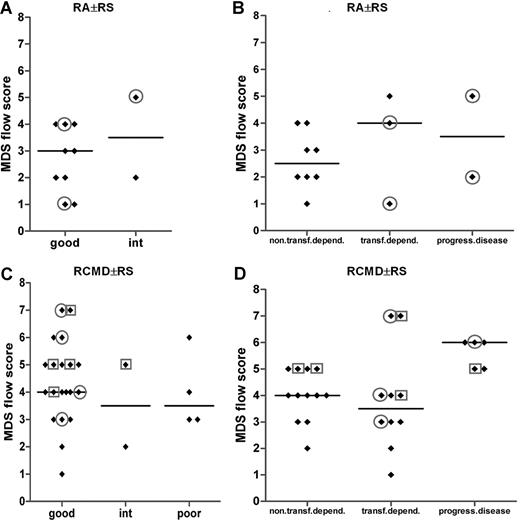
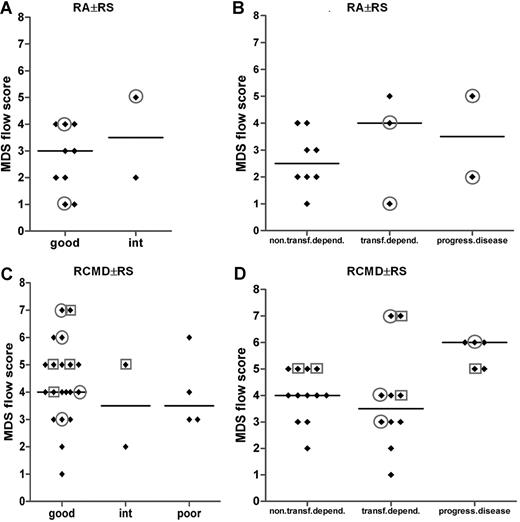
Looking in detail into the RA with or without RS subgroup, the vast majority of these patients with infidelity marker expression on their myeloid blasts (all CD7+) were transfusion dependent, although the MDS flow-score did not significantly differ between both subgroups (Figure 6B). Of the latter patients, 2 belonged to a good cytogenetic risk group, and another patient had an intermediate cytogenetic score (Figure 6A). No cytogenetics was available for the fourth transfusion-dependent patients with RA. A similar observation was made for the good-cytogenetic RCMD with or without RS subgroup; within this particular subgroup, 40% (8 of 20) of the patients showed lineage infidelity marker expression on myeloid blasts (Figure 6C). Almost all of these patients showed transfusion dependency and/or progressive disease (Figure 6D). These data suggest that flow cytometric analysis identifies patients at risk for adverse clinical outcome not recognized by routine and validated risk assessment parameters such as the WHO classification and WHO cytogenetics. A total of 2 patients with infidelity marker–positive blasts were not transfusion dependent; in both patients, blasts expressed CD56.
MDS flow-scores in MDS WHO subgroups RA with or without RS and RCMD with or without RS in combination with cytogenetics and in combination with transfusion dependency or disease progression. (A,B) Results for patients with MDS classified as RA with or without RS. (C,D) Results for patients with MDS classified as for RCMD with or without RS patients. In panels A and C, results are grouped according to cytogenetic risk. Results for 2 patients with RA with or without RS and 1 patient with RCMD case are missing in panel A and panel C, respectively, since no cytogenetics were available in these particular cases. In panels B and D, results are grouped according to transfusion dependency or disease progression. Circles define patients with CD7 expression on their myeloid progenitors; squares define those with CD56 expression. Horizontal bars are medians.
MDS flow-scores in MDS WHO subgroups RA with or without RS and RCMD with or without RS in combination with cytogenetics and in combination with transfusion dependency or disease progression. (A,B) Results for patients with MDS classified as RA with or without RS. (C,D) Results for patients with MDS classified as for RCMD with or without RS patients. In panels A and C, results are grouped according to cytogenetic risk. Results for 2 patients with RA with or without RS and 1 patient with RCMD case are missing in panel A and panel C, respectively, since no cytogenetics were available in these particular cases. In panels B and D, results are grouped according to transfusion dependency or disease progression. Circles define patients with CD7 expression on their myeloid progenitors; squares define those with CD56 expression. Horizontal bars are medians.
MDS flow-scores for 2 of the studied subpopulations individually (ie, monocytes and granulocytes) did not discriminate between WPSS subgroups or clinical course. Only the comparison of the granulocyte flow-scores for the WPSS subgroups “very low” and “high/very high” reached significance (P = .03). If only aberrancies on blasts were taken into account, a significant difference was noted between this isolated MDS flow-score and clinical behavior. (P = .012 and P = .001 for low/no transfusion-dependent versus transfusion-dependent and versus progressive disease; P = .003 and P = .01 for WPSS subgroups very low versus low/int and versus high/very high, respectively; data not shown). The expression of lineage infidelity markers on immature cells appears to be most powerful on identifying specific subgroups of patients at risk that were classified as RA with or without RS, RCMD with or without RS, or MDS-U.
Discussion
Recently, an international working conference on MDS designated flow cytometry as a potential new tool that may add significantly to the diagnosis and prognostication of MDS.5 Hence, flow cytometry is today included as a cocriterion in the diagnosis of MDS.
In this study, we evaluated the application of flow cytometry in MDS and correlated results of flow cytometric analysis to current standards of diagnosis and risk assessment parameters. Bone marrow samples of patients suspected to have MDS and healthy controls were analyzed with a panel of antibodies that comprised all differentiation stages of the myelomonocytic lineage and lineage infidelity markers. Highly consistent differentiation patterns were seen in control samples in concordance with previous reports.5,6,8-13,15-17,19,25 In 49 patients diagnosed with MDS according to the strict WHO criteria (RA with or without RS, RCMD with or without RS, and RAEB-1 and RAEB-2), aberrant expression of differentiation antigens was demonstrated in one or more subpopulations. Multiple aberrancies in different subpopulations were more prominent in RCMD with or without RS and RAEB-1 and RAEB-2 compared with RA with or without RS. Strikingly, in all patients diagnosed with RA with or without RS and 1 patient with MDS-U, flow cytometry identified aberrancies in the myelomonocytic cells; this included lineage infidelity marker expression on myeloid blasts in 33% (5 of 15) of these patients. In these patients, the percentage of myeloid blasts was within normal range. Lineage marker expression on myeloid progenitors in this particular MDS subgroup is in line with a study by Font et al, who reported CD7 expression in 18 of 29 patients with RA with or without RS.20 These observations underscore the concept that MDS is a stem-cell disease.1,2 In addition to aberrancies on myeloid blasts, numerical changes in precursor B cells may also be indicative for MDS.26,27 We could confirm recent observations that a significantly lower percentage of precursor B cells is observed in MDS compared with normal bone marrow samples. The impact of this observation is not yet clear.
Analysis of the more mature myelomonocytic population showed a decrease in the percentage of granulocytes and monocytes with a significantly lower SSC, reflecting loss of granularity, compared with normal control bone marrow. This implies that flow cytometry enables us to quantify and qualify these hallmarks of MDS. Furthermore, the quantification and scoring of dysplasia within the monocytic compartment is, in general, not possible in dysplastic bone marrow by cytology.
Even though cytomorphology is still the mainstay in the classification of MDS, it cannot detect subtle abnormalities; flow cytometry may add significantly. This is of particular interest since it suggests that flow cytometry may reclassify patients with RA with or without RS or MDS-U according to WHO to RCMD with or without RS by flow cytometry. Whether or not these former subgroups with multilineage dysplasia by flow cytometry represent a distinct subgroup will be investigated in a currently designed prospective study within the Dutch Hemato-Oncology Collaborative group (HOVON).
According to the recently defined minimal criteria for diagnosing MDS, patients with unilineage dysplasia should be classified as RA with or without RS or MDS-U. Patients with pure RA with or without RS show a favorable clinical course compared with patients with multilineage dysplasia.3,4
Interestingly, we demonstrated that patients with pure RA with or without RS according to WHO with expression of lineage infidelity markers on immature myeloid blasts had an adverse clinical outcome. This might indicate the existence of a distinct subgroup within the WHO-defined RA with or without RS. From our data, it can be argued that only those patients without multilineage aberrancies by flow cytometry should be classified as RA with or without RS and MDS-U.
Patients with a type of cytopenia (transfusion-dependent macrocytic anemia) that may point to MDS or a MDS prephase, but who do not meet the minimal diagnostic criteria for MDS, may be defined as idiopathic cytopenia of undetermined significance (ICUS).5,28 Also, in these patients, flow cytometry is proposed to contribute to the diagnosis of either ICUS (without flow cytometric aberrancies) or early MDS (with additional flow cytometric aberrancies).28
Cellular abnormalities as detected by flow cytometry are not necessarily specific for MDS, but provide evidence of dysplastic maturation supplementary to that provided by morphology. Stetler-Stevenson hypothesized that 2 or more aberrancies per subpopulation are specific for MDS.9 Multilineage dysplasia has also been observed, for example, in malnutrition, multiorgan failure, cytotoxic or immunosuppressive drugs, alcohol abuse, and vitamin B12 or folic acid deficiency.29,30 Nevertheless, several groups report strong concordance of flow cytometrically identified abnormalities with morphologic features, cytogenetics, and IPSS.9,11,17,31
In accordance with previous reports, the frequency of lineage infidelity marker expression on immature myeloid blasts was associated with an increase in the percentage of myeloid blasts and also with more advanced stages of the disease, including RCMD with or without RS, reflecting probably a more leukemic phenotype.32 This supports the data from Malcovati et al, in which a significant decrease in overall survival and leukemia-free survival is noted from RA with or without RS toward RCMD with or without RS.17 Prospective studies are ongoing to define which or which combination of lineage infidelity markers may have prognostic impact. A strong association has already been reported between the expression of CD7 and unfavorable cytogenetics.33,34 CD7 is reported to be more prevalent on blast cells in high-risk MDS, whereas CD10 and CD15 were more prevalent in low-risk MDS; CD15 expression defined a group of patients with better prognosis than CD7 expression.10 Recently, Font et al showed a significant correlation between the expression of CD7 (and/or TdT) and FAB classification or IPSS.20 CD7 is even stated to be an independent marker for prognosis in MDS, as it is significantly associated with short overall survival and transformation-free survival.10 Several of the patients in our patient group with good-risk cytogenetics showed CD7 expression on their myeloid blasts. This might indicate a worse prognosis. Upon evaluation of the clinical data, these patients were indeed assigned to the transfusion-dependent or even the progressive disease subgroup and had higher WPSS scores. The prognostic value of the aberrant expression of CD56 on myeloid blasts is not yet known.
Recently, it was shown that the total number of flow cytometric aberrancies per patient correlated to WPSS.25 To be able to identify specific and combination of aberrancies detected by flow cytometry in all bone marrow compartments, we applied the MDS flow scoring system as proposed by Wells et al.12 This scoring system does not sum up all aberrancies separately, but categorizes them. In this way, the obtained MDS flow-score enabled us to correlate flow cytometric data with validated classifying and prognostic parameters in MDS such as the WHO proposal for diagnosis, IPSS, and WPSS.3,4,21,23 As expected, an increase in the MDS flow-score paralleled the subgroups RA with or without RS and RCMD with or without RS toward RAEB-1 and RAEB-2. A large heterogeneity exists with respect to the level of the MDS flow-score. This is most prominent in the validated prognostic scoring systems (IPSS), including WHO cytogenetic risk groups. No significant differences could be observed between the MDS flow-score and the 3 cytogenetic subgroups. Although a significant difference between the MDS flow-score and the low- and int-1–risk IPSS subgroups could be observed, the huge heterogeneity of the flow-score within each subgroup suggests different disease entities and with potential different disease outcomes. This hypothesis was evaluated by correlating the dysplasia score with clinical parameters such as leukemic evolution and transfusion dependency. Patients with high transfusion requirements and/or with progressive disease to either a more advanced stage of MDS (at least RAEB-1) within 18 months after diagnosis showed a significant higher MDS flow-score at diagnosis. In addition, the presence of a lineage infidelity marker on immature bone marrow cells identifies patients with high transfusion requirements and/or progressive disease. Within the RA with or without RS and to a lesser extent in patients with RCMD with or without RS, the presence of infidelity marker expression on bone marrow cells discriminates patients with no/low or high transfusion requirements. The MDS flow-score correlated highly significantly with the WPSS. These data indicate that the MDS flow-score and/or the expression of infidelity markers on immature bone marrow cells in MDS might be of particular importance in identifying prognostic subgroups. This is of particular interest since new drugs for low- and int-1–risk MDS are now available (eg, lenalidomide). Since a huge heterogeneity in the MDS flow-score exists within a specific subgroup with overlap in adjacent subgroups, the impact of the MDS flow-score and/or specific flow aberrancy (eg, lineage infidelity marker expression) will be addressed in a prospective clinical trial within HOVON.
In conclusion, our data provide evidence that flow cytometry identifies patients with aberrancies in the myelomonocytic lineage although classified as unilineage RA with or without RS by morphology. Flow cytometric analysis identifies patients with a distinct clinical course not otherwise determined by classical prognostic scoring systems. These observations may be instrumental in defining new MDS subgroups and designing prognostic scoring systems with consequences on treatment decisions in near future.
The publication costs of this article were defrayed in part by page charge payment. Therefore, and solely to indicate this fact, this article is hereby marked “advertisement” in accordance with 18 USC section 1734.
Acknowledgments
The authors thank Corien Eeltink for sample logistics and Linda van Dreunen for technical assistance. Drs Denise Wells and Michael Loken are acknowledged for fruitful discussions.
This work was supported by the Myelodysplastic Syndrome Foundation through a Young Investigators grant 2007-2008.
Authorship
Contribution: A.A.v.d.L. designed the research, performed morphologic analysis, analyzed clinical data, and wrote the paper; T.M.W. performed flow cytometric analysis, analyzed data, and cowrote the paper; A.H.W. performed flow cytometric analysis and discussed results; A.M.D. and V.H.J.v.d.V. discussed results; and G.J.O. performed morphologic analysis and discussed results.
Conflict-of-interest disclosure: The authors declare no competing financial interests.
Correspondence: A. A. van de Loosdrecht, Department of Hematology, VU Institute of Cancer and Immunology (V-ICI), Cancer Center Amsterdam (CCA), De Boelelaan 1117, 1081 HV Amsterdam, the Netherlands; e-mail: a.vandeloosdrecht@vumc.nl.
References
Author notes
A.A.v.d.L. and T.M.W. contributed equally to this work.


