Abstract
To characterize the biology and optimal therapy of acute mixed-lineage leukemia in children, we reviewed the pathologic and clinical features, including response to therapy, of 35 patients with mixed-lineage leukemia. The majority of cases (91%) had blasts cells that simultaneously expressed either T-lineage plus myeloid markers (T/myeloid, n = 20) or B-lineage plus myeloid markers (B/myeloid, n = 12). Overall survival rates for the B/myeloid and T/myeloid subgroups were not significantly different from each other or from the rate for acute myeloid leukemia (AML) but were inferior to the outcome in children with acute lymphoblastic leukemia (ALL). Patients who failed to achieve complete remission with AML-directed therapy could often be induced with a regimen of prednisone, vincristine, and L-asparaginase. Analysis of gene-expression patterns identified a subset of biphenotypic leukemias that did not cluster with T-cell ALL, B-progenitor ALL, or AML. We propose that treatment for biphenotypic leukemia begin with one course of AML-type induction therapy, with a provision for a switch to lymphoid-type induction therapy with a glucocorticoid, vincristine, and L-asparaginase if the patient responds poorly. We also suggest that hematopoietic stem cell transplantation is often not required for cure of these patients.
Introduction
Leukemic blasts from patients with acute lymphoblastic leukemia (ALL) and acute myeloid leukemia (AML) commonly express cell markers of more than one lineage while retaining characteristics that demonstrate a strong commitment to a single lineage. Acute leukemias with this type of aberrant antigen expression include cases of ALL that express myeloid-associated antigens (My+ ALL) and cases of AML that express lymphoid-associated antigens (Ly+ AML). Large studies of patients with My+ ALL and Ly+ AML have demonstrated that lineage infidelity does not have prognostic significance.1-8
By contrast, mixed-lineage acute leukemias (or acute leukemias of ambiguous lineage) represent a heterogeneous category of rare, poorly differentiated acute leukemias that possess characteristics of both lymphoid and myeloid precursor cells.3,9-16 These divergent morphologic and immunophenotypic features may be uniformly present in one blast population (biphenotypic leukemia) or may be seen on distinct blast populations in a single patient (bilineal leukemia). Leukemias that switch their lineage of origin during therapy or show poorly differentiated or undifferentiated features are also included in this category. Mixed-lineage leukemias should therefore be distinguished from cases of ALL or AML that demonstrate expression of a few myeloid-associated or lymphoid-association antigens, respectively. Numerical scoring criteria have been generated for the immunophenotypic diagnosis of biphenotypic leukemias to aid in this distinction.10,11 There are no well-defined quantitative cutoff points for the diagnosis of the less common acute bilineal leukemias.
As mixed-lineage leukemias represent only 3% to 5% of acute leukemias occurring in patients of all ages and comprise several different subtypes (biphenotypic, bilineal, and lineage switch), the optimal therapeutic approach to these cases, especially in pediatric patients, has not been defined. For example, it is still unclear whether patients with biphenotypic leukemia fare batter on induction regimens designed for ALL or AML, or whether biphenotypic and bilineal leukemias respond similarly. This question assumes increased importance in light of several reports suggesting that patients with biphenotypic leukemia have poor treatment outcomes.17-21 Another unresolved issue is whether the immunophenotypic characteristics or gene-expression patterns of mixed-lineage leukemia might differ sufficiently among themselves and from those of typical ALL and AML to warrant consideration of a distinct leukemia subtype. Here we assess the clinical and laboratory findings in 35 consecutive cases of pediatric mixed-lineage leukemia that were diagnosed and treated over 2 decades. We also analyzed the gene-expression profiles for a subset of cases to gain insight into the molecular pathogenesis of these unusual cases.
Methods
Patients
Thirty-five patients with mixed-lineage leukemia were identified by database review of all patients with acute leukemia treated at St Jude Children's Research Hospital from 1985 to 2006. Their initial treatment followed institutional protocols or treatment plans for AML (n = 23) or ALL (n = 12).22-26 Additional therapy was selected by the primary oncologist on a patient-to-patient basis. Diagnostic microarray gene-expression profiles were available for 13 of mixed-lineage leukemia cases in this study and were compared with corresponding profiles for 106 B-progenitor ALL, 15 T-cell ALL (T-ALL), and 105 AML patients. To evaluate the prognosis of the 32 patients with biphenotypic leukemia, we compared their overall survival rates with that of 1527 ALL patients and 328 AML patients treated on St Jude protocols from 1985 to 2006.22,27 All therapeutic studies were approved by the St Jude Institutional Review Board.
Flow cytometric (immunophenotypic) analysis and diagnostic criteria
Flow cytometric analysis (3- or 4-color) was performed on blast cell populations identified by CD45 versus light side-scatter properties, using Becton Dickinson FACSCalibur instruments (1990 to 2006 models; BD Biosciences, San Jose, CA) and standard staining and analytic methods. All cases were characterized with a panel of antibodies to leukocyte-associated markers, including surface CD1a, CD2, CD3, CD4, CD5, CD7, CD8, CD9, CD10, CD11b, CD11c, CD13, CD14, CD15, CD16, CD19, CD20, CD21, CD22, CD24, CD33, CD34, CD36, CD41a, CD42b, CD45, CD45RO, CD56, CD57, CD61, CD64, CD65, CD66c, CD71, CD117, CD133, cytoplasmic CD3, CD79a, myeloperoxidase (MPO), terminal deoxynucleotidyl transferase (TdT), and surface and cytoplasmic immunoglobulins μ, κ, and λ. A marker was considered positive by this method when 10% or more of the blasts reacted with antibodies to that marker with a definite intensity shift greater than a corresponding negative control.
All cases diagnosed as acute biphenotypic leukemias or acute bilineal leukemia fulfilled criteria of the European Group for the Immunological Characterization of Leukemias and World Health Organization classifications systems.9-11 Cases excluded from this category in our retrospective search lacked coexpression of MPO and cytoplasmic CD3 or CD79a and were classified as AML or ALL. In 5 cases (cases 13, 18, 19, 26, and 31), the available morphologic and immunophenotypic information was highly suggestive of acute biphenotypic leukemia, but the numbers of markers analyzed were not sufficient because of the diagnostic era to permit a definitive contemporary classification as acute mixed-lineage leukemias. Nevertheless, because of their coexpression of several T/lymphoid (CD2, CD7, TdT, or CD10) and myeloid antigens, the dimorphic (lymphoid and myeloid) appearance of the blasts, and their response to a combination of myeloid and lymphoid therapies, they were considered relevant to this study and were included as acute biphenotypic leukemias.
Cytogenetics
Cytogenetic analysis was performed on direct preparations or overnight-unstimulated cultures of bone marrow and tissue samples, followed by banding with Wright-trypsin stain, as previously described.28
Gene-expression analysis
Gene expression was measured with the Affymetrix U133 array (Affymetrix, Santa Clara, CA). Laboratory procedures for RNA extraction and microarray handling are described elsewhere.29,30 The MAS 5.0 algorithm (Affymetrix 2002) was used to determine expression signals. The Wilcoxon rank-sum test31 was used to select probe sets with expression patterns that significantly distinguish B-progenitor ALL from AML and T-ALL, T-ALL from B-progenitor ALL and AML, and AML from B-progenitor ALL and T-ALL. The robust method32 was used to estimate the false discovery rate for each set of rank-sum comparisons. Principal components analysis was applied to the selected probe expression data for the AML, T-ALL, and B-progenitor ALL cases, and the results were used to visualize the distributions of all cases with respect to the expression of the selected probe sets. Microarray data have been deposited with Gene Expression Omnibus33 under accession number GSE14286.
Statistical methods
The Kaplan-Meier method34 was used to estimate the probability of overall survival; SEs were determined by the method of Peto et al.35 Survival comparisons were performed with a Monte Carlo approximation (10 000 permutations) of the exact log-rank test. Survival analyses were performed with SAS software (SAS Institute, Cary, NC), Windows version 9.1, and StatXact Windows version 7.1 (Cytel, Cambridge, MA). Gene-expression analyses were performed with S-plus software Windows version 7.0 (Insightful, Seattle, WA).
Results
Pathologic features
These 35 cases were morphologically heterogeneous. Distinct dimorphic lymphoid and myeloid or monocytic blast populations were present in both cases of bilineal leukemia (cases 33 and 34), as well as in 14 of the cases of biphenotypic leukemia (cases 2-7, 9, 17, 19, 23-25, and 29-31), in which cytochemical MPO expression was either detected in both blast populations or limited to the myeloid-appearing blasts. The remaining cases had morphologic and cytochemical features of AML (French-American-British AML M1 or M2 subtypes in cases 1, 3,13, 15,18, 26, and 27), acute lymphoblastic leukemia (French-American-British ALL L1 subtype in cases 8, 10, 11, 28, and 32), mixed ALL L1 and L3 subtypes with cytochemical MPO expression in the latter subset (case 12), and large, myeloid-type blasts with moderate amounts of cytoplasm and prominent nucleoli (cases 14, 16, 20-22, and 35). Myelodysplasia was apparent in case 14.
The immunophenotypic features of all cases are summarized in Table 1. Immunophenotyping identified 2 cases with B, T, and myeloid markers, 10 with B and myeloid markers, and 20 with T and myeloid markers. Case 28 was initially diagnosed with T-cell ALL but, at the time of relapse, was found to have biphenotypic leukemia with T and myeloid markers. In addition, 2 cases had distinct lymphoid and myeloid blast populations and were classified as bilineal, whereas a single case was classified as undifferentiated. All but 3 cases demonstrated MPO positivity by cytochemical staining, with a median of 3% positive cells (range, 1%-90%), whereas 9 cases had Auer rods.
Cytogenetic abnormalities
Among the 33 cases with successful cytogenetic studies, 29 had abnormal karyotypes (Table 2). There were no recurring cytogenetic abnormalities, although cases 4, 33, 34, and 35 had MLL gene rearrangements. Of note, 9 cases had abnormalities of chromosomes 5 or 7, 6 cases had 12p abnormalities, and 4 cases had extra 1q material.
Gene expression
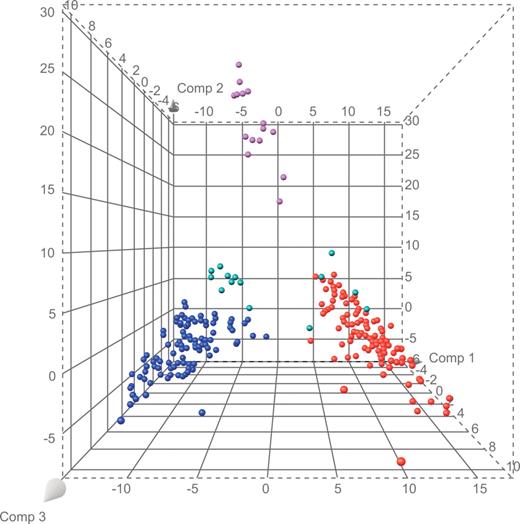
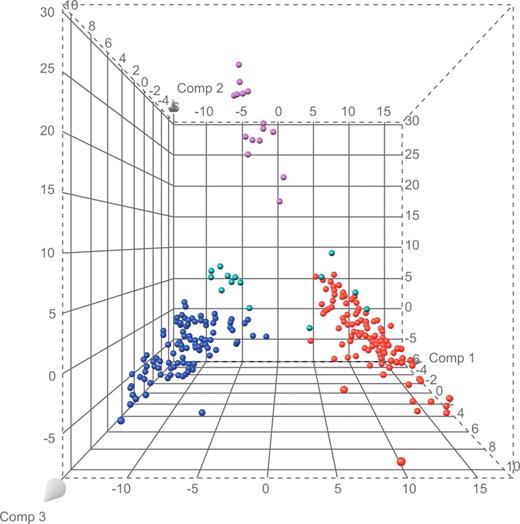
We used a gene-expression database of 226 cases of acute leukemia with definitive diagnoses (106 B-progenitor ALL, 15 T-ALL, and 105 AML cases) to select the 100 probe sets that best distinguished each lineage from the other lineages of interest, yielding a list of 284 unique probe sets (Table S1, available on the Blood website; see the Supplemental Materials link at the top of the online article). The results of principal component analysis, applied to probe set data for the B-progenitor ALL, T-ALL, and AML cases, were used to visually compare the extent of separation among cases (Figure 1; Table S2). We observed that 5 (cases 18, 21, 26, 31, and 33) of the 13 mixed-lineage cases with available microarray data clustered with known AML cases, whereas the remaining 8 (cases 4, 6, 11, 15, 16, 20, 25, and 28) formed a highly distinct cluster with few similarities to known cases of AML, T-ALL, and B-progenitor ALL (Figure 1).
Principal components plot based on 284 lineage-distinguishing probe sets. Purple spheres represent cases of T-ALL; blue spheres, B-progenitor ALL; red spheres, AML; and green spheres, mixed lineage leukemia.
Principal components plot based on 284 lineage-distinguishing probe sets. Purple spheres represent cases of T-ALL; blue spheres, B-progenitor ALL; red spheres, AML; and green spheres, mixed lineage leukemia.
Clinical features, treatment, and outcome
The 35 patients (21 boys and 14 girls) in this study had a median age of 10 years (range, 2 days to 19 years) and a median leukocyte count at diagnosis of 18 × 109/L (range, 1-150 × 109/L; Table 3). Twenty-three patients initially received standard induction therapy for AML, generally with cytarabine, daunomycin, and etoposide, whereas 12 patients received induction therapy for ALL, with prednisone, L-asparaginase, daunorubicin, and vincristine (Table 3). In the subgroup of 23 patients initially given AML therapy, 12 (52%) achieved complete remission (CR), 2 attained partial remission (PR), 8 had no response, and 1 died of toxicity. By contrast, of the 12 patients who first received ALL therapy, 10 (83%) achieved CR and 2 had no response. Overall, 22 of the 35 (63%) patients entered CR after their initial induction therapy, with 10 remaining in remission after treatment for AML (5 of 12) or ALL (5 of 10).
Interestingly, 8 of the 10 patients who failed to respond or had only a PR to AML therapy attained a CR after receiving standard ALL induction therapy consisting only of prednisone, vincristine, and L-asparaginase. Six of these patients had a mixed T/myeloid phenotype with expression of CD2, CD7, cytoplasmic CD3, and MPO. All 4 patients who were tested for minimal residual disease after lymphoid-directed induction therapy were minimal residual disease-negative. Moreover, 7 of the 8 patients are alive and in long-term remission after further chemotherapy, whereas 1 died of toxicity after receiving a hematopoietic stem cell transplant. Both of the patients who were unresponsive to induction therapy for ALL entered at least partial remission (1 PR, 1 CR) after a switch to AML-directed therapy but later died of toxicity or relapse. Thus, approximately half (17 of 35) of our patients with mixed-lineage leukemia achieved long-term remissions.
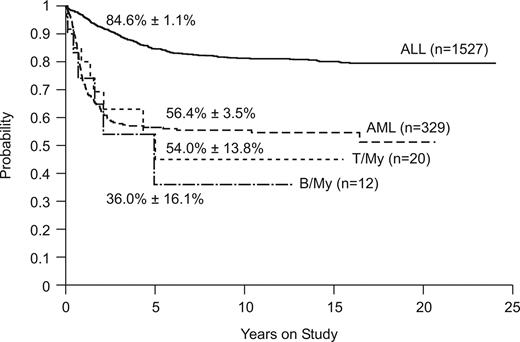
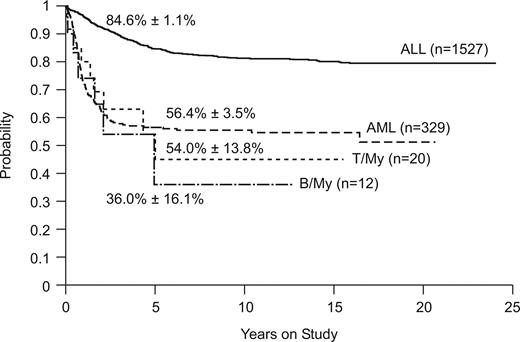
Figure 2 compares the overall survival rates among patients with B/myeloid or T/myeloid biphenotypic leukemia and those with ALL or AML diagnosed by standard criteria. Outcomes were similar for the 2 subgroups of biphenotypic leukemia (5-year survival estimates, 36.0% ± 16.6% vs 54.0% ± 13.8%, P = .67). The outcome of patients with B/myeloid or T/myeloid biphenotypic leukemia (5-year survival estimate, 47.8% ± 11.5%) was similar to that of patients with AML (n = 329, 5-year survival estimate, 56.5% ± 3.5%, P = .64) treated at St Jude Children's Research Hospital during the same time period (Figure 2). As expected, patients with ALL (n = 1527; 5-year survival estimate, 84.6% ± 1.1%) fared significantly better than either the T/myeloid or B/myeloid subgroups (P < .001).
Kaplan-Meier plot of overall survival for patients with ALL, AML, T/myeloid, and B/myeloid biphenotypic leukemia. Five-year survival estimates are shown.
Kaplan-Meier plot of overall survival for patients with ALL, AML, T/myeloid, and B/myeloid biphenotypic leukemia. Five-year survival estimates are shown.
There were no apparent associations between gene-expression patterns and clinical features. The 5 cases that clustered with AML cases included 4 T/myeloid biphenotypic cases and 1 B/myeloid bilineal case. Despite clustering with AML, 3 of these 5 cases had no response to AML-directed therapy. The 8 cases that formed a distinct cluster (Figure 1) included 3 B/myeloid and 5 T/myeloid biphenotypic cases. Of these, 3 achieved CR after AML-directed therapy and the other 5 achieved CR after ALL-directed therapy.
Discussion
Mixed-lineage leukemia is a rare disease entity that must be distinguished from ALL with atypical myeloid antigen expression and AML with atypical lymphoid expression.11 Biphenotypic leukemia comprises the largest subset of cases within this general category and may be associated with a poor prognosis.17-21 In a study of adults with acute leukemia, biphenotypic disease represented 8% of cases and conferred a poor prognosis, with a 4-year survival rate of only 8%.18 Killick et al20 described 20 patients with biphenotypic leukemia (8 children and 12 adults) among nearly 700 patients treated at their center. Overall, CR was achieved in 70% of patients, but the probability of survival at 2 years was only 39%. However, all 8 children with this type of leukemia achieved CR (5 after ALL induction, 2 after AML induction, and 1 after a switch to AML induction after a poor response to ALL induction). Six of these patients remained alive and in remission at 2 years of follow-up. The authors suggest that the prognosis associated with biphenotypic leukemia in children may not differ from that typically reported for childhood acute leukemia. A study of adults with ALL who were treated on the Leucemie Aigue Lymphoblastique de l'Adulte (LALA) 94 ALL protocol identified 7 patients (0.86%) with biphenotypic leukemias that expressed T-lymphoid and myeloid markers.17 Only 2 of 7 patients entered CR after ALL induction therapy, but 4 of the other 5 attained CR after receiving AML therapy. Investigators from the M. D. Anderson Cancer Center reported that, among 31 adult patients with biphenotypic leukemia, CR rates were 78% for patients who received lymphoid-directed therapy and 57% for those who received myeloid therapy, whereas the overall survival at 2 years was 60%.21 Acute bilineal leukemia appears to be even less common than biphenotypic leukemia, comprising approximately 1% of cases in a recent study of both adult and pediatric cases, in which CR was induced in only 6 of 16 patients, 2 of whom achieved sustained remissions.16
We studied 35 pediatric patients with mixed-lineage leukemia treated at this center over the past 20 years (∼ 2% of all cases of leukemia). Overall, 32 patients (91%) achieved CR, with 17 (49%) remaining leukemia-free survivors. Because of the small number of patients and the heterogeneity of their clinical characteristics, immunophenotypes, and treatment regimens, we are unable to make firm recommendations regarding remission induction treatment. However, it is important that 8 of 10 patients who failed to respond to intensive AML induction therapy subsequently achieved remission after treatment with prednisone, vincristine, and L-asparaginase, and all but 1 are long-term survivors after receiving 120 weeks of rotational maintenance therapy that includes both myeloid- and lymphoid-directed components, confirming our early observation.3 More than half (60%) of these patients had T/myeloid biphenotypic leukemia with expression of CD2, CD7, cytoplasmic CD3, and low MPO positivity, with or without Auer rods. These results, and the difficulty of predicting whether patients with mixed-lineage leukemia will respond better to ALL- or AML-type therapy, had led us to revise our treatment strategy. We now enroll both T/myeloid and B/myeloid patients in our frontline AML clinical trial. Patients who do not respond to the first course of AML-directed therapy are switched to ALL-type induction (prednisone, L-asparaginase, and vincristine) and consolidation (high-dose methotrexate and mercaptopurine), followed by maintenance treatment with rotational drug combinations that include etoposide/cyclophosphamide, methotrexate/mercaptopurine, methotrexate/L-asparaginase, and dexamethasone/vincristine/doxorubicin. Although patient numbers are small and follow-up times are short, this strategy appears to be promising. An alternative approach to induction therapy, which we have not yet tested, is to administer an induction regimen that consists of both lymphoid-directed agents (prednisone, vincristine, and L-asparaginase) and myeloid-directed therapy (high-dose cytarabine, etoposide, and daunorubicin). We suggest that hematopoietic stem cell transplantation may not be required to secure long-term remissions in patients with biphenotypic leukemia, especially those who attain a molecular or immunologic remission (< 0.01% blast cells) after induction therapy. However, we do recommend hematopoietic stem cell transplantation for patients with greater than 1% blasts by flow cytometry at the end of induction. The optimal therapy for patients with low levels of disease (0.01%-1%) is uncertain.
Analysis of gene-expression patterns, available for 13 of our biphenotypic cases, suggested that a significant subset of these leukemias may represent a biologically unique entity. Indeed, we identified 8 cases whose gene-expression patterns provide a clear demarcation from B-progenitor ALL, T-ALL, and AML. If this relationship can be established in an independent cohort of patients, it may be possible to correlate the new entity with clinical features or prognosis, to identify novel mechanisms of pathogenesis, or to identify therapeutic targets.
An Inside Blood analysis of this article appears at the front of this issue.
The online version of this article contains a data supplement.
The publication costs of this article were defrayed in part by page charge payment. Therefore, and solely to indicate this fact, this article is hereby marked “advertisement” in accordance with 18 USC section 1734.
Acknowledgments
The authors thank John Gilbert for expert editorial review and Ramona Ratliff for assistance with data collection.
This work was supported in part by the National Institutes of Health (Cancer Center Support grant P30 CA-21765), the State of Tennessee (Center of Excellence grant), and the American Lebanese Syrian Associated Charities. C.-H.P. is an American Cancer Society Professor.
National Institutes of Health
Authorship
Contribution: J.E.R. designed and performed research; collected, analyzed, and interpreted data; and wrote the manuscript; M.O. and F.G.B. performed flow cytometric analysis and pathologic analysis; S.P. and X.C. performed statistical analyses; D.C. performed minimal residual disease studies; S.S. and J.R.D. performed and analyzed gene-expression studies; S.C.R. performed cytogenetic analyses; and B.I.R., R.C.R., and C.-H.P. interpreted data. All authors critically reviewed and approved the manuscript.
Conflict-of-interest disclosure: The authors declare no competing financial interests.
Correspondence: Jeffrey E. Rubnitz, Department of Oncology, St Jude Children's Research Hospital, 332 N Lauderdale St, Memphis, TN 38105-2794; e-mail: jeffrey.rubnitz@stjude.org.
References
Author notes
*J.E.R. and M.O. contributed equally to this work.


