Abstract
MLL5 is a divergent member of the Drosophila Trithorax-related (SET) domain and plant homeodomain (PHD) domain-containing chromatin regulators that are involved in the regulation of transcriptional “memory” during differentiation. Human MLL5 is located on chromosome 7q22, which frequently is deleted in myeloid leukemias, suggesting a possible role in hemopoiesis. To address this question, we generated a loss-of-function allele (Mll5tm1Apa) in the murine Mll5 locus. Unlike other Mll genes, Mll5tm1Apa homozygous mice are viable but display defects in immunity and hematopoiesis. First, Mll5tm1Apa homozygous mice show increased susceptibility to spontaneous eye infections, associated with a cell-autonomous impairment of neutrophil function. Second, Mll5tm1Apa/tm1Apa mice exhibit a mild impairment of erythropoiesis. Third, Mll5tm1Apa/tm1Apa hematopoietic stem cells (HSCs) have impaired competitive repopulating capacity both under normal conditions and when subjected to self-renewal stimulation by NUP98-HOXA10. Fourth, Mll5tm1Apa homozygous HSCs show a dramatic sensitivity to DNA demethylation–induced differentiation (5-azadeoxycytidine). Taken together, our data show that MLL5 is involved in terminal myeloid differentiation and the regulation of HSC self-renewal by a mechanism that involves DNA methylation. These data warrant investigation of MLL5 expression levels as a predictive marker of demethylating-agent response in patients with myelodysplastic syndromes and leukemias and identify MLL5 as a key regulator of normal hematopoiesis.
Introduction
The mammalian MLL protein (from original identification in mixed lineage leukemias, also known as TRX or ALL1 and now classified as MLL1) is the just identified member of the MLL family comprising 5 members (MLL1-5) that are thought to regulate stable states of transcription during developmental processes. MLL1-4 proteins share the greatest similarity with the Drosophila Trithorax group,1 but all 5 members contain at least 1 conserved Su(var)3,9, enhancer of zest, Trithorax (SET) domain, and plant homeodomain (PHD) zinc finger motif. SET domains possess histone methyltransferase activity,2,3 whereas PHD fingers are binding/recognition motifs for histone modifications.4-6 The SET domain of MLL1 was found to have H3K4-specific histone methyltransferase activity7,8 and, like MLL2 (now classified as MLL4(TRX2)), was found in chromatin remodeling complexes containing menin.9 MLL3 and MLL4 (now classified as MLL3(HALR) and MLL2(ALR), respectively) are found in complexes containing ASC-210 and are associated with H3 Lys-27 (K27)–specific demethylating activity by UTX.11 MLL (MLL1) also can directly and indirectly regulate DNA methylation.12 MLL5 initially was assigned to this family based on the sequence homology of the SET domain; however, the overall sequence similarity suggests a closer relationship to yeast SET3 and SET4 proteins.13,14 Currently, no experimental evidence exists of SET methyltransferase activity associated with any member of the yeast SET3/4 group nor for mammalian MLL5. In vitro studies have suggested MLL5 to be directly or indirectly implicated in cell-cycle arrest in vitro15 and in a model of muscle differentiation.16
Mll5 is located on human chromosome 7q22,17 a region exhibiting commonly recurring cytogenetic aberrations detected in myeloid malignancies.17 This location points to a possible role in hematopoiesis; other MLL family members, MLL 1-4,18-21 were cloned under similar circumstances but, to date, only MLL1 has been shown to have a clear role in hematopoiesis.18,22,23 Loss-of-function alleles in mice have defined functions for MLL1, MLL3, and MLL4 in development and hematopoiesis. MLL1 is required for the maintenance of Hox gene expression, and Mll1 knockout mice are embryonic lethal.24 The loss-of-function allele of Mll2 (now called Mll4) in a murine model resulted in embryonic lethality attributable to failed neural tube closure.13 An in-frame deletion of the SET domain of MLL3 resulted in partial embryonic lethality; however, surviving mice appear hypofertile10 through undocumented mechanisms.
To investigate the biologic role of Mll5, we created a loss-of-function allele of Mll5 on a region on mouse chromosome 5 showing conserved synteny with human chromosome 7q22.25 Unlike Mll1 and Mll4 knockout mice, the resulting homozygous mice are viable, and those surviving till adulthood display a hematologic syndrome reminiscent of human MDS. Our data implicate Mll5 in terminal myeloid differentiation and more primitive hematopoietic cell function.
Methods
Further details from “Methods” can be found in Document S1, available on the Blood website; see the Supplemental Materials link at the top of the online article.
Gene targeting in embryonic stem cells and genotyping
Our gene-targeting strategy consisted of engineering a germline deletion of 106 bp in exon 3 of Mll5 designated Mll5tm1Apa (Figure 1A). We amplified the 5′ target arm from isogenic 129S6(SvEv) genomic DNA by using the primers 5′armFII and 5′armR, and we amplified the 3′ arm homology arm by using the primers 3′armF and 3′armR (Table S1).
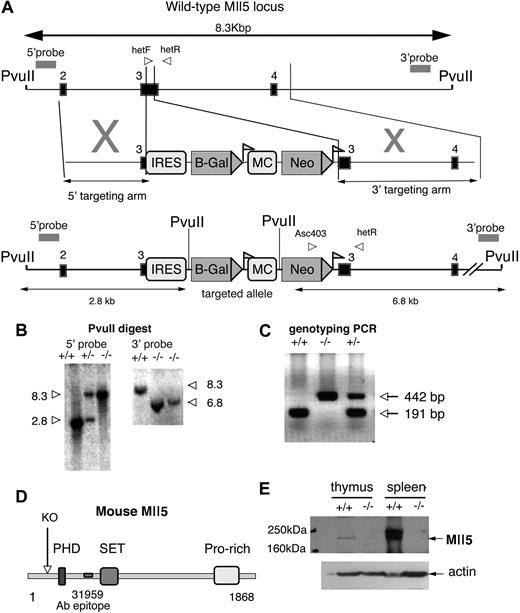
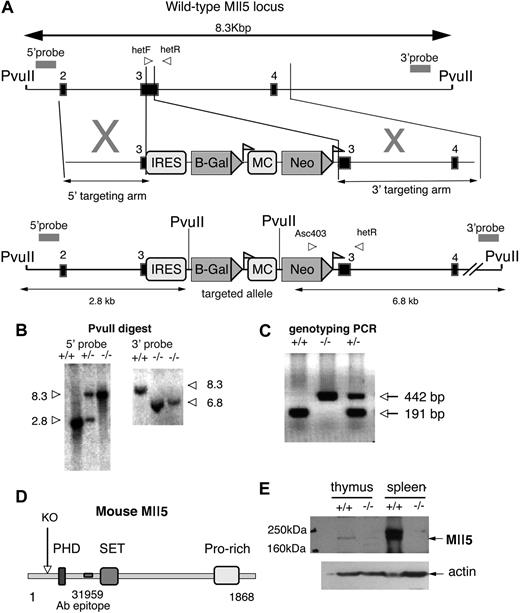
Generation of Mll5tm1Apa mice. (A) Schematic representation of the genomic structure of the portion of Mll5 locus between PvuII restriction enzyme sites (top), the targeting vector (middle), and the portion of the targeted allele between PvuII sites (bottom). Exons are represented by solid boxes and LoxP sequences as triangular flags. The positions of primers for genotyping analysis (arrowheads labeled hefF, hetR, and Asc403) and probes used for Southern blots (double-headed arrows) are indicated. The Neo gene under the controls of the MC promoter is flanked by LoxP sequences. The IRES-LacZ cassette was designed to be driven off the endogenous Mll5 promoter. (B) Southern blot of genomic DNA from Mll5tm1Apa homozygous (−/−), Mll5tm1Apa heterozygous (+/−), and wild-type (+/+) mice cut with PvuII and hybridized with the external probes as indicated in A. (C) Mice were genotyped by PCR with the primers (indicated in A) and a representative gel is shown. Amplification with primers hetF and hetR (wild-type allele) yielded a 191-bp product, whereas amplification with primers Asc403 and hetR (recombinant allele) yielded a 442-bp product. (D) Schematic representation of the murine Mll5 protein depicting the domains of the mouse Mll5 protein and the truncation (labeled KO, if the protein were to be translated) of knockout protein. The epitope of the antibody 31 959 is also indicated. (E) Western blot of thymus and spleen from −/− and +/+ animals, blotted with anti-Mll5 polyclonal antibody (top panel; 31 959 epitope indicated in D) or anti-ACTIN (Santa Cruz Biotechnology, Santa Cruz, CA) antibody (bottom panel).
Generation of Mll5tm1Apa mice. (A) Schematic representation of the genomic structure of the portion of Mll5 locus between PvuII restriction enzyme sites (top), the targeting vector (middle), and the portion of the targeted allele between PvuII sites (bottom). Exons are represented by solid boxes and LoxP sequences as triangular flags. The positions of primers for genotyping analysis (arrowheads labeled hefF, hetR, and Asc403) and probes used for Southern blots (double-headed arrows) are indicated. The Neo gene under the controls of the MC promoter is flanked by LoxP sequences. The IRES-LacZ cassette was designed to be driven off the endogenous Mll5 promoter. (B) Southern blot of genomic DNA from Mll5tm1Apa homozygous (−/−), Mll5tm1Apa heterozygous (+/−), and wild-type (+/+) mice cut with PvuII and hybridized with the external probes as indicated in A. (C) Mice were genotyped by PCR with the primers (indicated in A) and a representative gel is shown. Amplification with primers hetF and hetR (wild-type allele) yielded a 191-bp product, whereas amplification with primers Asc403 and hetR (recombinant allele) yielded a 442-bp product. (D) Schematic representation of the murine Mll5 protein depicting the domains of the mouse Mll5 protein and the truncation (labeled KO, if the protein were to be translated) of knockout protein. The epitope of the antibody 31 959 is also indicated. (E) Western blot of thymus and spleen from −/− and +/+ animals, blotted with anti-Mll5 polyclonal antibody (top panel; 31 959 epitope indicated in D) or anti-ACTIN (Santa Cruz Biotechnology, Santa Cruz, CA) antibody (bottom panel).
Expression analysis by reverse transcription–polymerase chain reaction and Western blotting
FACS analysis/cell sorting, cell-cycle analysis, and apoptosis measurement
Sorting of purified hematopoietic populations was performed as described.27
Retroviral vectors and vector production
Mice and retroviral infection of primary bone marrow cells
All mice were bred and maintained as approved by the University of British Columbia Animal Care Committee or under the authority of a United Kingdom Home Office Project License (PPL80/1503).
Bone marrow transplantation and monitoring of mice
Bone marrow transplantation was performed as described previously.31
Clonogenic progenitor assay
Colony-forming cells (CFCs) were assayed in methylcellulose (Methocult M3234; StemCell Technologies, Vancouver, BC) as described previously.31
Oxidative burst assay
To determine the ability of murine blood neutrophils to generate oxygen radicals, commercially available flow cytometry–based assays were used according to the manufacturer's instructions (Phagoburst; ORPEGEN Pharma, Heidelberg, Germany).
Drugs
5-Aza-2′-deoxycytidine (Sigma-Aldrich, Oakville, ON) was dissolved in dimethyl sulfoxide (DMSO) at a stock concentration of 100 mmol/L and stored at −20°C in the dark. Trichostatin A (TSA; Sigma-Aldrich) was dissolved in ethanol at a stock concentration of 1.5 mmol/L and stored at −20°C in the dark.
Statistical analysis
Pairwise comparisons were performed by the Student t test for continuous variables or the χ2 test for categorical variables. The 2-sided level of significance was set at P values less than .05. Statistical analyses were performed with Excel (Microsoft, Mississauga, ON) and R32 .
Results
Generation of a murine Mll5 loss-of-function allele
To investigate the functions of Mll5, we generated a loss-of-function allele at the Mll5 locus gene by the insertion of a neomycin cassette and bacterial β-galactosidase reporter within coding exon 3 by homologous recombination. This results in the deletion of 106 bp of coding sequence and disruption of the 5′-most coding exon that would generate a frame shift; any resulting transcript would be predicted to degrade by nonsense-mediated RNA decay (NMD). Should any transcript survive and the protein be translated, it would, nonetheless, result in a truncated protein lacking the PHD, SET, and downstream domains, as shown schematically in Figure 1A. Furthermore, exon 3 is out of phase with downstream exons; therefore, any cassette/exon skipping would result in a frame shift mutation, similarly truncating the protein.
The allele was generated by homologous recombination in 129S6/SvEv embryonic stem cells with use of the construct illustrated in Figure 1A. A total of 5 correctly targeted clones were confirmed by the use of a Southern blot with 5′ and 3′ external probes, and 1 clone was transmitted to the germline (Figure 1B). Mice were backcrossed twice to parental 129S6 wild-type mice before analysis. Subsequent genotyping was performed with PCR (Figure 1C). The absence of the Mll5 full-length protein was confirmed by Western blot (Figure 1E).
Mll5 is not required for embryonic development
Because the loss-of-function alleles of Mll1 and Mll2 result in early embryonic lethality,13,24 we first assessed whether Mll5 is absolutely required during embryogenesis. The genotypes at weaning (3-4 weeks postnatal) of 1270 animals from heterozygous Mll5tm1Apa mating pairs show that viable homozygous Mll5tm1Apa mice survive to weaning; however, with a non-Mendelian ratio (31.3% wild type, 52.8% heterozygous, and 15.9% homozygous: χ2df = 2 = 63.9, P = 1.29 × 10⁻¹⁴) (Table 1). There appears to be no significant association of this loss of viability with any particular sex (χ2df = 4 = 3.70, P = .45; Table 1). Nevertheless, the departure from Mendelian ratios at weaning suggests a nonessential function at some point up to the age of weaning.
To further refine this interval, we examined the ratio of genotypes at late gestation from embryos dissected at E16.5 days. Table 1 shows that of the 87 embryos genotyped, 23.0% were wild type, 51.7% were heterozygous, and 25.3% were homozygous Mll5tm1Apa. These ratios do not differ significantly from the expected Mendelian ratio (χ2df = 2 = 0.195, P = .91) suggesting that homozygous Mll5tm1Apa embryos survive at least until 16.5 days postcoitus (dpc), unlike Mll1 and Mll4 homozygous knockout mice, which die before 9.5 and 11.5 dpc, respectively. At weaning, surviving homozygous Mll5tm1Apa mice of both sexes were significantly lighter than their wild-type counterparts (+/+ 19.4 ± 4.0 g [n = 94], −/− 16.0 ± 5.5 g [n = 37], P = .001 [males] and +/+ 17.3 ± 3.2 g [n = 68], −/− 15.8 ± 3.8 g [n = 39], P = .038 [females]). Necropsy of homozygous Mll5tm1Apa mice showed no gross anatomical abnormalities. It was noted, however, that there was less body fat in homozygous Mll5tm1Apa mice than wild-type littermates. The cause of death between late embryogenesis and weaning was not examined further in this study. Surviving homozygous Mll5tm1Apa mice are capable of living to at least 18 months without apparent disease, although with an immune deficiency that is described below. Male (but not female) homozygous Mll5tm1Apa mice are infertile; however, this phenotype will be described elsewhere (D.B.Y. and S.A.A., manuscript in preparation).
Gross hematologic evaluation reveals a mild erythroid lineage defect in homozygous Mll5tm1Apa mice
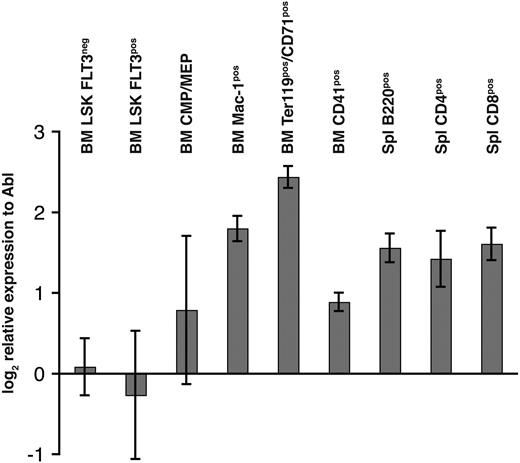
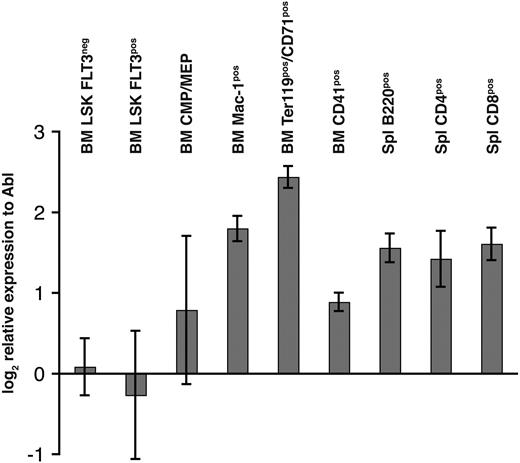
Because of the critical role of other Mll genes in hematopoiesis, expression of Mll5 mRNA was determined by quantitative RT-PCR in fluorescence-activated cell-sorted (FACS) highly enriched populations of hematopoietic progenitor and mature cells. The cycling threshold (Ct) value for Mll5 in LSKFlt3− cells was similar to the Ct value of the endogenous control gene Abl (29.3 vs 27.7 cycles, respectively), demonstrating a high expression of Mll5 in HSCs. Expression of Mll5 in LSKFlt3hi cells (lymphoid-primed multipotent progenitor) was comparable with the HSC compartment; however, greater expression of Mll5 was found in more mature cells of both myeloid and lymphoid lineage and was found to be highest in Mac-1+ (3.2-fold increase to LSKFlt3−) and Ter119+CD71+ (corresponding to basophilic erythroblasts, 5-fold increase to LSKFlt3−) cells (Figure 2).
Relative gene expression of Mll5 in various FACS-sorted bone marrow and splenocyte subpopulations. Bone marrow (BM) and spleen (Spl) of 8-week-old wild-type mice were harvested and stained for FACSorting (see “FACS analysis/cell sorting, cell-cycle analysis, and apoptosis measurement”). Quantitative RT-PCR was performed in quadruplicate for Mll5 and Abl. The chart shows mean and standard deviation (SD) of expression levels of Mll5 mRNA relative to Abl normalized to one of the LSKFLT3neg samples.
Relative gene expression of Mll5 in various FACS-sorted bone marrow and splenocyte subpopulations. Bone marrow (BM) and spleen (Spl) of 8-week-old wild-type mice were harvested and stained for FACSorting (see “FACS analysis/cell sorting, cell-cycle analysis, and apoptosis measurement”). Quantitative RT-PCR was performed in quadruplicate for Mll5 and Abl. The chart shows mean and standard deviation (SD) of expression levels of Mll5 mRNA relative to Abl normalized to one of the LSKFLT3neg samples.
We next examined the hematologic parameters in peripheral blood of each genotype, in animals between 5 and 10 months of age. We noted significant reductions in red blood cell (RBC) counts (10.1 × 10⁹/mL vs 11.7 × 10⁹/mL, respectively, P < .001, Figure S1A), hemoglobin (15.4 g/dL vs 17.5 g/dL, P < .001, Figure S1B), and hematocrit (49% vs 57%, respectively, P < .001, Figure S1C) in homozygous Mll5tm1Apa mice. Red cell distribution width was significantly increased in homozygous Mll5tm1Apa mice compared with wild types (13.8% vs 13%, respectively, P < .001; Figure S1D). Morphologically, RBCs of both genotypes appeared to be normal, with no apparent features of dysplasia (data not shown). These data show a mild erythroid lineage defect. Initial measurements of total white cell counts showed greater variance in the homozygous animals but without statistically significant differences in the mean count or differential cell counts. Similarly, platelet counts were not significantly different between homozygous Mll5tm1Apa compared with wild-type mice.
Mll5tm1Apa/tm1Apa mice are highly susceptible to bacterial infection
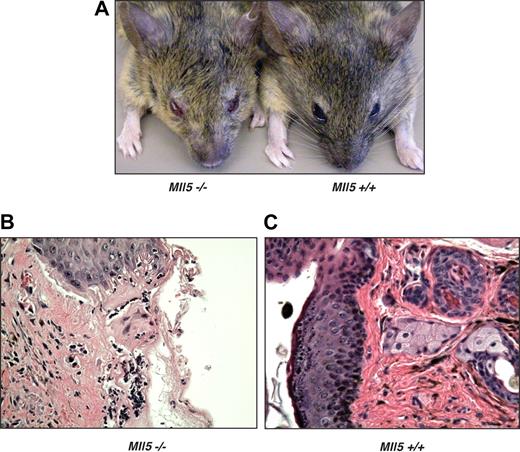
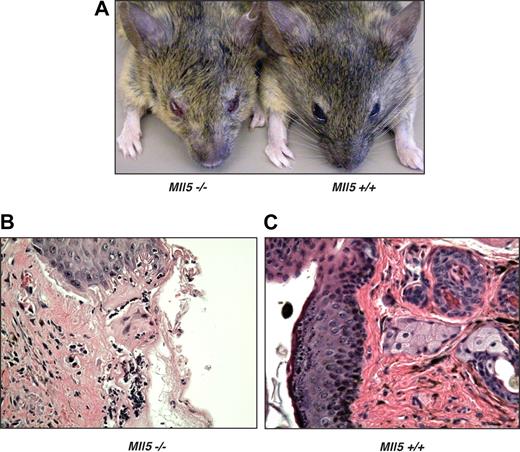
Despite only modest changes noted in the peripheral blood counts of Mll5tm1Apa homozygous mice, we were intrigued by the observation that 60% of the homozygous animals older than 1 year (9 of 15) developed eye infections, in many cases severe in nature (Figure 3A). In cohort studies of mice ages 6 to 52 weeks, 19% (8 of 34) of homozygous Mll5tm1Apa mice were affected, but no wild-type littermates housed under the same conditions (0 of 33) had any eye infections. The eye infections frequently responded to Septrin (GlaxoSmithKline, Brentford, United Kingdom) containing antibacterial treatment, although noncommensal organisms were not cultured from eye swabs. Histologic sections of affected eyelids from homozygous mice (Figure 3B) showed mucosal infiltrates of macrophages and neutrophils, an appearance that is typical of bacterial infection, whereas control sections from unaffected wild-type or mutant mice (Figure 3C) showed no infiltrates. In 3 homozygous Mll5tm1Apa mice, the seminal vesicles were found to be distended, and one culture tested positive for Escherichia coli. Taken together, these data show that homozygous Mll5tm1Apa mice are susceptible to mucosal bacterial infections, implying a deficiency in immune surveillance.
Mll5−/− mice are susceptible to bacterial infection. (A) Blepharitis in Mll5−/− mice. Histologic comparison of representative hematoxylin and eosin sections of (B) affected eyelids from Mll5−/− compared with (C) normal eyes from wild-type mice (original magnification ×400).
Mll5−/− mice are susceptible to bacterial infection. (A) Blepharitis in Mll5−/− mice. Histologic comparison of representative hematoxylin and eosin sections of (B) affected eyelids from Mll5−/− compared with (C) normal eyes from wild-type mice (original magnification ×400).
Neutrophils are functionally impaired in homozygous Mll5tm1Apa mice
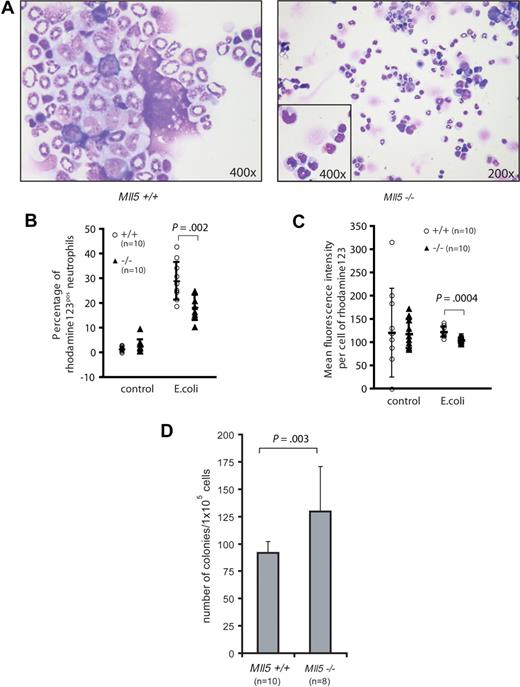
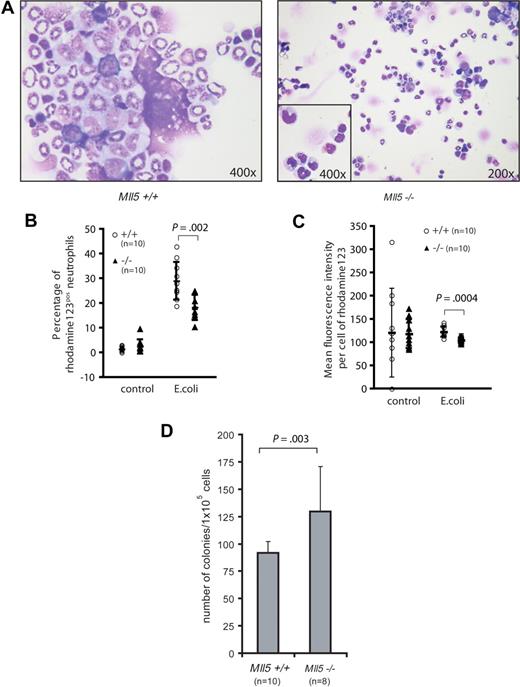
We decided to examine whether defects in cellular antimicrobial defense could explain the frequent eye infections. We first examined cytospin preparations of homozygous Mll5tm1Apa bone marrow. Several Mll5tm1Apa homozygous mice showed an increase in metamyelocytes and reduced numbers of segmented neutrophils (Figure 4A), implying a maturation block. To test whether this maturation delay occurred in response to acute infection or whether the neutrophils were intrinsically blocked in maturation and/or function, we investigated the oxidative burst capacity of neutrophils. Neutrophils produce reactive oxygen species (ROS) in response to bacterial endotoxin stimulation. Significantly fewer neutrophils in the peripheral blood of Mll5tm1Apa homozygous mice produced ROS upon stimulation with E coli, compared with neutrophils of wild-type mice (18.3% vs 29% of neutrophils, respectively, P = .002, n = 10 per genotype, Figure 4B), and neutrophils of Mll5tm1Apa homozygous mice produced less ROS per cell than from wild-type mice (P = 4 × 10⁻⁴, n = 10 per genotype, Figure 4C). Stimulation of neutrophils with high control (phorbol 12-myristate 13-acetate; PMA) and low control (formyl-methionyl-leucyl-phenylalanine; fMLP) did not show a differential response (data not shown). On the basis of the morphologic maturation arrest and the functional defect of neutrophils in Mll5tm1Apa homozygous mice, we asked whether myeloid differentiation is blocked at the progenitor level in the knockout mice. Bone marrow cells from 10 wild-type and 8 homozygous Mll5tm1Apa mice were assayed for clonogenic progenitor content in duplicate methylcellulose-based cultures (105 cells/plate) and stimulated with granulocyte-colony stimulating factor (G-CSF; 10 ng/mL) for 10 days. Homozygous Mll5tm1Apa bone marrow generated more colonies than Mll5 wild-type bone marrow (130 vs 92 colonies, respectively [P = .003], all colonies were G-colonies; Figure 4D). Taken together, these findings show that terminal myeloid differentiation and neutrophil function are impaired in Mll5tm1Apa homozygous mice.
Neutrophils from Mll5−/− mice are functionally impaired. (A) Cytospin preparation of BM cells from 5-month-old wild-type (left, original magnification ×400) and Mll5−/− (right, original magnification ×200, inset ×400) animals stained with Wright Giemsa stain. Quantification of the oxidative burst activity of neutrophils in peripheral blood (PB) of Mll5+/+ and −/− mice. (B) Percentage of neutrophils producing reactive oxidants and (C) enzymatic activity of reactive oxidants per cell. (D) Eight-week-old Mll5−/− mice have increased numbers of granulocyte progenitors; graph depicts mean and SD of 10-day G-CSF–responsive colony-forming cells formed per 105 bone marrow cells.
Neutrophils from Mll5−/− mice are functionally impaired. (A) Cytospin preparation of BM cells from 5-month-old wild-type (left, original magnification ×400) and Mll5−/− (right, original magnification ×200, inset ×400) animals stained with Wright Giemsa stain. Quantification of the oxidative burst activity of neutrophils in peripheral blood (PB) of Mll5+/+ and −/− mice. (B) Percentage of neutrophils producing reactive oxidants and (C) enzymatic activity of reactive oxidants per cell. (D) Eight-week-old Mll5−/− mice have increased numbers of granulocyte progenitors; graph depicts mean and SD of 10-day G-CSF–responsive colony-forming cells formed per 105 bone marrow cells.
The defect in homozygous Mll5tm1Apa neutrophils is cell-autonomous
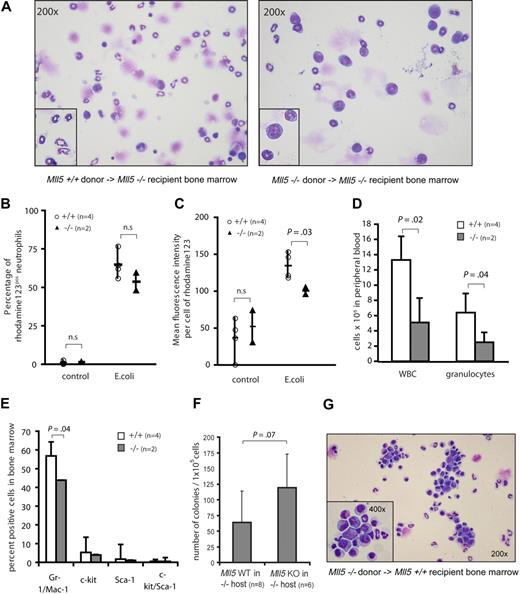
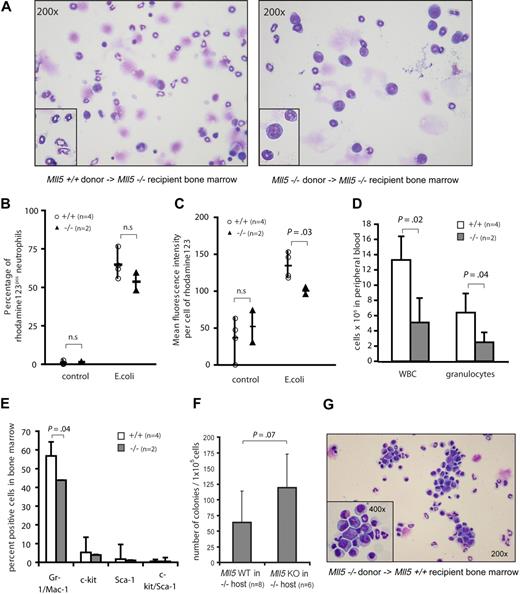
To test whether the neutrophil defect was cell-autonomous, we lethally irradiated homozygous Mll5tm1Apa mice as recipients and transplanted bone marrow cells from either wild-type (n = 4) or knockout (n = 3) mice without helper cells, thus exposing Mll5 wild-type cells to a niche environment of homozygous Mll5tm1Apa mice. Bone marrow was aspirated 4 weeks after transplantation and harvested from euthanized mice 5 months later. Interestingly, knockout recipient mice of wild-type bone marrow showed a high proportion of fully maturated neutrophils, whereas knockout recipients of homozygous Mll5tm1Apa bone marrow displayed an increased proportion of myeloid precursors (Figure 5A). The oxidative burst activity of neutrophils from peripheral blood was measured in recipients of Mll5 wild-type and knockout bone marrow 8 weeks after transplantation. As with naive mice, fewer neutrophils of mice reconstituted from homozygous Mll5tm1Apa bone marrow produced ROS upon stimulation with E coli, compared with wild-type control mice (54% vs 65% of neutrophils, respectively; n = 2 and 4, respectively, P = n.s.; Figure 5B). Furthermore, neutrophils of mice reconstituted from homozygous Mll5tm1Apa bone marrow produced less ROS per cell than wild-type control mice (n = 2 and 4, respectively, P = .03; Figure 5C). Stimulation of neutrophils of either genotype with high control (PMA) or low control (fMLP) again did not show a differential response (data not shown). At 8 weeks after transplantation, mice reconstituted from homozygous Mll5tm1Apa bone marrow had significantly lower white blood cell (WBC) counts (5.1 × 10⁶ vs 13.3 × 10⁶, respectively, P = .02) and reduced numbers of granulocytes (2.5 × 10⁶ vs 6.4 × 10⁶, respectively, P = .04) compared with wild-type control mice (Figure 5D). Accordingly, immunophenotypic analysis of bone marrow showed significantly lower numbers of Gr-1/Mac-1–expressing cells in mice reconstituted from homozygous Mll5tm1Apa bone marrow than mice reconstituted from wild-type bone marrow (44% vs 57%, respectively, P = .04; Figure 5E). As with naive mice, G-CSF–responsive colony-forming cells were increased in mice reconstituted from homozygous Mll5tm1Apa marrow compared with mice reconstituted from Mll5 wild-type bone marrow (119 vs 64 colonies per 105 cells, P = .07; Figure 5F), suggesting that granulocyte progenitors have a maturation defect and accumulate in the bone marrow. To investigate whether the neutrophil maturation defect in homozygous Mll5tm1Apa cells is independent of the homozygous Mll5tm1Apa microenvironment, bone marrow cells from homozygous Mll5tm1Apa mice were transplanted into wild-type recipients. Several mice from independent donors showed a dramatic increase in myeloid progenitors in bone marrow of reconstituted mice after 6 months (Figure 5G). Together, these findings demonstrate that the functional impairment of neutrophils is cell-autonomous and appears to relate to the capacity to respond to endotoxins, as opposed to an intrinsic defect in the ROS generation pathway.
The neutrophil defect in Mll5−/− mice is cell-autonomous. (A) Cytospin preparations of bone marrow cells stained with Wright Giemsa stain from Mll5−/− recipients that were transplanted with bone marrow cells from Mll5+/+ (left, original magnification ×200, inset digitally enlarged) or Mll5−/− (right, original magnification ×200, inset ×400) mice, harvested 6 months after transplantation. Quantification of the oxidative burst activity of neutrophils in peripheral blood of Mll5−/− mice transplanted with Mll5+/+ (n = 4) or Mll5−/− (n = 2) bone marrow, 8 weeks after transplantation. Graphs showing (B) percent of neutrophils producing reactive oxidants and (C) enzymatic activity of reactive oxidants per cell. (D) Mean and SD of reconstituted hematopoietic cells in peripheral blood of Mll5−/− recipients transplanted with Mll5+/+ (n = 4, □) or Mll5−/− (n = 2,  ) bone marrow cells, automated cell counts 8 weeks after transplantation. (E) Mean and SD of reconstituted hematopoietic cells in bone marrow of Mll5−/− recipients transplanted with Mll5+/+ (n = 4, □) or Mll5−/− (n = 2,
  ) bone marrow cells, immunophenotyping by flow cytometry 4 weeks after transplantation. (F) Granulocyte progenitors in bone marrow of Mll5−/− recipients transplanted with Mll5+/+ (n = 8) or Mll5−/− (n = 6) bone marrow cells; mean number and SD of 10-day G-CSF–responsive colony-forming cells formed per 105 bone marrow cells 1 and 6 months after transplantation. (G) Cytospin preparations of bone marrow cells stained with Wright Giemsa stain from Mll5+/+ recipients that were transplanted with bone marrow cells from Mll5−/− mice (original magnification ×200, inset ×400), harvested 6 months after transplantation.
The neutrophil defect in Mll5−/− mice is cell-autonomous. (A) Cytospin preparations of bone marrow cells stained with Wright Giemsa stain from Mll5−/− recipients that were transplanted with bone marrow cells from Mll5+/+ (left, original magnification ×200, inset digitally enlarged) or Mll5−/− (right, original magnification ×200, inset ×400) mice, harvested 6 months after transplantation. Quantification of the oxidative burst activity of neutrophils in peripheral blood of Mll5−/− mice transplanted with Mll5+/+ (n = 4) or Mll5−/− (n = 2) bone marrow, 8 weeks after transplantation. Graphs showing (B) percent of neutrophils producing reactive oxidants and (C) enzymatic activity of reactive oxidants per cell. (D) Mean and SD of reconstituted hematopoietic cells in peripheral blood of Mll5−/− recipients transplanted with Mll5+/+ (n = 4, □) or Mll5−/− (n = 2,  ) bone marrow cells, automated cell counts 8 weeks after transplantation. (E) Mean and SD of reconstituted hematopoietic cells in bone marrow of Mll5−/− recipients transplanted with Mll5+/+ (n = 4, □) or Mll5−/− (n = 2,
  ) bone marrow cells, immunophenotyping by flow cytometry 4 weeks after transplantation. (F) Granulocyte progenitors in bone marrow of Mll5−/− recipients transplanted with Mll5+/+ (n = 8) or Mll5−/− (n = 6) bone marrow cells; mean number and SD of 10-day G-CSF–responsive colony-forming cells formed per 105 bone marrow cells 1 and 6 months after transplantation. (G) Cytospin preparations of bone marrow cells stained with Wright Giemsa stain from Mll5+/+ recipients that were transplanted with bone marrow cells from Mll5−/− mice (original magnification ×200, inset ×400), harvested 6 months after transplantation.
Loss of Mll5 enhances cell-cycle transition of hematopoietic progenitor cells and affects the repopulation ability of normal and NUP98-HOXA10hd–expanded bone marrow cells
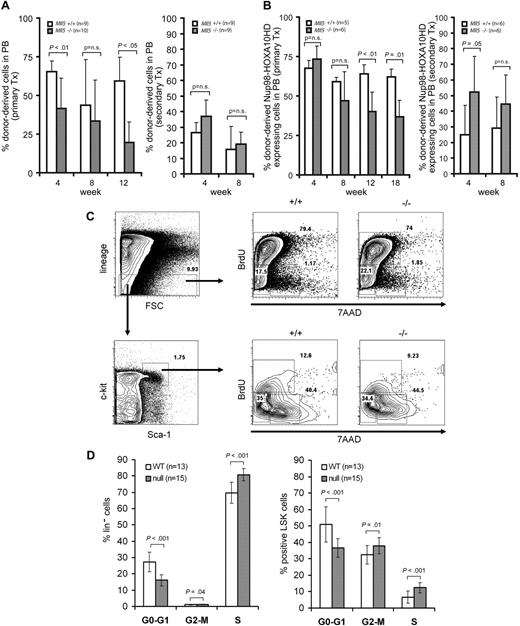
Intrigued by the defect in myeloid lineage maturation, we next asked whether Mll5 might be required for earlier compartments. To investigate the requirement for Mll5 in HSC self-renewal, we performed a competitive repopulation experiment with bone marrow of wild-type (n = 9) or homozygous Mll5tm1Apa (n = 10) mice. Bone marrow was harvested and retrovirally marked with a vector expressing YFP to allow subsequent tracking of repopulation in wild-type 129S6 transplant recipient mice. Six days after bone marrow harvest, 5 × 10⁵ YFP+ cells were isolated by the use of FACS and transplanted into lethally irradiated wild-type recipients together with a competitor dose of 2.5 × 10⁵ freshly harvested bone marrow cells from wild-type donors. Long-term engraftment by homozygous Mll5tm1Apa YFP-transduced bone marrow cells was significantly reduced compared with transduced wild-type bone marrow cells (19% vs 59%, respectively after 12 weeks, P < .05; Figure 6A). Four weeks after transplantation, there were significantly lower numbers of Mac-1–expressing cells in peripheral blood derived from homozygous Mll5tm1Apa donor cells compared with wild-type donor cells (15% vs 24%, respectively, P = .04) and lower numbers of c-kit–expressing cells (1.1% vs 1.9%, respectively, P = .02; data not shown). B- and T-cell markers were not differentially expressed.
Loss of Mll5 enhances cell-cycle transition of hematopoietic progenitor cells and affects the repopulation ability of normal and NUP98-HOXA10hd– expanded bone marrow cells. (A) Hematopoietic reconstitution in peripheral blood of wild-type mice transplanted with retrovirally marked bone marrow cells from Mll5+/+ (n = 9) or Mll5−/− (n = 10) mice. Chart depicts mean and SD of percent donor-derived cells (YFP-positive by FACS) in peripheral blood at 4, 8, and 12 weeks after transplantation (left panel). Hematopoietic reconstitution in peripheral blood of secondary transplants (right panel). (B) Hematopoietic reconstitution in peripheral blood of wild-type mice transplanted with bone marrow cells from Mll5+/+ (n = 5) or Mll5−/− (n = 6) mice transduced with NUP98-HOXA10hd. Chart shows percent donor-derived NUP98-HOXA10hd–expressing cells (GFP-positive by FACS) in peripheral blood at 4, 8, 12, and 18 weeks after transplantation (left panel). Hematopoietic reconstitution in peripheral blood of secondary transplants (right panel). (C) Gating strategy for lineage-negative and LSK cells and representative blots of cell-cycle distribution. (D) Cell-cycle distribution in lineage-negative (left panel) and LSK (right panel) bone marrow cells (BrdU injections intraperitoneally at 36, 24, and 12 hours before harvest) from 8-week-old Mll5+/+ (n = 13) and Mll5−/− (n = 15) mice. Cell-cycle phases were determined by analysis of 5-bromo-2-deoxyuridine (BrdU)/7-amino-actinomycin D (7AAD) staining by FACS, and the mean and SD of each phase is shown.
Loss of Mll5 enhances cell-cycle transition of hematopoietic progenitor cells and affects the repopulation ability of normal and NUP98-HOXA10hd– expanded bone marrow cells. (A) Hematopoietic reconstitution in peripheral blood of wild-type mice transplanted with retrovirally marked bone marrow cells from Mll5+/+ (n = 9) or Mll5−/− (n = 10) mice. Chart depicts mean and SD of percent donor-derived cells (YFP-positive by FACS) in peripheral blood at 4, 8, and 12 weeks after transplantation (left panel). Hematopoietic reconstitution in peripheral blood of secondary transplants (right panel). (B) Hematopoietic reconstitution in peripheral blood of wild-type mice transplanted with bone marrow cells from Mll5+/+ (n = 5) or Mll5−/− (n = 6) mice transduced with NUP98-HOXA10hd. Chart shows percent donor-derived NUP98-HOXA10hd–expressing cells (GFP-positive by FACS) in peripheral blood at 4, 8, 12, and 18 weeks after transplantation (left panel). Hematopoietic reconstitution in peripheral blood of secondary transplants (right panel). (C) Gating strategy for lineage-negative and LSK cells and representative blots of cell-cycle distribution. (D) Cell-cycle distribution in lineage-negative (left panel) and LSK (right panel) bone marrow cells (BrdU injections intraperitoneally at 36, 24, and 12 hours before harvest) from 8-week-old Mll5+/+ (n = 13) and Mll5−/− (n = 15) mice. Cell-cycle phases were determined by analysis of 5-bromo-2-deoxyuridine (BrdU)/7-amino-actinomycin D (7AAD) staining by FACS, and the mean and SD of each phase is shown.
The competitive repopulation experiment was repeated by transducing bone marrow cells from wild-type (n = 5) and homozygous Mll5tm1Apa (n = 6) mice with NUP98-HOXA10hd, a fusion gene capable of stimulating the self-renewal of normal HSCs both in vitro (>1000-fold after 6 days of culture) and in vivo.28 A total of 106 NUP98-HOXA10hd–transduced cells were isolated by FACS based on expression of the GFP reporter gene and were injected along with 2.5 × 10⁵ freshly isolated wild-type bone marrow cells into lethally irradiated mice. Interestingly, even in the presence of this very potent self-renewal–enhancing protein, long-term engraftment was significantly reduced in homozygous Mll5tm1Apa mice compared with wild-type mice (37% vs 62% donor cells in peripheral blood 18 weeks after transplantation, P = .001; Figure 6B). However, transplantation of bone marrow taken from primary recipients at this time point did not show a competitive disadvantage of homozygous Mll5tm1Apa cells in secondary recipients (Figure 6A,B), suggesting that short-term, rather than long-term, repopulating cells are affected by loss of Mll5. Cell-cycle distribution analysis in the lineage-negative compartment and in Lin−Sca+Kit+ (LSK) cells showed a significantly reduced fraction of cells in the G0 phase and an increased fraction in G2/M/S phases in homozygous Mll5tm1Apa mice compared with wild-type mice (Figure 6C,D). The rate of apoptosis in LSK cells was not different between wild-type and homozygous Mll5tm1Apa mice (Figures S2,S3).
MLL5 has been implicated as a tumor suppressor, and its loss may enhance tumorigenesis. We retrovirally transduced bone marrow cells of wild-type and homozygous Mll5tm1Apa mice with the NUP98-HOXD13 fusion gene, which can induce rapid-onset leukemias in collaboration with other oncogenes like Meis1 and, when overexpressed on its own, can trigger late-onset myeloproliferative disorders.29 None of the recipients of NUP98-HOXD13 homozygous Mll5tm1Apa transduced cells (n = 13 mice tested) developed leukemia over the course of 6 months, suggesting that MLL5 deficiency does not enhance the susceptibility to transformation. Moreover, naive homozygous Mll5tm1Apa mice did not spontaneously develop tumors within 18 months from birth.
Loss of Mll5 sensitizes HSC to 5-aza-deoxycytidine–induced differentiation
Given the observed defects in hematopoiesis and the known role of Mll genes in epigenetic regulation, we investigated the effect of the DNA-methyltransferase inhibitor 5-aza-deoxycytidine (5-azaCdR) or the histone deacetylase inhibitor trichostatin A (TSA) on the competitive marrow repopulation capacity of wild-type and homozygous Mll5tm1Apa mice. A total of 3 mice of each genotype were injected subcutaneously with 5% DMSO (solvent only, 100 μL), 5-azaCdR (1 mg/kg), or TSA (1 mg/kg) on days 1, 4, 6, 8, 11, and 13, and bone marrow was harvested on day 21. After 1 day of prestimulation with murine interleukin-3 (mIL-3; 6 ng/mL), human interleukin-6 (hIL-6; 10 ng/mL), and murine stem cell factor (SCF; 20 ng/mL), cells were retrovirally transduced with an YFP-expressing plasmid (for cell tracking after transplantation) for 48 hours (mean transduction efficiency 33%). After an additional 48 hours, 105 YFP+ cells were transplanted with 105 freshly isolated bone marrow cells as helper cells into lethally irradiated wild-type recipients (2 recipient mice per donor mouse).
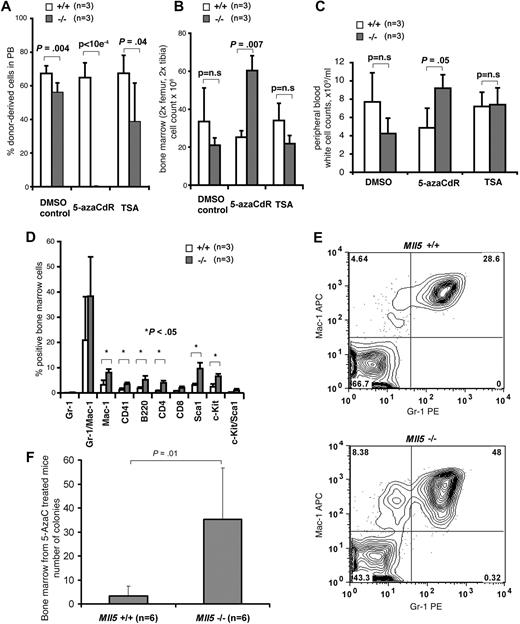
As noted previously, 4-week engraftment of donor-derived cells in peripheral blood from DMSO-treated mice was reduced with homozygous Mll5tm1Apa marrow cells, compared with wild-type cells (P = .004; Figure 7A). Strikingly, 5-azaCdR–treated homozygous Mll5tm1Apa bone marrow did not show any engraftment potential in peripheral blood whereas 5-azaCdR–treated wild-type bone marrow produced similar engraftment levels as DMSO-treated wild-type control bone marrow cells (65% vs 67%, respectively; Figure 7A). TSA-treated homozygous Mll5tm1Apa bone marrow cells resulted in moderately lower—but not absent—engraftment compared with wild-type bone marrow cells (39% vs 67%, respectively, P = .04; Figure 7A), suggesting that the effect is specific to 5-azaCdR. This engraftment pattern was found again 8 and 12 weeks after transplantation (data not shown).
Loss of Mll5 sensitizes HSCs to DNA-demethylation–induced differentiation. 5-azaCdR treatment of Mll5−/− mice efficiently depletes HSCs from bone marrow. Mll5+/+ or Mll5−/− mice were injected subcutaneously with 5% DMSO (control), 5-azaCdR (1 mg/kg), or TSA (1 mg/kg) on days 1, 4, 6, 8, 11, and 13 (3 mice per genotype and drug). On day 21, bone marrow cells were harvested, retrovirally marked with YFP, and transplanted into wild-type recipients (6 mice per genotype and drug). (A) Mean and SD of percentage of treated donor-derived (YFP-positive) cells reconstituted in peripheral blood of wild-type recipients as analyzed after 4, 8 (data not shown), and 12 (data not shown) weeks by FACS analysis. (B) Mean and SD of the number of bone marrow cells in control or drug-treated mice at time of harvest (n = 3 mice per treatment per genotype). (C) Mean and SD of WBC counts in peripheral blood of treated mice at time of harvest as assessed by automated cell counting (n = 3 mice per treatment per genotype). (D) Immunophenotype of bone marrow cells in 5-azaCdR–treated mice at time of harvest. Chart shows mean and SD of cells positive for the respective surface markers (n = 3 mice per treatment per genotype). (E) Representative FACS blot (gating of viable cells) of Gr-1 and Mac-1–stained bone marrow cells of 5-azaCdR–treated mice at time of harvest. (F) Granulocyte progenitors in bone marrow of Mll5+/+ (n = 6) or Mll5−/− (n = 6) mice at time of harvest after intraperitoneal injection of 5-azaCdR 6 times over the course of 14 days and observation of the mice for additional 7 days. Chart shows mean and SD of number of 10-day G-CSF–responsive colony-forming cells formed per 105 bone marrow cells.
Loss of Mll5 sensitizes HSCs to DNA-demethylation–induced differentiation. 5-azaCdR treatment of Mll5−/− mice efficiently depletes HSCs from bone marrow. Mll5+/+ or Mll5−/− mice were injected subcutaneously with 5% DMSO (control), 5-azaCdR (1 mg/kg), or TSA (1 mg/kg) on days 1, 4, 6, 8, 11, and 13 (3 mice per genotype and drug). On day 21, bone marrow cells were harvested, retrovirally marked with YFP, and transplanted into wild-type recipients (6 mice per genotype and drug). (A) Mean and SD of percentage of treated donor-derived (YFP-positive) cells reconstituted in peripheral blood of wild-type recipients as analyzed after 4, 8 (data not shown), and 12 (data not shown) weeks by FACS analysis. (B) Mean and SD of the number of bone marrow cells in control or drug-treated mice at time of harvest (n = 3 mice per treatment per genotype). (C) Mean and SD of WBC counts in peripheral blood of treated mice at time of harvest as assessed by automated cell counting (n = 3 mice per treatment per genotype). (D) Immunophenotype of bone marrow cells in 5-azaCdR–treated mice at time of harvest. Chart shows mean and SD of cells positive for the respective surface markers (n = 3 mice per treatment per genotype). (E) Representative FACS blot (gating of viable cells) of Gr-1 and Mac-1–stained bone marrow cells of 5-azaCdR–treated mice at time of harvest. (F) Granulocyte progenitors in bone marrow of Mll5+/+ (n = 6) or Mll5−/− (n = 6) mice at time of harvest after intraperitoneal injection of 5-azaCdR 6 times over the course of 14 days and observation of the mice for additional 7 days. Chart shows mean and SD of number of 10-day G-CSF–responsive colony-forming cells formed per 105 bone marrow cells.
Next, we tested whether 5-azaCdR induced differentiation of HSCs in homozygous Mll5tm1Apa mice. The bone marrow cell number in both femurs of drug-treated mice at time of harvest was 2.4-fold greater in homozygous Mll5tm1Apa mice compared with wild-type mice treated with 5-azaCdR (P = .007; Figure 7B), whereas it was 1.6-fold lower in homozygous Mll5tm1Apa mice compared with wild-type mice treated with DMSO (P = n.s.; Figure 7B). Similarly, WBC counts in peripheral blood of drug treated mice at time of harvest were increased in homozygous Mll5tm1Apa mice compared with wild-type mice treated with 5-azaCdR (P = .05; Figure 7C) in contrast to a decrease in DMSO-treated mice. Interestingly, myeloid and lymphoid lineage marker–expressing cells were significantly more abundant in bone marrow of homozygous Mll5tm1Apa mice compared with wild-type mice when treated with 5-azaCdR (Figure 7D,E), but there was no difference in the other treatment groups (data not shown). G-CSF–responsive colony-forming cells were significantly increased in bone marrow of homozygous Mll5tm1Apa mice compared with wild-type mice treated with 5-azaCdR (P = .01; Figure 7F). These data suggest that, in the absence of Mll5, HSCs are effectively and specifically depleted by the DNA-methyltransferase inhibitor 5-azaCdR through the induction of differentiation.
Discussion
The MLL family of histone-modifying proteins is proving to be of increasing importance in regulating diverse aspects of hematopoiesis and development. To date, the functions of the most divergent member, MLL5, have remained obscure and, to address this, we have generated a loss-of-function allele at the mouse locus and examined the physiologic consequences in the hematopoietic system. Unlike Mll1 and Mll4,13,24 mice bearing a homozygous Mll5 loss-of-function allele are viable into adulthood, albeit with impairments of hematopoietic function.
Mendelian analysis shows that Mll5 is not absolutely required during embryogenesis up to embryonic day (E) 16.5 and that viable homozygous adults are capable of surviving up to 18 months of age. Because the loss of viability occurs only after E16.5, Mll5 does not appear to be required for definitive hematopoiesis. However, we did uncover a partially penetrant loss of viability between E16.5 and weaning. The mechanisms behind this loss of viability were not explored directly in this study; however, it is possible that some animals are lost to infection, as the result of the cellular immune deficit. During the analysis of surviving adult homozygous mice, we noticed that a significant number of homozygous animals develop moderate to severe eye infections. Analysis of neutrophil function showed that loss of Mll5 function is associated with a cell-autonomous impairment of the neutrophil response to bacterial endotoxin.
MLL5 was cloned from a candidate tumor suppressor region on chromosome 7q22 frequently deleted in patients with acute myeloid leukemia (AML) or myelodysplastic syndrome (MDS).17,25 Monosomy 7 or the deletion of the long arm of chromosome 7 are poor outcome prognostic markers in AML33-35 and MDS.36-38 In homozygous loss-of-function Mll5 mice, we discovered a combined maturation defect of the myeloid and erythroid lineage and a decreased HSC fitness. These are features partially reminiscent of human myelodysplasia. Some previously described mouse models of MDS exhibit more severe phenotypes with progression to early malignancy, for instance, with excess of blasts in bone marrow, enlarged spleen and liver, serial transplantation ability, and progression to AML in mice expressing mutant NRAS39 or in mice transgenic for NUP98-HOXD13.40 Other models have described milder phenotypes, including anemia, hyper- or hypocellularity in bone marrow, and dysplasia of erythroid, megakaryocytic, and myeloid lineage.41-45 Analogous to our findings, Moody et al42 found an increased sensitivity of hematopoietic progenitors to GM-CSF in Pten+/−/Ship−/− mice, whereas HSCs failed to reconstitute lethally irradiated mice. Thus, the phenotypes resulting from our Mll5 loss-of-function allele appear related to previously described MDS models with milder phenotypes and may therefore best be described as a hematologic syndrome with several features of low-risk MDS.
MLL5 has been implicated as a tumor suppressor because one allele often is deleted in AML and MDS patients with poor prognosis.17 In the absence of MLL5, we did not observe spontaneous tumors or leukemias, and constitutive expression of oncogenic HOX-fusion genes in bone marrow of homozygous Mll5 loss-of- function–bearing mice did not provoke any leukemia. Greater expression of MLL5 also has been associated with poor prognosis in patients with core-binding factor AML46 and androgen-resistant prostate cancer.47 The mechanistic relationship to leukemias remains uncertain; however, the myeloid maturation block found in Mll5-deficient mice could potentially contribute to the pathogenesis of leukemia, in collaboration with self-renewal enhancing oncogenes. Our data suggest that loss of Mll5 function has a moderate effect on the repopulation activity of normal and in vitro expanded short-term repopulating HSCs rather than long-term repopulating HSCs. Cell-cycle analysis showed that a larger proportion of hematopoietic progenitor cells from homozygous Mll5tm1Apa compared with wild-type mice is cycling, which is consistent with an observation that constitutive MLL5 expression has a negative effect on cell cycle48 in HEK293T cells. However, the cell-cycle effects in our knockout mice are opposite to those recently described in vitro, where small-interfering RNA (siRNA) knockdown of MLL5 appears to have a negative effect on cell cycle.49 This may suggest MLL5 may have different effects on the cell cycle depending on cell type. Enhanced cell cycling through loss of Mll5 could explain the reduced engraftment we found in primary, but not in secondary, transplants. In our experiments, bone marrow cells for primary transplantation were cultured for 6 days in vitro for plasmid transduction. During this period, a larger proportion of homozygous Mlltm1Apa long-term engrafting cells may have entered cell cycle and differentiated compared with wild-type cells. However, bone marrow cells were not cultured in vitro for secondary transplantation. Thus, loss of Mll5 appears to have its greatest effects on hematopoietic progenitor cells and differentiated cells but less on long-term repopulating HSCs.
Strikingly, treatment of homozygous Mll5 loss-of-function mice with a DNA-demethylating agent resulted in complete loss of repopulation activity, accumulation of hematopoietic progenitors and a dramatic increase of mature cells in the bone marrow. Treatment with an HDAC inhibitor did not show these effects suggesting that our observation is specific for DNA demethylation.
Taken together, these observations suggest that Mll5 regulates hematopoietic differentiation and/or HSC renewal through mechanisms that involve the initiation and/or maintenance of DNA methylation, thus identifying Mll5 as another member of the chromatin associated proteins that influence CpG methylation regulated gene expression. The role of other Mll proteins in epigenetic regulation has emerged through a combination of biochemical and genetic studies. The SET domain of Mll1 was found to have histone methyltransferase activity specific for histone H3 Lys-4 (K4).7,8 H3K4 trimethylation, which is known to be associated with gene expression,50 and binding of Mll to the Hoxa9 promoter correlated with the expression of Hoxa9.7 Although the core enzymatic functions of MLL proteins are thought to involve histone modification, several lines of evidence suggest these proteins also have a role in regulating DNA methylation marks, for example recently it has been shown that Mll1 binds to CpG islands protecting them from methylation and gene silencing.51
The precise mechanism by which Mll5 affects DNA methylation was not addressed in this study. However, the observation that 5-azaCdR appears to induce differentiation (and loss of HSCs) suggests that Mll5 is, in contrast to Mll1, required for maintenance of methylation at critical stages of hematopoiesis.
In the last few years, 5-azaCdR became an important treatment option in patients with MDS and AML, with response rates of 20%-70%.52-54 Interestingly, in MDS patients the karyotype of monosomy 7 or del7 was associated with an increased response rate to 5-azaCdR.55 Heterozygosity for Mll5 may reduce the activity of MLL5, possibly allowing for an increased efficacy of 5-azaCdR in leukemic stem cell differentiation, as we have found it in this study in normal HSCs. This association warrants further investigation of MLL5 as a predictive marker for 5-azaCdR response in MDS/AML and possibly a therapeutic target to further increase response rates.
In summary, we demonstrate that Mll5 is a divergent member of the Mll gene family and that the loss of Mll5 impairs neutrophil function and competitive repopulation capacity of HSCs and dramatically enhances sensitivity to 5-azaCdR–induced HSC differentiation.
An Inside Blood analysis of this article appears at the front of this issue.
The online version of this article contains a data supplement.
The publication costs of this article were defrayed in part by page charge payment. Therefore, and solely to indicate this fact, this article is hereby marked “advertisement” in accordance with 18 USC section 1734.
Acknowledgments
We thank the Center for Translational and Applied Genomics (CTAG), Vancouver, BC, for preparing tissue sections and Gulisa Turashvili for assistance with pathology and image capture. We thank Katrin Mooslehener for assistance with Southern blotting and Gyeongsin Park for assistance with image acquisition.
This study was supported by grants from the Terry Fox Foundation (Vancouver, BC); the BC Cancer Foundation (Vancouver, BC); and the European Framework V program. M.H. is supported by the Deutsche Forschungsgemeinschaft Germany (grant number He 5240/1-1). S.A.A. is supported by a Canada Research Chair in Molecular Oncology.
Authorship
Contribution: M.H., D.B.Y., R.K.H., and S.A.A. designed the research; M.H., D.B.Y., and M.L. performed the research; T.R.d.A., R.T., A.T., and M.C. provided technical assistance; M.H., D.B.Y., M.L., R.K.H., and S.A.A. analyzed the data; M.H., D.B.Y., R.K.H., and S.A.A. wrote the paper; S.M. assisted with statistical analysis; and J.D. and B.C. assisted with generation of the mouse allele. All authors checked the final version of the manuscript.
Conflict-of-interest disclosure: The authors declare no competing financial interests.
Correspondence: Samuel Aparicio, BM, BCh, PhD, FRCPath, Department of Molecular Oncology, British Columbia Cancer Agency, 675 West 10th Avenue, Vancouver, BC V5Z 1L3; e-mail: saparicio@bccrc.ca; or R. Keith Humphries, MD, PhD, Terry Fox Laboratory, British Columbia Cancer Agency, 675 West 10th Avenue, Vancouver, BC V5Z 1L3; e-mail: khumphri@bccrc.ca.
References
Author notes
*M.H. and D.B.Y. contributed equally to this work.



 ) bone marrow cells, automated cell counts 8 weeks after transplantation. (E) Mean and SD of reconstituted hematopoietic cells in bone marrow of Mll5−/− recipients transplanted with Mll5+/+ (n = 4, □) or Mll5−/− (n = 2,
