Abstract
Premature termination codon (PTC) mutations are due to insertion or deletion of nucleotides causing a frameshift and premature termination codon in RNA. These transcripts are degraded by the nonsense-mediated decay pathway and have a very short half-life. We used a microarray technique to screen for genes that up-regulate their RNA signal upon nonsense-mediated decay pathway blockade in chronic lymphocytic leukemia (CLL) specimens and identified an E-cadherin transcript with PTC. Sequencing revealed an aberrant E-cadherin transcript lacking exon 11, resulting in a frameshift and PTC. The aberrant E-cadherin transcript was also identified in normal B cells, but occurred at a much lower level compared with CLL cells. In CLL specimens, E-cadherin expression was depressed more than 50% in 62% cases (relative to normal B cells). By real-time polymerase chain reaction analysis, the relative amounts of wild-type transcript inversely correlated with amounts of aberrant transcript (P = .018). Ectopic expression of E-cadherin in CLL specimens containing high amounts of aberrant transcript resulted in down-regulation of the wnt–β-catenin pathway reporter, a pathway known to be up-regulated in CLL. Our data point to a novel mechanism of E-cadherin gene inactivation, with CLL cells displaying a higher proportion of aberrant nonfunctional transcripts and resulting up-regulation of the wnt–β-catenin pathway.
Introduction
Chronic lymphocytic leukemia (CLL) is the most common chronic leukemia with an extremely variable clinical course. Some patients survive only a few months, whereas others have stable disease for years.1,2 In addition to clinical staging by the Rai system,3 abnormal expression of ζ-associated protein 70,4 CD38 expression,5 and mutation status of the immunoglobulin heavy chain V genes6 have been correlated with prognosis. Identification of novel genes mutated in CLL is important for prognostic purposes, to understand the biology of the disease and identification of targets and pathways for therapeutic intervention.
Premature termination codons (PTCs) are genetic alterations that may be important in loss-of-function of tumor suppressor genes.7,8 PTCs prematurely terminate transcription, leading to expression of a truncated, nonfunctional mRNA. This truncated RNA is rapidly degraded by the nonsense-mediated RNA degradation (NMD) pathway. It has been estimated that up to 30% of mutations causing human disorders are due to PTC.7 Two striking examples are mutations in the ATM gene that cause ataxia-telangiectasia9 and mutations in the breast cancer-associated, BRCA1 gene.10 The NMD pathway uses trans factors and is dependent on protein synthesis for its function.11 Thus, it has been recently demonstrated11,12 that the protein synthesis inhibitor, emetine, paralyzes the NMD, prevents decay of mutated, truncated transcripts, and allows such mRNAs to accumulate within the cell. By combining emetine treatment with microarray technology, one can theoretically screen the entire genome to identify genes that contain PTCs. Indeed, the potential of such a powerful technology has recently been demonstrated11,12 in which PTCs in specific genes were identified in human cancer cell lines, by demonstrating a marked increase in RNA signal intensity upon emetine treatment. Our experiments using this strategy in CLL specimens resulted in the identification of a PTC mutation in the E-cadherin gene. Further characterization revealed alternative splicing as the mechanism of this PTC formation. Our data also support a role of alternative splicing in E-cadherin silencing with resulting up-regulation of the wnt cascade.
Methods
Cell culture
CLL cells were obtained from patients at the West Los Angeles Veterans Administration Hospital Hematology Clinic after informed consent and institutional approval in accordance with the Declaration of Helsinki. Peripheral blood mononuclear cells were isolated by Ficoll gradient and stored in liquid nitrogen. Cells were thawed and cultured in RPMI and 10% fetal bovine serum for 48 hours before emetine treatment. Emetine at 100 μg/mL was added to cells in a 6-well plate at a density of 106 cells/mL. For normal B-cell control samples, peripheral blood was obtained from normal donors and B lymphocytes isolated with a negative isolation kit (Dynal Biotech; Invitrogen), followed by emetine treatment in identical fashion to CLL cells. In the combined emetine and actinomycin D treatment, actinomycin D was added at a concentration of 2 μg/mL, together with emetine.
Microarray analysis
Total RNA for the microarray analysis was isolated by TRIzol reagents (Invitrogen), followed by purification by RNA columns (QIAGEN). Microarray analysis was performed with equal amounts of total RNA for untreated and emetine-treated samples. cRNA was obtained as per standard protocols and hybridized to the Affymetrix chip 133A (Affymetrix). Hybridization was performed at the University of California core facility, and data were analyzed by the Microsoft Excel software program. The microarray analysis data for 2 normal human B-cell preparations were averaged and then used to calculate the nonsense transcript enrichment index (NTEI) score for each probe set on the array. The NTEI score is the ratio of up-regulation of the signal intensity on emetine treatment of CLL cells of a particular probe set, divided by the ratio of up-regulation of signal intensity of normal nonmalignant B cells for the same probe set. All microarray data can be found in the Gene Expression Omnibus (GEO) public database under accession GSE18026.
Reverse transcription–polymerase chain reaction and sequencing
Total RNA from cells was prepared at different time points using the RNA columns from QIAGEN. cDNA was synthesized with oligo-dT primer and reverse transcriptase (Invitrogen). Primer sequences mentioned in the report are available upon request. The polymerase chain reaction (PCR) fragments were cloned in a vector (TOPO-TA cloning; Invitrogen) and then sequenced with ABI PRISM sequencer at the University of California core facility.
Rent 1 small interfering RNA
A small interfering RNA (siRNA) with the sequence GAUGCAGUUCCGUCCA UUdTdT targeting the Rent 1 mRNA was obtained from Dharmacon. This siRNA or a control sequence was transfected into a B-cell line, Raji (106 cells), with the Amaxa protocol (Nucleofector kit V, program M013) at a concentration of 50nM. Cells were analyzed for Rent 1 expression by real-time reverse transcription (RT)–PCR analysis at 48-hour time point with amplification of Rent 1 cDNA and actin. The fold decrease in Rent 1 expression was calculated by the method of Pfaffl.13 The same cDNA was also analyzed for E-cadherin transcripts with primers flanking the exon 11 of the gene. The PCR primers are 5′-GGATGTGCTGGATGTGAATG and 3′-CCCCGTGTGTTAGTTCTGCT.
Real-time PCR
E-cadherin expression in CLL cells is analyzed by a real-time PCR experiment. The 5′ primer GGATGTGCTGGATGTGAATG localizes to exon 10 of the E-cadherin gene. The 3′ primer CACATCAGACAGGATCAGCAGAA localizes to the exon 12. The TaqMan probe 10-11 (TAACATATCGGATTTGGAGAGAC), determining the wild-type E-cadherin transcript level, binds to the junction of exon 10–exon 11. The expression level of the skipped or aberrant transcript (transcript lacking exon 11) is determined by the same set of PCR primers as mentioned above with a TaqMan probe 10-12 (CAGAAAATAACGTTCTCCAGTTG) binding the exon 10–exon 12 junction. Real-time PCR for actin expression was used as a control with reagents from Applied Biosystems. Relative expression was determined by the method of Pfaffl.13
Reporter assay
Wnt activity in CLL specimens was determined by a luciferase reporter assay (Superarray kit). This consisted of a reporter construct expressing firefly luciferase with T cell–specific factor/lymphoid enhancer-binding factor (TCF/LEF) binding sites in the promoter. A negative control vector was identical except for absence of TCF/LEF binding sites. CLL cells were thawed, cultured in complete medium for 24 hours, and then transfected by Amaxa protocol (Nucleofector kit V, program U07) with luciferase detection 40 hours after transfection. For 106 cells, 1 μg reporter plasmid was cotransfected with either 1 μg of E-cadherin expression vector (obtained from Open Biosystems) or 1 μg of empty vector. A constitutively active Renilla luciferase construct was also transfected to control for transfection efficiency. Data are expressed as firefly to Renilla ratios for reporter expression.
Results
Analysis of emetine response in CLL cells
To identify genes that have a PTC mutation in CLL cells, 5 CLL specimens were initially selected for emetine treatment and microarray analysis. These patients all had monoclonal leukemic CD19-positive B cells that coexpressed CD5. By flow cytometry, the percentage of lymphocytes that were leukemic in these 5 cases ranged from 80% to 95%. In our initial experiments, the conditions of emetine treatment were as described before by Noensie and Dietz11 and Ionov et al.12 Cells were treated with 100 μg/mL emetine for 8 hours, followed by RNA isolation and microarray analysis. Both emetine-treated and untreated cells were analyzed to identify the genes whose transcripts were up-regulated by emetine. For control purposes and to calculate the NTEI score for each probe set (see “Microarray analysis”), peripheral lymphocytes were obtained from healthy donors and their B cells were isolated by negative selection with magnetic beads. By flow cytometric analysis, the selected cells consisted of more than 70% CD19-positive cells. After similar emetine treatment, RNA was harvested, reverse transcribed, and labeled for microarray analysis.
There are a total of 22 215 probe sets on the chip 133A (Affymetrix), which were interrogated by data analysis. The NTEI was calculated as the degree of emetine-induced up-regulation in CLL cells (ie, fold increase) divided by the degree of up-regulation in normal control B-cell preparations. As with prior studies,11 more than 10-fold up-regulation of a probe set with the NTEI method was considered a significant up-regulation after exposure to emetine. When we averaged the degree of up-regulation for the probe sets across all 5 patients, 650 were found to be more than 10-fold up-regulated (supplementary file 1; available on the Blood website; see the Supplemental Materials link at the top of the online article). One of the genes up-regulated by emetine treatment in all 5 patients tested was E-cadherin (it had the 13th highest NTEI). E-cadherin is a well-characterized tumor suppressor gene in several tumor model systems14 and down-regulates the wnt-catenin pathway,15 which is known to be hyperactive in CLL cells.16 In addition, when E-cadherin expression in untreated CLL cells (ie, no emetine) from our first 5 patients was compared with expression in untreated normal B lymphocytes (n = 5), this gene ranked as one of the 50 most down-regulated genes. Thus, this gene was selected for further study.
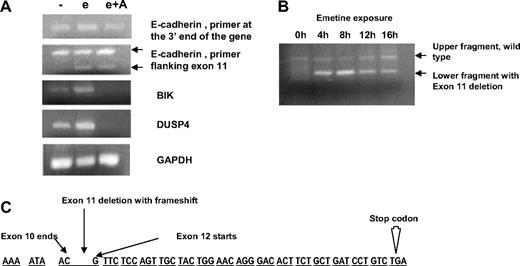
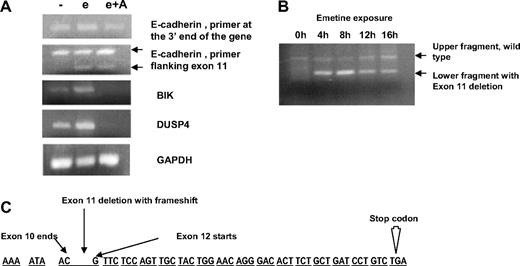
Previous reports11,12 have indicated that several genes that are up-regulated with emetine treatment are secondary to the stress of translational inhibition. To exclude the possibility that E-cadherin is a stress response gene, we performed experiments with actinomycin D in conjunction with emetine. Actinomycin D is a transcriptional inhibitor and should prevent emetine stress responses that are due to transcriptional up-regulation of genes. CLL specimens from 2 patients were exposed to media, emetine alone, or emetine plus actinomycin D for 8 hours. Total RNA was obtained, and RT-PCR analysis was performed. Results from one of the patients, shown in Figure 1A, indicate that the emetine-induced up-regulation of E-cadherin RNA is not affected by coexposure to actinomycin D. When a primer set was used that amplifies the 3′ end of the E-cadherin gene (top panel), the increased signal resulting from emetine exposure (3×-fold increase) is not ablated by actinomycin D. When a different primer set was used flanking the exon 11 of the E-cadherin gene (second panel), we noticed an additional band that is seen when cells are treated with emetine or emetine in combination with actinomycin D. As is discussed below, this additional band represents a truncated transcript with a PTC. Similar results were seen in a second CLL specimen (data not shown). In contrast, addition of actinomycin D ablates the emetine-induced up-regulated expression of the BIK17 and DUSP418 genes, 2 potentially stress-induced genes (Figure 1). On further evaluation, these 2 latter genes did not harbor PTCs in their coding sequence. These data indicate that, in contrast to BIK and DUSP4, the emetine-induced up-regulation of E-cadherin RNA signal is not due to a transcriptional stress response.
Analysis of exon 11-skipped transcript. (A) RT-PCR analysis of untreated chronic lymphocytic leukemia (CLL) cells and cells treated with emetine (e) or emetine plus actinomycin D (e + A) and assayed for expression of E-cadherin, BIK, and DUSP4. In the top panel, E-cadherin cDNA was amplified with primers at the 3′ end of the gene, In the bottom panel, the E-cadherin cDNA is amplified by primers in the region of exons 10 and 12. The upper points toward the band of expected size, and the lower points toward a DNA fragment lacking exon 11. The next 2 panels show amplification of BIK and DUSP4. Glyceraldehyde-3-phosphate dehydrogenase amplification shown as a control. (B) Time course of emetine-induced up-regulation of E-cadherin RNA. CLL cells treated with emetine for 0, 4, 8, 12, and 16 hours. Primers in the region of exons 10 and 12 were used for amplification of E-cadherin cDNA and give rise to 2 fragments that differ by 146 base pairs in emetine-treated cells due to exon 11 deletion. (C) Sequence of the E-cadherin gene in the region of interest. There is an exon 11 deletion resulting in a frame shift and PTC codon.
Analysis of exon 11-skipped transcript. (A) RT-PCR analysis of untreated chronic lymphocytic leukemia (CLL) cells and cells treated with emetine (e) or emetine plus actinomycin D (e + A) and assayed for expression of E-cadherin, BIK, and DUSP4. In the top panel, E-cadherin cDNA was amplified with primers at the 3′ end of the gene, In the bottom panel, the E-cadherin cDNA is amplified by primers in the region of exons 10 and 12. The upper points toward the band of expected size, and the lower points toward a DNA fragment lacking exon 11. The next 2 panels show amplification of BIK and DUSP4. Glyceraldehyde-3-phosphate dehydrogenase amplification shown as a control. (B) Time course of emetine-induced up-regulation of E-cadherin RNA. CLL cells treated with emetine for 0, 4, 8, 12, and 16 hours. Primers in the region of exons 10 and 12 were used for amplification of E-cadherin cDNA and give rise to 2 fragments that differ by 146 base pairs in emetine-treated cells due to exon 11 deletion. (C) Sequence of the E-cadherin gene in the region of interest. There is an exon 11 deletion resulting in a frame shift and PTC codon.
To identify a possible PTC in the E-cadherin transcript, we performed a RT-PCR analysis on untreated and emetine-treated cells. Primers specific for the E-cadherin gene were designed to amplify the full cDNA. A consistent finding was the appearance of an additional smaller band only in the emetine-treated samples when a PCR was performed by primers flanking exon 11. In a time course experiment (Figure 1B), this additional band first appeared after 4 hours of emetine, increased slightly at 8 hours, and then decreased in intensity at 12 and 16 hours of emetine exposure. Sequencing of DNA fragment revealed a complete loss of exon 11 (146 base pairs) with exon 10 joined to exon 12. This loss of exon 11 resulted in a frame shift with an in-frame PTC in exon 12 (Figure 1C). This suggested that the increase in E-cadherin RNA signal on the microarray after emetine treatment is due to the stabilization of this aberrant truncated transcript with a PTC that is otherwise degraded by the NMD pathway. This time course data (Figure 1B) on the stabilization of PTC-containing transcripts with emetine treatment are also similar to previous reports that show maximum stabilization after 8 hours.11 No mutation in the coding or flanking intronic regions of exon 11 was identified that could result in a PTC.
Inactivation of Rent 1
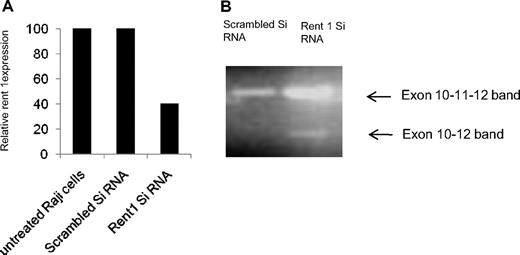
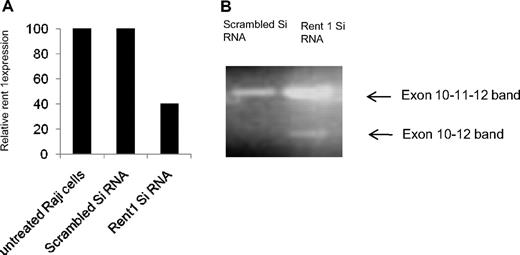
Stabilization of the aberrant E-cadherin transcript with emetine, a translational inhibitor, suggests that this transcript is degraded by the NMD pathway. To confirm this, we used another strategy of inactivating Rent 1, an important protein involved in the NMD pathway.19 We first identified an identical exon 11 skipping of E-cadherin with resulting PTC in the Raji B-cell line. As Raji cells are more readily transfectable for gene silencing compared with CLL cells, we silenced Rent 1 in this cell line. Raji cells were transfected with Rent siRNA using the Amaxa nucleofector system (80% transfection efficiency). As shown in Figure 2A, this resulted in 60% reduction in Rent 1 gene expression in Raji cells compared with scrambled control siRNA, as determined by real-time PCR analysis (adjusted to actin control, 48 hours posttransfection). We then performed PCR analysis on the same cDNA with primers flanking exon 11 of the E-cadherin gene (described in “Real-time PCR”). Figure 2B shows that, in addition to amplification of the normal E-cadherin band, silencing of Rent 1 results in PCR amplification of an additional smaller band. Upon isolation and sequencing of the lower band, we identified that exon 11 was skipped from this transcript and that exon 10 was joined to exon 12, similar to the lower band seen upon emetine treatment of primary CLL samples (Figure 1B). The appearance of this truncated transcript when the NMD pathway is inhibited by Rent 1 knockdown further supports the notion that this aberrant E-cadherin RNA is degraded by the NMD.
Inactivation of Rent 1. (A) Using a siRNA against Rent 1, this gene was inactivated in Raji cells, a B-cell line. The bar diagram shows relative expression of Rent 1 RNA by real-time RT-PCR analysis in untreated cells, Raji cells transfected with scrambled siRNA, or with Rent 1 siRNA (relative to actin expression). (B) The same cDNA material was analyzed by PCR with primers in exons 10 and 12. An exon 11–skipped transcript is seen in the Rent 1–transfected Raji cells, as indicated by the lower ←.
Inactivation of Rent 1. (A) Using a siRNA against Rent 1, this gene was inactivated in Raji cells, a B-cell line. The bar diagram shows relative expression of Rent 1 RNA by real-time RT-PCR analysis in untreated cells, Raji cells transfected with scrambled siRNA, or with Rent 1 siRNA (relative to actin expression). (B) The same cDNA material was analyzed by PCR with primers in exons 10 and 12. An exon 11–skipped transcript is seen in the Rent 1–transfected Raji cells, as indicated by the lower ←.
Quantification of wild-type and aberrant transcript
Using our extremely sensitive RT-PCR assay, we were able to identify a small amount of aberrant E-cadherin transcript (exon 10–exon 12) in emetine-treated normal PBMC or isolated normal B lymphocytes. On RT-PCR analysis, these nonmalignant cells appeared to have a much smaller proportion of the aberrant transcript than CLL specimens. To further address this issue with accurate quantification, we embarked on a series of experiments comparing the level of E-cadherin expression and the presence of aberrant transcript (exon 11 skipped) in CLL versus normal B cells by real-time PCR.
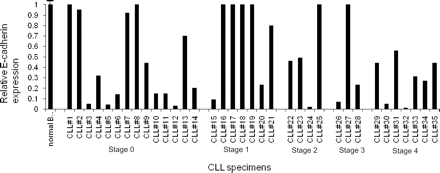
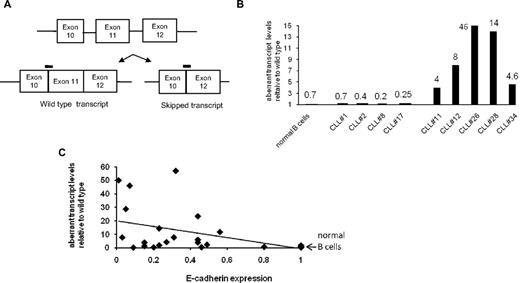
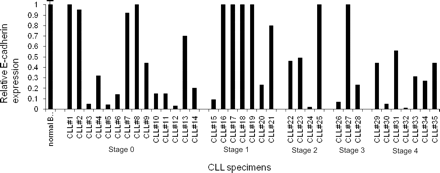
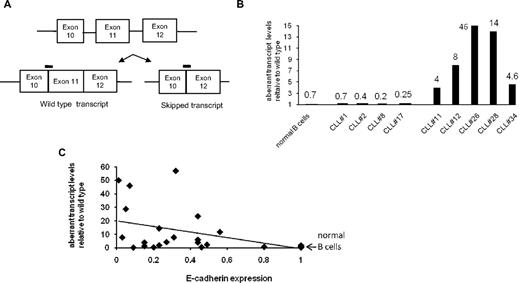
CLL cells were isolated from patients before treatment. The total white blood cell count in CLL patients ranged from 15 000 to 140 000. Cells were initially analyzed for wild-type E-cadherin expression by real-time PCR analysis (Figure 3). The schematic diagram in Figure 4A shows the TaqMan probe (dark line), which recognizes the junction of exon 10–exon 11, and this signal was identified as the wild-type E-cadherin RNA expression. Data shown in Figure 3 are wild-type E-cadherin expression normalized to actin and relative to the expression in normal human peripheral blood B cells (n = 4; Δ cycle threshold [CT] wild type [average exon 10–exon 11 CT minus actin CT]). A greater than 50% decrease in E-cadherin expression was identified in 62% of CLL samples. This suggests that E-cadherin loss is a frequent and important genetic change in CLL.
E-cadherin expression in CLL specimens. Total E-cadherin expression was determined by real-time PCR analysis in 35 different CLL specimens from patients. The PCR primers and probe used for analysis detect the junction of exon 10-11. The bar diagram is a relative expression of E-cadherin in CLL specimens compared with normal peripheral blood B cells (n = 4) and adjusted to actin. On the x-axis, CLL specimens are grouped according to Rai clinical stage.
E-cadherin expression in CLL specimens. Total E-cadherin expression was determined by real-time PCR analysis in 35 different CLL specimens from patients. The PCR primers and probe used for analysis detect the junction of exon 10-11. The bar diagram is a relative expression of E-cadherin in CLL specimens compared with normal peripheral blood B cells (n = 4) and adjusted to actin. On the x-axis, CLL specimens are grouped according to Rai clinical stage.
Relative amount of skipped transcript in CLL specimens. (A) Schematic showing the binding sites of the 2 probes that detect different E-cadherin transcripts. (B) Bar diagram showing selected examples of relative levels of aberrant transcript in normal B cells and CLL specimens relative to their wild-type expression. Numbers above the bars represent aberrant E-cadherin transcript levels. (C) Dot-plot analysis of normal B cells and 26 CLL specimens with E-cadherin expression levels on x-axis and relative aberrant transcript expression on the y-axis. Significant statistical correlation with P = .018.
Relative amount of skipped transcript in CLL specimens. (A) Schematic showing the binding sites of the 2 probes that detect different E-cadherin transcripts. (B) Bar diagram showing selected examples of relative levels of aberrant transcript in normal B cells and CLL specimens relative to their wild-type expression. Numbers above the bars represent aberrant E-cadherin transcript levels. (C) Dot-plot analysis of normal B cells and 26 CLL specimens with E-cadherin expression levels on x-axis and relative aberrant transcript expression on the y-axis. Significant statistical correlation with P = .018.
We next compared expression of the exon 10–exon 11 (wild-type transcript) with the aberrant transcript (exon 10–exon 12) in normal B cells and CLL specimens. This was done by specific probes that bind to the junction of either exon 10–exon 11 or exon 10–exon 12. Preliminary experiments were performed to confirm the validity of the real-time PCR signal, and the 2 probes were found to be specific (TaqMan probes 10-11 and 10-12) and the 2 reactions were of similar efficiencies. A Δ CT wild type (average exon 10–exon 11 CT − actin CT), as described in “Results” and Δ CT aberrant (average exon 10–exon 12 CT − actin CT) were calculated for normal B cells and CLL specimens. To find out the relative abundance of the aberrant transcript, we determined the difference between the 2 CT values. In the case of normal B cells, the wild-type transcript is more abundant and has a lower CT value compared with the aberrant transcript, which is less abundant and thus with a higher CT value. We observed a 7-cycle difference between the 2 CT values in normal B cells, and thus, estimate the aberrant transcript to be approximately 0.8% or less than 1% of the wild-type transcript. A similar analysis was performed with CLL specimens, and Figure 4B shows representative examples of normal B cells and CLL specimens with normal (CLL 1, 2, 8, and 17) and low E-cadherin expression (CLL 11, 12, 26, 28, and 34). CLL specimens with normal E-cadherin expression demonstrate a similar level of the aberrant transcript compared with normal B cells (0.2%-0.7%). However, in the CLL specimens with low E-cadherin expression (data from Figure 3), the cycle difference between the aberrant and wild-type CT values is lower, thus resulting in higher percentages of aberrant transcript (Figure 4B) relative to the wild-type transcript.
In Figure 4C, a dot-plot analysis is shown for 26 CLL specimens correlating the E-cadherin expression level (x-axis) to the relative abundance of the aberrant transcript. Data from normal B cells is shown with an arrow; these cells have a normal E-cadherin expression and the aberrant transcript is less than 1%. The trendline supports the notion that CLL specimens with lower E-cadherin expression also have higher amounts of aberrant transcript. This correlation was statistically significant with a P value of .018. We also performed a similar analysis in emetine-treated CLL specimens. CLL cells and normal B cells were treated with emetine for 8 hours, as described in “Methods,” and then analyzed by real-time PCR analysis. Similar results (as shown in Figure 4C) were obtained when the aberrant transcript data were correlated to the E-cadherin expression data (data not shown). Collectively, these data demonstrate that although exon 11 skipping and formation of an aberrant transcript occur in nonmalignant B lymphocytes, the skipping occurs at a much higher frequency in CLL cells and contributes to loss of E-cadherin expression in this malignancy.
Wnt activation in CLL cells
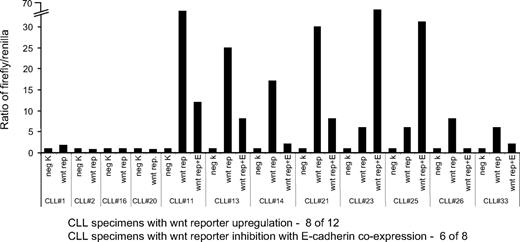
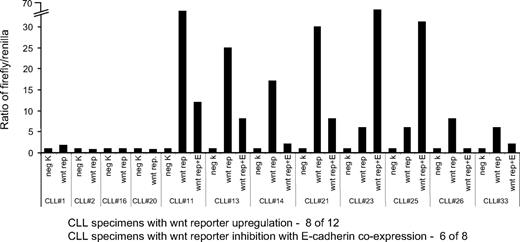
E-cadherin plays an important role in the regulation of the wnt signaling pathway.15 It does so by binding to β-catenin, preventing its translocation to the nucleus and its subsequent induction of transcriptional response due to its interaction with the TCF/LEF. As CLL cells are known to have an activated wnt signaling pathway,16 we specifically analyzed whether loss of E-cadherin expression affects the wnt pathway in CLL cells. To study this, we performed reporter assays with a construct containing TCF/LEF binding sites. CLL cells were transfected with these constructs along with an E-cadherin expression plasmid or empty vector (Figure 5). CLL specimens were transfected with either the negative control (construct lacking TCF/LEF binding sites), the wnt reporter+ empty vector construct, shown as “wnt rep” in Figure 5, or wnt reporter and E-cadherin expression plasmid shown as “wnt rep + E-cadherin.” Of the 12 CLL specimens tested, we noticed a wnt reporter up-regulation in 8 CLL specimens. The activity of the wnt reporter varied between a 5- and 70-fold up-regulation compared with the negative control transfection group, confirming previous reports that the pathway is frequently up-regulated in CLL cells.16 Of 8 specimens with up-regulated wnt reporter activity, ectopic E-cadherin expression significantly inhibited the reporter in 6 specimens, providing evidence that in a significant proportion of CLL specimens, the high wnt reporter activity is secondary to loss of E-cadherin expression.
Wnt reporter activity in CLL specimens. Bar diagram with wnt reporter activity. Each CLL sample was transfected with the negative control vector (neg K, firefly luciferase lacking TCF/LEF binding sites), or the wnt reporter (wnt rep, wnt reporter vector with TCF/LEF binding sites and empty vector), or the wnt reporter plus E-cadherin expression vector (wnt rep + E). Constitutively expressing Renilla luciferase was cotransfected in all of the groups as a control for transfection efficiency. Reporter expression of the negative control (firefly to Renilla ratio) was arbitrarily kept as 1 unit for each CLL case.
Wnt reporter activity in CLL specimens. Bar diagram with wnt reporter activity. Each CLL sample was transfected with the negative control vector (neg K, firefly luciferase lacking TCF/LEF binding sites), or the wnt reporter (wnt rep, wnt reporter vector with TCF/LEF binding sites and empty vector), or the wnt reporter plus E-cadherin expression vector (wnt rep + E). Constitutively expressing Renilla luciferase was cotransfected in all of the groups as a control for transfection efficiency. Reporter expression of the negative control (firefly to Renilla ratio) was arbitrarily kept as 1 unit for each CLL case.
Discussion
Our study defines a new mechanism of E-cadherin gene inactivation in CLL in which the proportion of the alternatively spliced (nonfunctional RNA) is increased. This, in turn, results in fewer correctly spliced transcripts and decreased E-cadherin expression. This alternative splicing also occurred in normal nonmalignant B lymphocytes, but the degree of exon 11 splicing in CLL was markedly up-regulated. Heightened aberrant splicing also occurred in the Raji B-cell lymphoma line. Additional studies on primary lymphoma specimens will be required to assess whether aberrant E-cadherin splicing is a hallmark of malignant B-cell lymphoproliferative disease in general or restricted to CLL.
We used a powerful genome-wide microarray technique to identify potential tumor suppressor genes in CLL whose expression is lost because of PTC mutations. The mutant transcripts are rapidly degraded by the NMD pathway. The ability of emetine to paralyze this pathway allows a screening for potential PTCs by identifying an up-regulated accumulation of mutant transcripts on the microarray.11,12 In addition to enhanced accumulation of PTC transcripts due to the paralysis of the NMD pathway, a significant number of genes will have their transcript levels increased due to stress responses secondary to emetine exposure. To deal with these false-positive up-regulations, we used the screening strategy of Ionov et al,12 in which actinomycin D is exploited to prevent transcriptional activation of such stress genes. Our results from applying this strategy to 3 emetine up-regulated genes suggest it is an efficient, easy method of further focusing on genes most likely to contain true PTC. Two genes whose emetine-induced up-regulation of transcript level was abrogated by actinomycin D, namely BIK and DUSP4, contained no PTC mutations in the coding sequences. In contrast, actinomycin D had no effect on emetine-induced up-regulated E-cadherin expression, and subsequent sequencing confirmed a PTC in the E-cadherin RNA.
The wnt pathway is a progrowth and survival cascade initiated by expression of wnts. After wnt binding to their cognate receptors (frizzled), a signal pathway is initiated with resulting β-catenin activation and gene expression resulting from a β-catenin–TCF/LEF interaction. E-cadherin is a negative regulator of the pathway, as its cytoplasmic tail binds and prevents β-catenin translocation to the nucleus.20-22 The wnt pathway is reported to be up-regulated in CLL cells,16,23 and enhanced expression of the wnts and wnt receptors along with promoter methylation of negative regulators of the pathway23 have been suggested as explanations for the up-regulated cascades. Our data suggest loss of E-cadherin expression as an additional mechanism of wnt pathway up-regulation in CLL cells.
Previous reports have analyzed the wnt pathway in CLL cells via indirect approaches, for example, high expression of lymphoid-enhancing factor-1 in the CLL cells.16 To determine the level of wnt pathway activation, we analyzed reporter activity in the CLL cells, which provides direct evidence of wnt pathway activation and compares the status of the pathway in different CLL specimens. In our assay, this pathway was constitutively activated in the 8 of 12 CLL specimens tested with variable levels of up-regulation. Interestingly, the 3 of the 4 CLL specimens with no wnt reporter activity in our assay have normal E-cadherin expression, indicating that the loss of E-cadherin expression is important for wnt up-regulation. Coexpression of E-cadherin reduced the activity of the wnt reporter in 6 of 8 CLL specimens, signifying the role of E-cadherin loss in wnt activation.
The significant inverse correlation between E-cadherin expression and the aberrant transcript levels (Figure 4C) suggests that enhanced PTC generation in malignant B lymphocytes significantly contributes to inactivation of this potential tumor suppressor gene. This method of analysis accurately compares the aberrant transcript of a CLL specimen with its own wild-type transcript. The biologic significance of the aberrant transcript is the resulting decrease in the proportion of correctly spliced transcripts and loss of E-cadherin expression. Aberrant splicing with use of alternate exons is known to occur in different genes, which result in change in the function of protein. However, in this example of alternative splicing, the aberrant RNA species is subject to NMD pathway degradation (Figure 1).
Alternative splicing is important for expressing a diverse set of proteins in normal cells, and occasionally these proteins have antagonistic actions. In addition, alterations in splicing may occur as part of the malignant phenotype.24 For example, the Bcl-x transcript is alternatively spliced to produce the antiapoptotic Bcl-xL or the proapoptotic Bcl-xs proteins.25 Cancer cells often up-regulate the antiapoptotic Bcl-xL isoform, which is associated with reduced sensitivity to chemotherapeutic drugs, illustrating the ability of the malignant cell to modulate alternative splicing to its advantage. Other examples are alternative splicing occurring in tumor suppressor genes, such as BRCA1/2,26 WT1,27 and mdm2,28 resulting in their inactivation. Our data support a similar phenomenon in the modulation of E-cadherin splicing in CLL.
Besides the novel mechanism reported in this study, there are other well-known mechanisms of E-cadherin inactivation. In a small study by Melki et al,29 3 of 5 CLL specimens demonstrated methylation of the E-cadherin promoter. Thus, promoter methylation may also operate in conjunction with aberrant splicing to completely curtail E-cadherin expression in many CLL cases. As we do not find any genetic mutations in exon 11 or its flanking intronic regions, we believe the enhanced aberrant splicing in CLL cells is due to leukemia-specific alterations in splicing factors. Splicing factors, binding in the region of exon 11 of the E-cadherin gene, could have altered expression levels or states of activation in CLL cells compared with normal B cells. These trans elements of the splicing machinery are a large diverse family of proteins that bind to the exon and intronic regions and facilitate or inhibit splicing of exons.30 In a recent report,31 SFRS1, a splicing factor of the SR family of RNA-binding proteins, was found to be increased in several primary human tumor cells compared with matched normal controls. This factor controls splicing of several critical genes (BIN1 tumor suppressor and progrowth kinases MNK2 and S6K1), and overexpression of splicing factor, arginine/serine-rich 1 (SFRS1) is sufficient to transform immortal mouse fibroblasts. SFRS2 or SC35 is another splicing factor with role in the alternative splicing of the tumor suppressor gene KLF6.32 This splicing factor is also a transcriptional target of E2F1 and shown to change splice profiles of various apoptotic genes.33 These data support the notion that alterations of splicing factors contribute to oncogenesis. We are currently investigating which known splicing factors could be mediating the exon 11 skipping in CLL.
In summary, our results describe a PTC harboring aberrantly spliced E-cadherin transcript, which is the target of NMD degradation in CLL cells. Increased proportion of these transcripts in CLL cells is a mechanism of gene inactivation and contributes to E-cadherin loss. Furthermore, studies show the importance of E-cadherin loss of expression in the up-regulated wnt pathway in CLL cells. These data further support continuing efforts to target the wnt–β-catenin pathway in CLL.
The online version of this article contains a data supplement.
The publication costs of this article were defrayed in part by page charge payment. Therefore, and solely to indicate this fact, this article is hereby marked “advertisement” in accordance with 18 USC section 1734.
Acknowledgments
We thank Dr Joe Gera, Sepulveda Veterans Administration Research, for advice. Microarray analysis was performed at the University of California microarray core facility.
S.S. is a recipient of a grant from Flight Attendants Medical Research Institute and an American Society of Clinical Oncology (ASCO) Foundation Young Investigator Award. A.L. was supported by Grants CA96920 and CA111448, and research funds from the Veterans Administration.
National Institutes of Health
Authorship
Contribution: S.S. designed and performed research, analyzed data, and wrote the paper; and A.L. analyzed data and wrote the paper.
Conflict-of-interest disclosure: The authors declare no competing financial interests.
Correspondence: Sanjai Sharma, West Los Angeles Veterans Administration Medical Center, Bldg 304, Rm E1-115, 11301 Wilshire Blvd, Los Angeles, CA 90073; e-mail: sasharma@mednet.ucla.edu.

