Abstract
Evidence for the epigenetic regulation of hematopoietic stem cells (HSCs) is growing, but the genome-wide epigenetic signature of HSCs and its functional significance remain unclear. In this study, from a genome-wide comparison of CpG methylation in human CD34+ and CD34− cells, we identified a characteristic undermethylation dip around the transcription start site of promoters and an overmethylation of flanking regions in undifferentiated CD34+ cells. This “bivalent-like” CpG methylation pattern around the transcription start site was more prominent in genes not associated with CpG islands (CGI−) than CGI+ genes. Undifferentiated hematopoietic cells also exhibited dynamic chromatin associated with active transcription and a higher turnover of histone acetylation than terminally differentiated cells. Interestingly, inhibition of chromatin condensation by chemical treatment (5-azacytidine, trichostatin A) enhanced the self-renewal of “stimulated” HSCs in reconstituting bone marrows but not “steady-state” HSCs in stationary phase bone marrows. In contrast, similar treatments on more mature cells caused partial phenotypic dedifferentiation and apoptosis at levels correlated with their hematopoietic differentiation. Taken together, our study reveals that the undifferentiated state of hematopoietic cells is characterized by a unique epigenetic signature, which includes dynamic chromatin structures and an epigenetic plasticity that correlates to level of undifferentiation.
Introduction
Hematopoietic stem cells (HSCs) constitute a rare subpopulation in hematopoietic tissues that can produce all lineages of blood cells throughout life and reconstitute bone marrow when transplanted into myeloablated hosts. The ability of HSCs to maintain or reconstitute the hematopoietic system is dependent on their unique ability to execute self-renewing divisions and multilineage differentiation potential.1 Numerous studies have identified key transcription factors involved in the self-renewal of HSCs2 and gene expression patterns specific to primitive hematopoietic cells.3,4 However, it is still not clear how the dynamic regulation of gene expression is coordinated to influence cell fate during the stochastic process of cell fate decisions in HSCs.1
Recently, epigenetic modification of chromatin structures has been implicated in the regulation of gene expression and development5 by influencing the accessibility of transcription factors to DNA and altering the transcription profile of cells.6 The modification of chromatin structures is largely regulated by the acetylation and methylation of histones (H3, H4), which act as switches between permissive or repressive chromatin.7 In addition, DNA methylation in promoter regions has been shown to cause transcriptional silencing of genes8 by promoting the binding of MeCP2, a transcriptional repressor that recruits histone deacetylases (HDACs) to methylated promoters.9
Accordingly, studies to characterize the epigenetic status of pluripotent embryonic stem (ES) cells have revealed unique features of ES cells, such as less condensed chromatin structures10,11 and the poised, that is “primed but held-in-check,” expression of lineage-associated regulatory genes via a bivalent mode of histone modification by Polycomb (PcG) group proteins.10,12 Accumulating evidence suggests that epigenetic modification also regulates hematopoietic differentiation.13-15 For example, hematopoietic progenitor cells exhibit a promiscuous, low-level expression of lineage-specific genes before commitment.16,17 Similarly, hematopoietic differentiation correlates to a stepwise decrease in the transcriptional accessibility of multilineage-affiliated genes.16,18 In addition, changes in the expression of lineage-specifying genes correlate with changes in chromatin structures in the promoter regions during differentiation,19,20 and the epigenetic regulation of defined sets of lineage-associated genes has been directly analyzed in primary murine hematopoietic cells.21 However, the genome-wide epigenetic signature of the undifferentiated state of hematopoietic cells and its effect on HSC function in vivo still remain poorly understood.
In the current study, we analyzed the genome-wide DNA methylation of undifferentiated human hematopoietic cells and examined the effect of epigenetic modification on the hematopoietic function of HSCs in bone marrow under distinct physiologic conditions. We show that undifferentiated hematopoietic cells can be characterized by an undermethylation dip at the transcription start site (TSS) of promoters and by chromatin structures in dynamic equilibrium. We propose that this characteristic epigenetic signature confers epigenetic plasticity and multilineage potential to undifferentiated HSCs.
Methods
Animals
C57BL/6J-Ly 5.2 (BL6) mice or C57BL/6J-Pep3b-Ly5.1 (Pep3b) mice were used as recipients or donors in congenic transplantations. Animals were bred and maintained in sterile microisolator cages located in an air-filtered room in the animal facility of the Catholic University of Korea. Experiments were undertaken with the approval of the Animal Experiment Board of the Catholic University of Korea.
Cells
Umbilical cord blood (UCB) cells were obtained from full-term normal deliveries with informed consent from the parents and the approval of the Ethics Committee for Medical Research of the Catholic University of Korea. CD34+ cells were purified by immunomagnetic selection (Dynal Biotech) from low-density cells, followed by flow-cytometric sorting for CD34+ in the FACSVantage (BD Biosciences). CD34− cells were sorted from low-density cells. After sorting, cells were reanalyzed by flow cytometry or xenotransplantation into NOD/SCID mice to confirm depletion of HSCs (supplemental Figure 1, available on the Blood website; see the Supplemental Materials link at the top of the online article). To purify CD34+CD38+ or CD34+CD38− cells, mononuclear cells were depleted of lineage marker+ cells by immunomagnetic column (StemCell Technologies) and then stained with each antibody for further sorting. Murine bone marrow cells enriched with progenitors were obtained after a 4-day treatment with 5-fluorouracil (Sigma).22 For subsets of hematopoietic populations, bone marrow cells were first depleted of lineage (CD5, CD45R, CD11b, TER119, Gr-1, 7-4)–positive cells using an immunomagnetic column (StemSep, StemCell Technologies; Lin−) and then stained with Sca-1, c-Kit, or CD34 for sorting for each specific population. Lineage-positive (Lin+) cells or their subpopulations (B220+Sca-1− or Mac-1+/Gr-1+Sca-1−) were also obtained by sorting. Antibodies for fluorescence-activated cell sorting (FACS) were purchased from BD Biosciences PharMingen. Gates were set to exclude greater than 99.99% of nonspecifically stained propidium iodide (PI)− cells that were incubated with isotype-matched control antibodies labeled with corresponding fluorochromes.
Genome-wide CpG methylation analysis
Genomic DNA obtained from CD34+ and CD34− cells was fragmented by either sonication or digestion with MseI. Recombinant methyl-binding domain (Genomic Tree) was incubated with sonicated genomic DNA in a binding reaction mixture (10mM Tris-HCl, pH 7.5, 50mM NaCl, 1mM ethylenediaminetetraacetic acid, 1mM dithiothreitol, 3mM MgCl2, 0.1% Triton X-100, 5% glycerol, 25 mg/mL bovine serum albumin, and 1.25 μg/mL sonicated JM110 bacterial DNA) for 4 hours at 4°C on a rocking platform. This mixture was bound to Ni-NTA agarose beads, and the pelleted beads were washed 3 times with binding buffer containing 700mM NaCl. The methyl-enriched DNA fraction was purified using Qiaquick PCR purification kits (QIAGEN) and amplified using a whole genome amplification kit as recommended by the manufacturer (Agilent Technologies). Amplified DNA products from CD34+ and CD34− cells were labeled with Cy3-dUTP and Cy5-dUTP, respectively, by random priming and hybridized onto Agilent human CpG island (CGI) microarrays using conditions specified by the manufacturer (Agilent Technologies). After washing, the slides were scanned using an Agilent scanner and images were quantified using the Feature Extraction Software, Version 9.3 (Agilent Technologies). Genes exhibiting significant (P < .01) undermethylation around TSS or flanking overmethylation were identified using modified algorithms previously reported.23 Briefly, 3-probe moving average of log2 ratios were plotted in normal distribution, and the significance of relative undermethylation or overmethylation was calculated using z-statistics. Enrichment of gene function was analyzed using Database for Annotation, Visualization, and Integrated Discovery (http://david.niaid.nih.gov) as described.24 All microarray data have been deposited in the GEO public database under accession number GSE17833.
Analysis of methylation in repetitive DNA elements by pyrosequencing
For methylation in repetitive elements, 500 ng of genomic DNA was treated with sodium bisulfite using the EZ DNA methylation gold kit according to the manufacturer's protocol (Zymo Research). The bisulfite-treated DNA (50 ng) was amplified by PCR. Pyrosequencing reactions were performed automatically using a PSQ 96MA system (Pyrosequencing AB) according to the manufacturer's instructions. Methylation was quantified using the PyroQ-CpG Software. The sequence of each primer is shown in supplemental Table 3.
Ex vivo culture
Stroma-free murine hematopoietic cells were cultured for 5 days in serum-free medium containing Iscove modified Dulbecco medium plus BIT (StemCell Technologies), supplemented with 10−4M 2-mercaptoethanol plus 40 μg/mL low-density lipoprotein (Sigma), 100 ng/mL murine steel factor (R&D Systems), 100 ng/mL human Flt3 ligand (R&D Systems), and 50 ng/mL human thrombopoietin (CytoLab/PeproTech).22 Human hematopoietic cells were similarly cultured ex vivo in serum-free substitution media containing 20% BIT as described.25 Each culture was supplemented with growth factor cocktails containing 100 ng/mL human Flt3 ligand (R&D Systems), 100 ng/mL human stem cell factor (R&D Systems), and 20 ng/mL human interleukin-3, granulocyte colony-stimulating factor, and human interleukin-6 (R&D Systems).
In vivo and in vitro treatment with epigenetic inhibitors
For in vivo treatment during the regenerative phase, 1 μg/g 5-azacytidine (AZA) or 0.5 μg/g trichostatin A (TSA) was intraperitoneally injected into recipient mice for 2 weeks starting 3 days after transplantation. For treatment during the stationary phase, the same dose of AZA or TSA was injected daily into donor mice for 2 weeks. For treatment with AZA and TSA in an ex vivo culture, sorted murine or human hematopoietic cells were precultured for 18 hours in serum-free media supplemented with growth factors, and AZA (25 ng/mL; Sigma-Aldrich) and TSA (25 ng/mL; Sigma-Aldrich) were added for 24 to 48 hours. The treated cells were washed and injected into irradiated recipient mice or restained and analyzed for phenotypes.
LTC-IC assays
Sorted CD34+CD38− cells and CD34− cells from human UCB were serum-free cultured for 18 hours and treated with 5-AZA (25 ng/mL) and TSA (25 ng/mL) for 48 hours ex vivo and then washed and subjected to a long-term culture assay as described.26 Briefly, cells were transferred to a 35-mm dish containing a feeder layer of irradiated (8000 cGy) mouse stromal cells, M210B4 (ATCC), and cultured in Myelocult medium (StemCell Technologies) containing 10−6M hydrocortisone (Sigma) and 10−4M 2-mercaptoethanol (Sigma) for 6 weeks with half-medium changes. For colony formation, cells in a long-term culture were harvested and plated on semisolid methylcellulose media supplemented with cytokines.
In vivo repopulation and CRU assays
Transplantation of HSCs from primary recipient mice into congenic secondary recipient mice was performed as previously described.27 To calculate HSC numbers quantitatively, competitive repopulating unit (CRU) assays were performed as previously described.28 Briefly, serially diluted cells were transplanted into lethally irradiated (900 cGy) mice with 105 helper cells, and lymphoid and myeloid engraftment levels in the recipient mice blood were determined after 16 weeks. Lineages of repopulated hematopoietic cells were analyzed by staining with anti-Mac-1/Gr-1 (BD Biosciences PharMingen) for myeloid cells and with anti-TB104 or anti-B220 antibodies (BD Biosciences PharMingen) for lymphoid cells.27 Recipient mice whose white blood cells contained 1% or more donor-derived lymphoid and myeloid cells were scored as positive; 1 CRU was defined as the cell dose at which 37% of the mice tested were negative for donor-derived lymphoid and myeloid cells (negative mice).28 CRU frequencies and 95% confidence intervals (CIs) were calculated by applying Poisson statistics to the proportion of negative mice in groups of recipients given different numbers of cells using L-Calc software (StemCell Technologies).
Western blot and pulse-chase labeling for histone acetylation
Sorted murine and human hematopoietic cells were lysed in 2× Laemmli buffer and subjected to electrophoresis and analyzed using antibodies against histone acetyl transferase 1 (HAT1), HDAC1, HDAC2, DNMT1, DNMT3a, DNMT3b (Santa Cruz Biotechnology), Me-H3K4, Di-MeH3K9, Ac-H4, Ac-H3K9/14, MeCP2 (Upstate Biotechnology), or actin (Chemicon International). For pulse-chase labeling of histone acetylation, sorted cell fractions were first cultured for 18 hours in serum-free media containing growth factors and then supplemented with 3H-acetic acid (1 mCi/mL final concentration; GE Healthcare). After 4 hours, labeled cells were harvested and washed with cold PBS twice, then lysed in 1× radioimmunoprecipitation assay (RIPA) buffer supplemented with a protease inhibitor cocktail (Roche Diagnostics), and phenylmethylsulfonyl fluoride (Pierce). Lysates from 106 cells were precleared with protein A–Sepharose for 3 hours, and supernatants were incubated with Ac-H4 antibody or rabbit IgG (Santa Cruz Biotechnology). Protein A–Sepharose beads were then added, and the reactions were rotated for 3 hours at 4°C. After 3 washes, sodium dodecyl sulfate (SDS) loading buffer was added to the beads and samples were electrophoresed for autoradiographic visualization.
Statistical analysis
The differences between the groups were evaluated using the Student t test (P < .05). CRU frequencies and 95% CIs were calculated according to Poisson statistics. The data represent the mean plus or minus SEM.
Results
Undifferentiated hematopoietic cells display a genome-wide undermethylation dip in the TSS of promoters
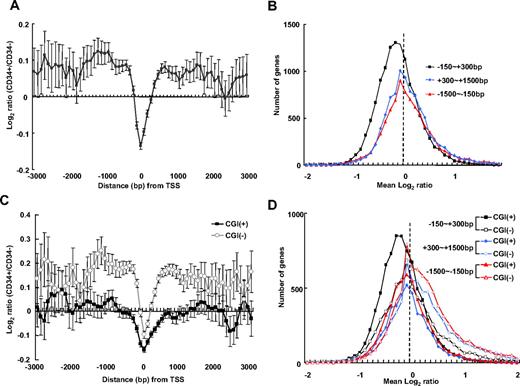
As a first approach to characterize the epigenetic signature of undifferentiated hematopoietic cells, we compared the genome-wide DNA methylation of undifferentiated (CD34+) and differentiated (CD34−) human hematopoietic cells. Methylated CpG-enriched DNA fractions were collected from purified CD34+ and CD34− cells using methyl-CpG binding proteins29 and hybridized to high-resolution CpG microarrays. The relative overmethylation and undermethylation in CD34+ cells was determined by comparison with methylation levels in CD34− cells. We first plotted mean log2 intensity ratios (CD34+/CD34−) with respect to the distance from the TSS of known genes (Figure 1A). In a promoter-wide log2 intensity ratio plot, a dip in the log2 ratio was observed in the region in close vicinity to the TSS (−150 bp to 300 bp), revealing a relative undermethylation of this area in CD34+ cells. In contrast, the flanking regions up to 1.5 kb of upstream and downstream of the TSS were overmethylated in CD34+ cells. These results show that, in CD34+ cells, CpG methylation around the TSS displays a bivalent-like pattern. To delineate the relative undermethylation and overmethylation around the TSS in CD34+ cells, we plotted the number of genes with respect to the mean log2 ratios for 3 regions around the TSS (−150 bp to 300 bp, −1.5 kb to −150 bp, and 300 bp to 1.5 kb from the TSS; Figure 1B). The log2 distribution encompassing TSS (−150 bp to 300 bp) generated a normal-shaped curve with a peak markedly shifted toward negative log2 values, indicating that undermethylation in this region is global and not limited to a gene subset. Plots for the flanking regions upstream (−1.5 kb to −150 bp) and downstream (300 bp to 1.5 kb) of the TSS were skewed toward positive log2 values, indicating a generalized overmethylation of genes in these regions.
Genome-wide analysis of CpG methylation in human CD34+ cells compared with CD34− cells. The log2 intensity ratio of CpG methylation (CD34+/CD34−) was averaged from 4 experiments. (A) The mean intensity ratio of probes is shown in 100-bp–sized windows up to 3 kb upstream and downstream of the TSS of known genes; error bar represents 95% CI. Negative log2 ratio values are indicative of a relative undermethylation around the TSS (−150 bp to 300 bp of the TSS) in CD34+ cells compared with CD34− cells. In flanking regions, positive log2 ratio values are indicative of a relative overmethylation in this region, up to 3 kb of upstream and downstream of the TSS, in CD34+ cells. (B) Genome-wide plot of the number of genes with respect to mean log2 ratios for 3 regions around the TSS (−150 bp to 300 bp, −1.5 kb to −150 bp, and 300 bp to 1.5 kb of the TSS). The log2 distribution encompassing the TSS (−150 bp to 300 bp) exhibits a normal-shaped curve with a peak markedly shifted toward negative direction, indicating an undermethylation in this region in CD34+ cells compared with CD34− cells. (C) Separate analysis of log2 intensity ratios for CGI+ and CGI− gene clusters. Log2 ratios for probes for CpG islands (CGI+) and non-CpG islands (CGI−) were separately plotted with respect to distance from the TSS. Both CGI+ and CGI− genes exhibit an undermethylation dip around the TSS in CD34+ cells compared with CD34− cells and CGI− genes are hypermethylated in the flanking regions. (D) A log2 distribution plot of CGI+ and CGI− genes shows the TSS flanking regions of CGI− genes are skewed toward positive values, indicating hypermethylation.
Genome-wide analysis of CpG methylation in human CD34+ cells compared with CD34− cells. The log2 intensity ratio of CpG methylation (CD34+/CD34−) was averaged from 4 experiments. (A) The mean intensity ratio of probes is shown in 100-bp–sized windows up to 3 kb upstream and downstream of the TSS of known genes; error bar represents 95% CI. Negative log2 ratio values are indicative of a relative undermethylation around the TSS (−150 bp to 300 bp of the TSS) in CD34+ cells compared with CD34− cells. In flanking regions, positive log2 ratio values are indicative of a relative overmethylation in this region, up to 3 kb of upstream and downstream of the TSS, in CD34+ cells. (B) Genome-wide plot of the number of genes with respect to mean log2 ratios for 3 regions around the TSS (−150 bp to 300 bp, −1.5 kb to −150 bp, and 300 bp to 1.5 kb of the TSS). The log2 distribution encompassing the TSS (−150 bp to 300 bp) exhibits a normal-shaped curve with a peak markedly shifted toward negative direction, indicating an undermethylation in this region in CD34+ cells compared with CD34− cells. (C) Separate analysis of log2 intensity ratios for CGI+ and CGI− gene clusters. Log2 ratios for probes for CpG islands (CGI+) and non-CpG islands (CGI−) were separately plotted with respect to distance from the TSS. Both CGI+ and CGI− genes exhibit an undermethylation dip around the TSS in CD34+ cells compared with CD34− cells and CGI− genes are hypermethylated in the flanking regions. (D) A log2 distribution plot of CGI+ and CGI− genes shows the TSS flanking regions of CGI− genes are skewed toward positive values, indicating hypermethylation.
Next, to analyze CpG methylation with respect to CGIs, probes specific for CGI (CGI+) and non-CGI (CGI−) genes were analyzed. As shown in Figure 1C, the mean log2 ratios reveal that the TSS regions of both CGI+ and CGI− genes had undermethylation/overmethylation patterns but that, overall, CGI+ genes had a more prominent undermethylation dip and CGI− gene were characterized by more prominent overmethylation in the flanking regions of the TSS. In addition, the mean log2 distributions show more prominent skewing toward positive mean log2 values in the flanking regions of CGI− genes (Figure 1D). These results show that CGI+ and CGI− genes are distinctively regulated by CpG methylation.
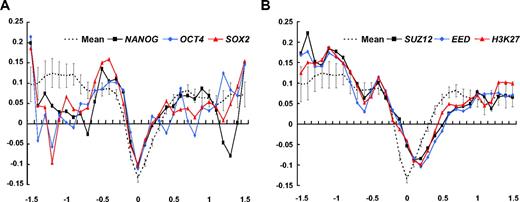
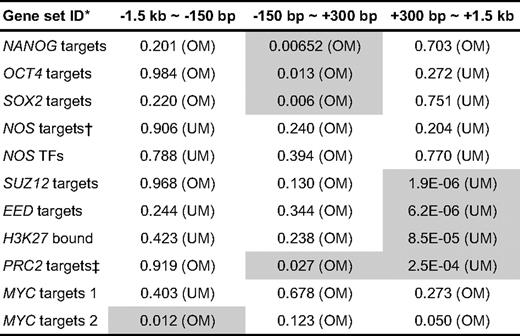
Having observed global differences in CpG methylation in CD34+ and CD34− cells, we next examined CpG methylation around 11 known stemness-related genes30 (Table 1), including transcriptional targets of Nanog, OCT4, SOX2, Myc, and previously identified PcG-regulated genes. Mean log2 ratios were calculated for 3 regions around the TSS of these 11 genes, and the significance of enrichment for individual gene sets was determined using the PAGE algorithm.31 As shown, the log2 intensity ratio of the transcriptional targets of known pluripotency-related factors, NANOG, OCT4, and SOX2,23 showed significant deviation toward positive log2 ratio in the TSS region, indicating a reduced extent of undermethylation around the TSS (Figure 2A; Table 1). In contrast, log2 intensity ratio plots of PcG-regulated genes, including the identified targets of SUZ, EED, and H3-lysine 27,32 revealed significant undermethylation in downstream flanking regions of the TSS (Figure 2B; Table 1). Taken together, these results show that pluripotent genes in CD34+ cells are relatively overmethylated in their TSS and genes involved in “poised” gene expression12 are relatively undermethylated downstream of their TSS. However, we detected no significant shift in log2 plots of specific genes that are highly up-regulated in embryonic stem cells30 or in log2 plots of hematopoiesis-related lineage specific regulators33 (data not shown).
Analysis of CpG methylation for selected stemness-related genes. Mean log2 ratios of plots for CD34+/CD34− of 11 stemness-related genes (Table 1). (A) Log2 ratios with respect to the distance from the TSS for transcription targets of known pluripotency-related factors, NANOG, OCT4, and SOX2 (average of 4 experiments). Positive log2 ratios around the TSS indicate that this region is less undermethylated. (B) Mean log2 ratio plots for PcG-regulated genes, including the genes identified as targets of Suz, Eed, and H3-lysine 27, show significant enrichment of negative log2 ratios in downstream flanking regions of the TSS. A characteristic right shift indicates an undermethylation dip in the downstream flanking region of TSS for PcG-regulated genes.
Analysis of CpG methylation for selected stemness-related genes. Mean log2 ratios of plots for CD34+/CD34− of 11 stemness-related genes (Table 1). (A) Log2 ratios with respect to the distance from the TSS for transcription targets of known pluripotency-related factors, NANOG, OCT4, and SOX2 (average of 4 experiments). Positive log2 ratios around the TSS indicate that this region is less undermethylated. (B) Mean log2 ratio plots for PcG-regulated genes, including the genes identified as targets of Suz, Eed, and H3-lysine 27, show significant enrichment of negative log2 ratios in downstream flanking regions of the TSS. A characteristic right shift indicates an undermethylation dip in the downstream flanking region of TSS for PcG-regulated genes.
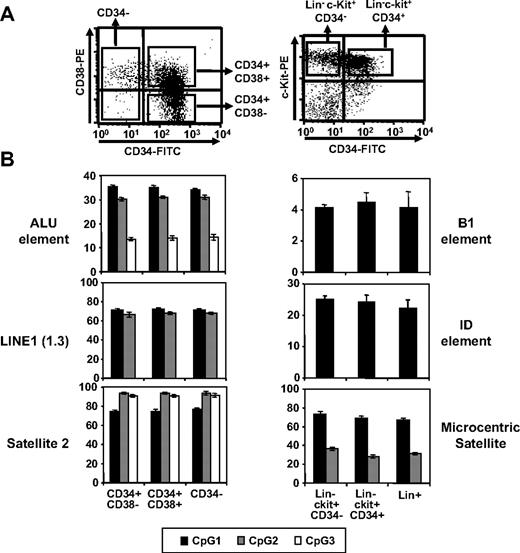
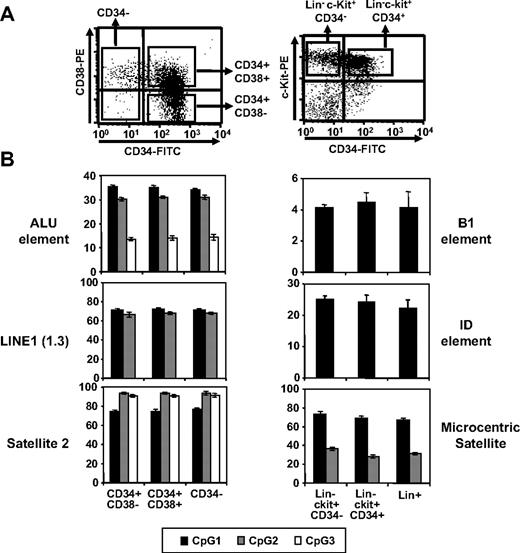
Next, we examined repetitive elements of the genome for CpG methylation, as demethylation has been shown to be regulated within these elements during early development.34,35 Methylation in CpG islands of Alu-1, LINE-1,36 and Satellite-234 in human hematopoietic cells at various differentiation stages was examined by pyrosequencing. Comparable levels of CpG methylation in these regions were found in primitive CD34+CD38−, undifferentiated but committed CD34+CD38+, and differentiated CD34− cells (Figure 3). Similar results were obtained for repetitive elements (B1, ID, and microcentric satellite) of murine hematopoietic cells (Figure 3). These results show that undermethylation and overmethylation patterns in undifferentiated hematopoietic cells are limited to nonrepetitive DNA elements during post-developmental stages.
Comparison of CpG methylation in repetitive elements. (A) Representative FACS profiles for human and murine hematopoietic subpopulations. (B) Methylation levels of CpG dinucleotides in each repetitive element as indicated. Shown are the mean percentage of methylated CpGs for 3 independent locus (denoted as CpG 1, 2, and 3) in each region as determined by pyrosequencing analysis (n = 3).
Comparison of CpG methylation in repetitive elements. (A) Representative FACS profiles for human and murine hematopoietic subpopulations. (B) Methylation levels of CpG dinucleotides in each repetitive element as indicated. Shown are the mean percentage of methylated CpGs for 3 independent locus (denoted as CpG 1, 2, and 3) in each region as determined by pyrosequencing analysis (n = 3).
Undifferentiated hematopoietic cells undergo dynamic epigenetic modifications
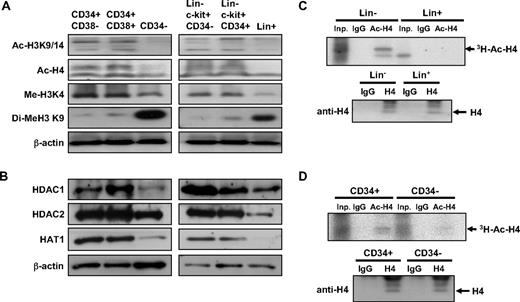
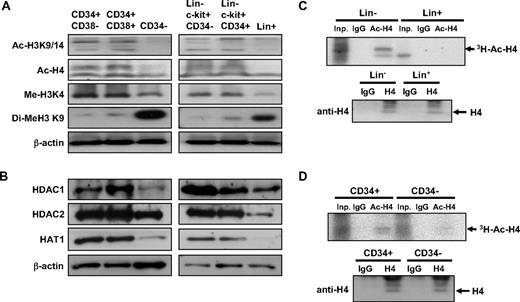
Next, we examined nucleosomal histone modifications at different stages of hematopoietic differentiation. We compared the acetylation of histone (H4 and H3) in 3 human hematopoietic subpopulations37 : CD34+CD38−, CD34+CD38+ cells, and CD34− cells. As shown in Figure 4A, human CD34+CD38− and CD34+CD38+ cells exhibited higher levels of H4 and H3 acetylation than terminally differentiated CD34− cells. Moreover, the level of H3K4 methylation, associated with active chromatin regions,38 was highly enriched in undifferentiated (CD34+) cells, whereas the level of H3K9 methylation, associated with repressed chromatin regions,39 was enriched in terminally differentiated (CD34−) hematopoietic cells (Figure 4A). Similarly, undifferentiated Lin−c-kit+CD34− and Lin−c-kit+CD34+ murine bone marrow cells also exhibited higher levels of H4/H3 acetylation and H3K4 methylation, the histone modification associated with active transcription, but lower levels of repressive H3K9 methylation compared with differentiated (Lin+) cells (Figure 4A). Interestingly, undifferentiated cells of both human (CD34+) and murine (Lin−) origin expressed higher levels of HDAC 1 and 2 and HAT1 than differentiated cells (human CD34− and murine Lin+ cells; Figure 4B), suggesting that histone acetylation turnover may be higher in undifferentiated cells. To examine the rate of histone acetylation turnover in these cells, we performed pulse-chase experiments using hematopoietic cells exposed to 3H-acetic acid in a short-term culture and compared the rate of de novo histone acetylation. As shown in Figure 4C-D, incorporation of 3H-acetyl residues and H4 acetylation was higher in undifferentiated human and murine hematopoietic cells (CD34+ and Lin−, respectively) compared with differentiated cells (human CD34− and murine Lin+ cells), indicating that histone modification is more dynamic in these cells. Taken together, these results show that undifferentiated hematopoietic cells are characterized by more open chromatin structures and undergo more dynamic chromatin modifications than differentiated cells, which have more condensed chromatin structures and more stable epigenetic modifications.
Undifferentiated hematopoietic cells have more open and dynamic chromatin than differentiated cells. (A) Levels of active (Me-H3K4) and repressive (Di-Me-H3K9) histone modifications and acetylation of histones (Ac-H3K9/14, Ac-H4) were compared at different stages in human (left row) and murine (right row) hematopoietic cells. (B) Protein expression levels of each indicated histone-modifying enzymes from human (left) and murine (right) hematopoietic cells. (C-D) Pulse-chase labeling of histone acetylation in lineage-negative (Lin−) and lineage-positive (Lin+) murine bone marrow cells (C) and in human CD34+ and CD34− cells (D). (Top panels) Autoradiography of immunoprecipitations using the antibodies as indicated from 106 input cells. Inp indicates input cells; IgG, immunoprecipitation with isotype IgG; Ac-H4, immunoprecipitation with antibody against acetylated H4. (Bottom panels) Immunoblots using antibody against total form of H4 from 106 input cells.
Undifferentiated hematopoietic cells have more open and dynamic chromatin than differentiated cells. (A) Levels of active (Me-H3K4) and repressive (Di-Me-H3K9) histone modifications and acetylation of histones (Ac-H3K9/14, Ac-H4) were compared at different stages in human (left row) and murine (right row) hematopoietic cells. (B) Protein expression levels of each indicated histone-modifying enzymes from human (left) and murine (right) hematopoietic cells. (C-D) Pulse-chase labeling of histone acetylation in lineage-negative (Lin−) and lineage-positive (Lin+) murine bone marrow cells (C) and in human CD34+ and CD34− cells (D). (Top panels) Autoradiography of immunoprecipitations using the antibodies as indicated from 106 input cells. Inp indicates input cells; IgG, immunoprecipitation with isotype IgG; Ac-H4, immunoprecipitation with antibody against acetylated H4. (Bottom panels) Immunoblots using antibody against total form of H4 from 106 input cells.
Epigenetic modifications enhance self-renewal of HSCs in “stimulated” but not “steady-state” bone marrows
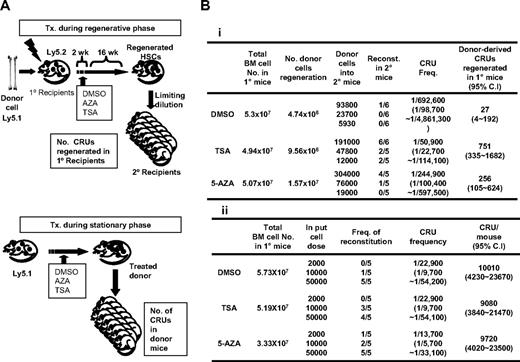
Having observed epigenetic modifications characteristic of undifferentiated cells, we next addressed whether the epigenetic status of HSCs has a functional impact on hematopoietic functions in vivo by examining if epigenetic changes induce changes in the self-renewal of HSCs during various physiologic conditions of bone marrow. To this end, we first examined the effects of chemically inhibiting DNA methylation (with AZA) and histone deacetylation (TSA) on the self-renewal of CRUs28 during regenerating bone marrow condition. HSCs were transplanted into recipients myeloablated by irradiation, and AZA or TSA was injected during the initial 2 weeks of reconstitution, the time period when transplanted HSCs undergo active self-renewal in the bone marrow.27 Sixteen weeks after transplantation, the number of donor-derived CRU regenerated in each recipient mice marrows was determined by limiting dilution transplantations into secondary recipients (Figure 5A top panel). As shown in Figure 5Bi, a high number of CRUs were regenerated from the TSA-treated group and a moderate number from the AZA-treated group compared with the number of donor-derived CRUs regenerated from control mice (751 CRUs for TSA-treated, 256 CRU for AZA-treated, and 27 CRUs for control mice). These results suggest that open chromatin structures influence the self-renewal properties of HSCs in vivo during the regenerative process of bone marrow.
Comparison of the effects of AZA or TSA treatment on HSC self-renewal in distinct bone marrow conditions. (A) Schematic illustration of the experimental design comparing the effects of AZA and TSA treatment on HSCs during the regenerative or stationary phase in bone marrow. (Top panel) Epigenetic treatment on HSCs during the regenerative phase of bone marrow. Donor bone marrow cells (105/mouse; Pep 3b, Ly5.1) were transplanted into lethally irradiated recipient mice (BL6, Ly5.2; n = 3). Recipient mice were then injected daily with AZA or TSA for 2 weeks starting 3 days after transplantation, the time period when transplanted HSCs undergo active self-renewal.27 After 16 weeks, the total number of donor-derived CRU regenerated in the primary recipients was determined by a limiting dilution analysis into secondary recipient mice. (Bottom panel) Epigenetic treatment on HSCs during the stationary phase of bone marrow. Mice (Pep3b, Ly5.1) in the homeostatic phase were injected daily with TSA or AZA for 2 weeks, and CRU frequencies and total CRU numbers in the bone marrows of treated mice were determined by a limiting dilution analysis. (B) Effects of epigenetic treatment on HSC self-renewal during the regenerative (i) and stationary (ii) phases of bone marrow. Shown are the CRU frequencies of donor-derived cells determined by Poisson statistics. CRU frequencies and 95% CIs were calculated by applying Poisson statistics. Total number of CRU in the mice was calculated assuming that 2 femurs and tibias represent 25% of the total marrow.
Comparison of the effects of AZA or TSA treatment on HSC self-renewal in distinct bone marrow conditions. (A) Schematic illustration of the experimental design comparing the effects of AZA and TSA treatment on HSCs during the regenerative or stationary phase in bone marrow. (Top panel) Epigenetic treatment on HSCs during the regenerative phase of bone marrow. Donor bone marrow cells (105/mouse; Pep 3b, Ly5.1) were transplanted into lethally irradiated recipient mice (BL6, Ly5.2; n = 3). Recipient mice were then injected daily with AZA or TSA for 2 weeks starting 3 days after transplantation, the time period when transplanted HSCs undergo active self-renewal.27 After 16 weeks, the total number of donor-derived CRU regenerated in the primary recipients was determined by a limiting dilution analysis into secondary recipient mice. (Bottom panel) Epigenetic treatment on HSCs during the stationary phase of bone marrow. Mice (Pep3b, Ly5.1) in the homeostatic phase were injected daily with TSA or AZA for 2 weeks, and CRU frequencies and total CRU numbers in the bone marrows of treated mice were determined by a limiting dilution analysis. (B) Effects of epigenetic treatment on HSC self-renewal during the regenerative (i) and stationary (ii) phases of bone marrow. Shown are the CRU frequencies of donor-derived cells determined by Poisson statistics. CRU frequencies and 95% CIs were calculated by applying Poisson statistics. Total number of CRU in the mice was calculated assuming that 2 femurs and tibias represent 25% of the total marrow.
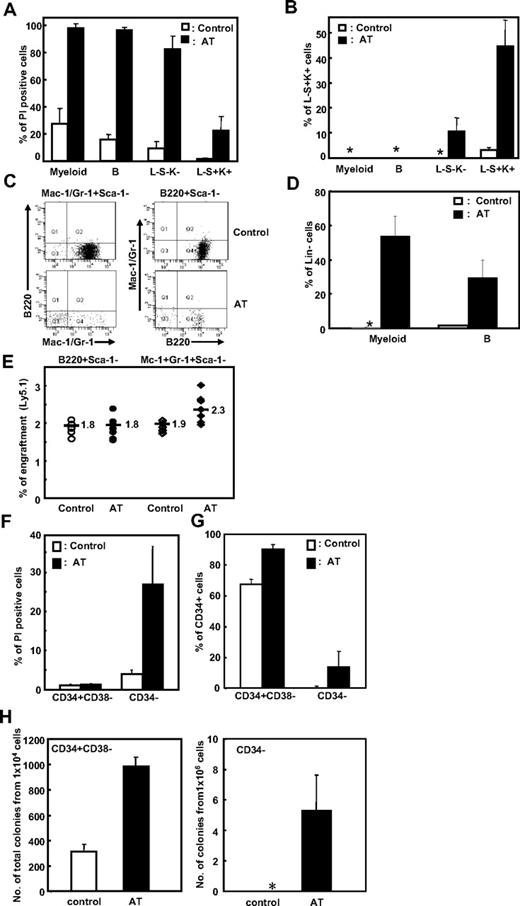
We next examined whether TSA and AZA treatment has similar effects on steady-state HSCs in nonstimulated bone marrow. Nonirradiated mice were injected with TSA or AZA for 2 weeks, and the bone marrow CRU content of the treated mice was determined by a limiting dilution assay (Figure 5A bottom panel of schematic). No significant difference in CRU frequency among each mice group was found (10 000 CRUs vs 9220 and 10 000 CRUs for control vs TSA- and AZA-treated groups, respectively; Figure 5Bii). Thus, our data reveal that increased HSC self-renewal in response to epigenetic modifications occurs only in “stimulated” but not “steady-state” marrows. These results suggest that opening chromatin structure maintains HSCs in an undifferentiated state and that extrinsic signals are required to execute their self-renewal. In support of this, primitive hematopoietic cells (LSK) cultured in vitro with AZA and TSA maintained their level of undifferentiation to a much higher level than cells cultured with cytokine alone (45% in treated vs 3.3% in control group, respectively, P < .05; Figure 6B).
Effects of epigenetic treatment on mature hematopoietic populations. (A-D) Murine bone marrow cells were sort-purified into primitive (Lin−Sca-1+c-Kit+; LSK), intermediate (Lin−Sca-1−c-Kit−; L−S−K−), and terminally differentiated B-lymphoid (B220+Sca-1−) or myeloid (Mac-1+/Gr-1+Sca-1−) cell populations. Each cell population was treated with AZA (25 ng/mL) and TSA (25 ng/mL) (denoted as AT) for 24 hours. (A) The extent of apoptosis after treatment was measured as the percentage of PI+ cells. (B) The percentage of L−S+K+ cells was determined by restaining the cells with the indicated antibodies. *Less than 0.1%. (C-D) Effects of epigenetic treatment on B-lymphoid (B220+Sca-1−) and myeloid (Mac-1+/Gr-1+Sca-1−) cells were examined after restaining cultured cells with the indicated antibodies. Representative FACS profile (C) and mean ± SD% Lin− cells (D) after culture are shown (5 independent experiments). AT indicates treatment with both AZA and TSA. (E) Effects of epigenetic treatment on the repopulating activity of mature hematopoietic cells. B220+Sca-1− and Mac-1+/Gr-1+Sca-1− cells (each 105 cells) were treated with epigenetic modifiers (AT) for 24 hours and transplanted with helper cells (105 cells each) into irradiated recipient mice together. Shown is the percentage of donor-derived cells in the peripheral blood of individual recipient mice 16 weeks after transplantation (n = 5 for control and 8 for treated group). (F-G) Effects of epigenetic treatment on human UCB-derived hematopoietic cells. Sorted CD34− and CD34+CD38− cells (106 and 105, respectively) were treated with AZA (25 ng/mL) and TSA (25 ng/mL) for 48 hours and analyzed for apoptosis with PI+ cells (F) and percentage CD34+ cells after culture (G). Shown are the mean ± SD from 3 experiments. (H) Effects of epigenetic treatment on hematopoietic cells in a long-term culture. CD34+38− and CD34− cells (104 and 106 cells, respectively) were treated with AZA and TSA for 48 hours and subjected to a long-term culture as described in “LTC-IC assays” in “Methods.” Shown is the total number of colonies and 12-day colony assays obtained after a 6-week long-term culture from 3 independent experiments. *No colonies were obtained.
Effects of epigenetic treatment on mature hematopoietic populations. (A-D) Murine bone marrow cells were sort-purified into primitive (Lin−Sca-1+c-Kit+; LSK), intermediate (Lin−Sca-1−c-Kit−; L−S−K−), and terminally differentiated B-lymphoid (B220+Sca-1−) or myeloid (Mac-1+/Gr-1+Sca-1−) cell populations. Each cell population was treated with AZA (25 ng/mL) and TSA (25 ng/mL) (denoted as AT) for 24 hours. (A) The extent of apoptosis after treatment was measured as the percentage of PI+ cells. (B) The percentage of L−S+K+ cells was determined by restaining the cells with the indicated antibodies. *Less than 0.1%. (C-D) Effects of epigenetic treatment on B-lymphoid (B220+Sca-1−) and myeloid (Mac-1+/Gr-1+Sca-1−) cells were examined after restaining cultured cells with the indicated antibodies. Representative FACS profile (C) and mean ± SD% Lin− cells (D) after culture are shown (5 independent experiments). AT indicates treatment with both AZA and TSA. (E) Effects of epigenetic treatment on the repopulating activity of mature hematopoietic cells. B220+Sca-1− and Mac-1+/Gr-1+Sca-1− cells (each 105 cells) were treated with epigenetic modifiers (AT) for 24 hours and transplanted with helper cells (105 cells each) into irradiated recipient mice together. Shown is the percentage of donor-derived cells in the peripheral blood of individual recipient mice 16 weeks after transplantation (n = 5 for control and 8 for treated group). (F-G) Effects of epigenetic treatment on human UCB-derived hematopoietic cells. Sorted CD34− and CD34+CD38− cells (106 and 105, respectively) were treated with AZA (25 ng/mL) and TSA (25 ng/mL) for 48 hours and analyzed for apoptosis with PI+ cells (F) and percentage CD34+ cells after culture (G). Shown are the mean ± SD from 3 experiments. (H) Effects of epigenetic treatment on hematopoietic cells in a long-term culture. CD34+38− and CD34− cells (104 and 106 cells, respectively) were treated with AZA and TSA for 48 hours and subjected to a long-term culture as described in “LTC-IC assays” in “Methods.” Shown is the total number of colonies and 12-day colony assays obtained after a 6-week long-term culture from 3 independent experiments. *No colonies were obtained.
Taken together, these results show that epigenetic modifications indeed influence HSC function in vivo and that open chromatin structures are associated with a higher maintenance of the undifferentiated state and a corresponding higher probability of self-renewal after extrinsic stimulation.
Hematopoietic cells display a hierarchical flexibility to epigenetic alteration and reprogramming
Based on the observations in HSCs, we next examined the effects of AZA and TSA on more mature cell populations to determine whether dedifferentiation can be induced in these cells. Terminally differentiated myeloid (Mac-1/Gr-1+Sca-1−) or B-lymphoid (B220+Sca-1−) cells, or cells at an intermediate level of differentiation (Lin−Sca-1−c-kit−; L−S−K−) were purified, cultured in vitro with TSA and AZA, and compared with chemically treated primitive Lin−Sca-1+c-kit+ (L−S+K+) cells.
As shown, L−S−K− and Lin+ (both myeloid and B-lymphoid) cells exhibited extensive apoptosis in response to AZA and TSA treatment compared with L−S+K+ cells (80% for L−S−K−, 97% for Lin+, and 20% for L−S+K+; Figure 6A). The extent of apoptosis thus correlated with the degree of terminal differentiation of these cells. Interestingly, of the surviving L−S−K− cells, 11% were now L−S+K+, a more primitive phenotype indicating that a phenotypic dedifferentiation had occurred in these cells (Figure 6B). Similarly, although terminally differentiated (myeloid and B-lymphoid) cells treated with AZA and TSA underwent extensive apoptosis, the phenotype of some of the surviving cells was Lin−, a more immature cell phenotype (54% and 30% of the surviving myeloid-treated and B lymphoid–treated cells, respectively; Figure 6C-D), but no cells with a L−S+K+ phenotype were detected in either cell population (data not shown). Moreover, myeloid and B-lymphoid cells that had been treated with TSA and AZA in vitro had no repopulating activity when transplanted into mice (Figure 6E), indicating that the extent of their dedifferentiation is limited.
Similarly, treatment of primitive human CD34+38− cells with AZA/TSA caused low levels of apoptosis (1.3%; Figure 6F) and a high maintenance of undifferentiated (CD34+) cells during ex vivo culture compared with untreated control cells (90% vs 68% of cultured cells for the treated and control group, respectively, P < .05; Figure 6G), which correlated to a concomitant increase in the number of long-term culture colonies (986 vs 312 from treated and control group, respectively, P < .05; Figure 6H left). In contrast, treatment of differentiated CD34− cells with AZA/TSA caused high levels of apoptosis (27%; Figure 6F) and limited levels of phenotypic dedifferentiation into CD34+ cells (14% in treated CD34− cells; Figure 6G), which was associated with a limited acquisition of long-term culture cells from treated CD34− cells (5 colonies in the treated group only; Figure 6H right).
Taken together, these results demonstrate that hematopoietic cells at different stages of differentiation have distinct responses to epigenetic alterations; undifferentiated cells are permissive to changes in their chromatin structures, whereas differentiated cells are nonpermissive to epigenetic changes and exhibit high levels of apoptosis. This suggests that hematopoietic cells have an epigenetic flexibility that correlates to their degree of undifferentiation.
Discussion
Numerous studies on ES cells10-12 and hematopoietic progenitors16-18,21 have provided evidence for epigenetic regulation of stem cell fates during HSC maintenance. However, the effects of a particular epigenetic status on HSC cell fate decisions or on hematopoietic functions in vivo are key questions that still remain unresolved.
In the current study, we have attempted to identify the global epigenetic signature for the undifferentiated state of hematopoietic cells and determine its effect on hematopoietic functions in vivo. We first compared global CpG methylation in nonrepetitive elements of genes in human CD34+ cells to that in CD34− cells. We found a striking genome-wide undermethylation dip around the TSS and an overmethylation of flanking regions in undifferentiated CD34+ cells compared with CD34− cells.
To have further insight on this methylation pattern, genes exhibiting significant (P < .01) undermethylation dip around TSS region was identified (supplemental Table 1). Interestingly, 89 genes thus identified were significantly enriched with nuclear proteins for chromatin modeling (supplemental Table 2). When gene expression study was performed for selected genes in the group using real-time PCR, 10 of 11 genes examined showed higher level transcripts in CD34+ cells than in CD34− cells (supplemental Figure 2). These results suggest undermethylation near TSS is an epigenetic structure related to active transcription of genes, and that, at least, one function of such patterns in CD34+ cells should include active modeling of chromatin structures in undifferentiated state of the cells. Consistent with this view, we found that undifferentiated hematopoietic cells of both human and murine origins exhibited rather higher-level expression of the DNMT3a, DNMT3b, an enzymes for de novo DNA methylation being essential for self-renewal of hematopoietic cells,40 as well as higher levels of MeCP2 (supplemental Figure 3). Thus, undifferentiated hematopoietic cells, despite cellular conditions for higher DNA methylation, are under active maintenance of undermethylation dip around TSS, which allows higher-level transcription of genes, including those for chromatin remodeling. However, variations were also observed in the extent of undermethylation near TSS when 6 of the literature-based genes being overexpressed in primitive hematopoietic cells41 were randomly selected and subjected to pyrosequencing analysis (supplemental Figure 4). Further studies in larger-scale analysis would be necessary to elucidate genome-wide significance of undermethylation dip.
Interestingly, the genes with (CGI+) and without (CGI−) CpG islands were distinctly regulated by CpG methylation; CGI+ genes had a prominent undermethylation dip near TSS, whereas non-CGI genes were characterized with a TSS-localized undermethylation and a prominent overmethylation of the flanking regions. It has been previously shown that CGI− genes are highly enriched for lineage-specific genes, whereas CGI+ genes are largely composed of either developmental regulators or housekeeping genes.33,42,43 Consistent with this notion, our enrichment analysis revealed that the genes with significant (P < .01) overmethylation in the flanking regions are enriched with negative regulators of transcriptions or lineage-specific genes (supplemental Table 2). Thus, it appears that overmethylation in flanking regions is related to restriction for lineage-specific genes but derepression for transcription factors, whereas undermethylation near TSS is related to permissive expression of multiple transcriptional regulators. It is therefore probable that both undermethylation around TSS and flanking overmethylation may independently contribute to the low-level “poised” expression of lineage-specific genes, which is a characteristic of undifferentiated hematopoietic cells.16,17 A similar difference in the regulation of CGI+ and CGI− genes was also recently reported in a study using a murine hematopoietic progenitor cell line, where most poised H3K4Me2+/Me3− genes were CGI− genes, whereas unpoised genes were GGI+ genes.33 However, it is yet to be explored to what extent the “bivalent-like” DNA methylation patterns contribute to the chromatin structures in undifferentiated cells.
Importantly, in addition to dynamic maintenance of DNA methylation during undifferentiation, we also show that the dynamics of chromatin structures vary with hematopoietic differentiation. Previous studies have shown that chromatin exists in a dynamic equilibrium between “open” and “closed” states, the so-called “fluidity” of chromatin,44 and that these dynamic changes in the chromatin states may be mediated by nucleosome remodeling and histone acetylation.45 We found that undifferentiated hematopoietic cells displayed the characteristics of less condensed chromatin structures; they had higher levels of the active forms of histone modification and histone acetylation, similar to those seen in pluripotent ES cells.10,11 In addition, undifferentiated hematopoietic cells of both murine and human origin were enriched with both HATs and HDACs and exhibited a higher incorporation rate of histone acetylation compared with mature cells. These results suggest that the undifferentiated state of hematopoietic cells can be also characterized by a higher turnover rate of chromatin modifications, or chromatin fluidity, than differentiated cells.
However, one key question is whether such epigenetic signatures are predictive of and therefore determine a particular property of HSCs, particularly during hematopoietic processes in vivo. In previous studies using ex vivo culture models, chemically inhibiting epigenetic modifications resulted in changes in HSC cell fate and increased HSC self-renewal.46-48 However, it was shown that these in vitro cultures were prone to epigenetic changes,49 and the effect of epigenetic modification on in vivo hematopoietic functions remained, until now, unclear. Here, we found that treatment with TSA and AZA enhanced HSC self-renewal during bone marrow reconstitution as demonstrated by increased donor-derived CRUs. Interestingly, TSA preferentially promoted HSC self-renewal in vivo compared with AZA (Figure 5B top panel), whereas AZA rather than TSA has been shown to preferentially promote self-renewal in vitro,48 revealing that DNA methylation and histone acetylation have distinct effects on HSC properties in vitro and in vivo. In contrast, the self-renewal of HSCs in stationary phase bone marrow was not enhanced after chemically induced epigenetic modifications (Figure 5B bottom panel). The differences in HSC self-renewal observed for chemically treated “stimulated” and “steady-state” bone marrows suggest that priming and/or maintenance of undifferentiated state, rather than the direct induction of self-renewing divisions, is induced by the open chromatin structures after epigenetic modification.
In support of this, undifferentiated murine and hematopoietic cells treated with AZA and TSA had a higher maintenance of undifferentiated cells. Moreover, mature (L−S−K− or Lin+) cell populations exhibited dedifferentiation after similar treatments, indicating that the open chromatin structures of hematopoietic cells induce maintenance or acquisition of an undifferentiated state. In contrast to the response observed in undifferentiated hematopoietic cells, mature hematopoietic cells responded to the epigenetic treatments with rapid and extensive levels of apoptosis, which correlated to the degree of terminal differentiation of the cells. Thus, our findings reveal that the chromatin structures of undifferentiated hematopoietic cells are more dynamic than those of differentiated cells and that observed differences in permissiveness to epigenetic changes reflect differences in the epigenetic plasticity of the chromatins in hematopoietic cells. Consistent with our observations, ES cells were recently shown to have hyperdynamic chromatin proteins when the cells are in a pluripotent phase but proteins immobilized on chromatin on differentiation.50
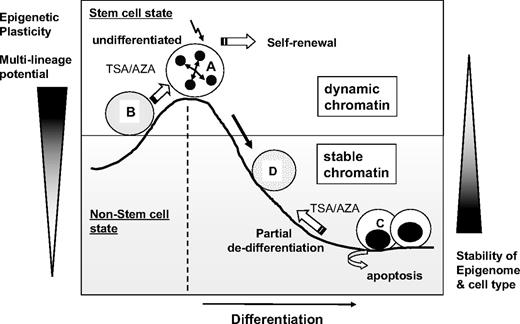
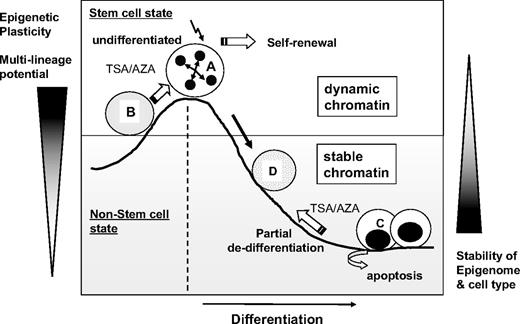
Therefore, as illustrated in Figure 7, we propose that the undifferentiated state of hematopoietic cells correlates to the level of epigenetic flexibility and, therefore, that high epigenetic plasticity correlates with a high multilineage differentiation potential. Further studies are required to better elucidate the functional significance of epigenetic regulation and chromatin plasticity on the multilineage potential and hematopoietic activities of HSCs. Nevertheless, in the current study, we show that the undifferentiated state of hematopoietic cells can be epigenetically characterized by a TSS-localized undermethylation dip and dynamic chromatin structures with high epigenetic plasticity.
Schematic illustration of the proposed model for the epigenetic plasticity of hematopoietic cells. Undifferentiated hematopoietic cells (A) have dynamic chromatin and display permissiveness to changes in chromatin structures and multilineage differentiation potential. In the undifferentiated state, epigenetic treatment (B) that opens chromatin structures (AZA/TSA) enhances HSC self-renewal when other extrinsic signals are present. In contrast, differentiated cells (C) have stable chromatin and are resistant to epigenetic changes. Epigenetic treatment with AZA/TSA leads to a partial dedifferentiation toward more immature cell phenotypes (D), although most of differentiated cells undergo extensive apoptosis. Thus, epigenetic plasticity correlates to the level of undifferentiation of hematopoietic cells.
Schematic illustration of the proposed model for the epigenetic plasticity of hematopoietic cells. Undifferentiated hematopoietic cells (A) have dynamic chromatin and display permissiveness to changes in chromatin structures and multilineage differentiation potential. In the undifferentiated state, epigenetic treatment (B) that opens chromatin structures (AZA/TSA) enhances HSC self-renewal when other extrinsic signals are present. In contrast, differentiated cells (C) have stable chromatin and are resistant to epigenetic changes. Epigenetic treatment with AZA/TSA leads to a partial dedifferentiation toward more immature cell phenotypes (D), although most of differentiated cells undergo extensive apoptosis. Thus, epigenetic plasticity correlates to the level of undifferentiation of hematopoietic cells.
An Inside Blood analysis of this article appears at the front of this issue.
The online version of this article contains a data supplement.
The publication costs of this article were defrayed in part by page charge payment. Therefore, and solely to indicate this fact, this article is hereby marked “advertisement” in accordance with 18 USC section 1734.
Acknowledgments
This work was supported by the Korea Science and Engineering Foundation (grant 2008-05981) and in part by the Ministry of Health, Welfare & Family of the Republic of Korea, High-Performance Cell Therapy R&D Project (0405-DB01-0104-0006).
Authorship
Contribution: Y.S.C., H.J.K., S.-H.H., K.-R.K., S.A., J.-H.P., and S.L. performed experiments; T.-M.K. performed bioinformatics analysis and interpretation; and I.-H.O. designed experiments, interpreted data, supported grant, and wrote the manuscript.
Conflict-of-interest disclosure: S.A. is the founder of Genomic Tree Inc. The remaining authors declare no competing financial interests.
Correspondence: Il-Hoan Oh, Catholic Institute of Cell Therapy & Department of Cellular Medicine, Catholic University of Korea, School of Medicine, 505 Banpo-Dong, Seocho-Ku, Seoul, Korea; e-mail: iho@catholic.ac.kr.
References
Author notes
Y.S.C. and H.J.K. contributed equally to this study.
Supplemental data
The 89 genes identified to exhibit significant under-methylation dip around TSS, 189 genes with significant over-methylation in the flanking upstream regions and 206 genes with significant over-methylaiton in the flanking downstream regions were analyzed by DAVID (http://www.david.nih.gov) as described in Materials and Methods. Shown are the lists of significant functional annotations (P<0.01) for each group of gene sets identified. (A) Genes with significant under-methylation dip around TSS. (B) Genes with over-methylation in the flanking regions of TSS.

