Abstract
GCS-100 is a galectin-3 antagonist with an acceptable human safety profile that has been demonstrated to have an antimyeloma effect in the context of bortezomib resistance. In the present study, the mechanisms of action of GCS-100 are elucidated in myeloma cell lines and primary tumor cells. GCS-100 induced inhibition of proliferation, accumulation of cells in sub-G1 and G1 phases, and apoptosis with activation of both caspase-8 and -9 pathways. Dose- and time-dependent decreases in MCL-1 and BCL-XL levels also occurred, accompanied by a rapid induction of NOXA protein, whereas BCL-2, BAX, BAK, BIM, BAD, BID, and PUMA remained unchanged. The cell-cycle inhibitor p21Cip1 was up-regulated by GCS-100, whereas the procycling proteins CYCLIN E2, CYCLIN D2, and CDK6 were all reduced. Reduction in signal transduction was associated with lower levels of activated IκBα, IκB kinase, and AKT as well as lack of IκBα and AKT activation after appropriate cytokine stimulation (insulin-like growth factor-1, tumor necrosis factor-α). Primary myeloma cells showed a direct reduction in proliferation and viability. These data demonstrate that the novel therapeutic molecule, GCS-100, is a potent modifier of myeloma cell biology targeting apoptosis, cell cycle, and intracellular signaling and has potential for myeloma therapy.
Introduction
Over the past decade, advances in the understanding of myeloma biology and the microenvironment have translated into improved outcomes with novel therapeutic agents.1,2 Apoptosis, cell cycle, PI3K/AKT, and angiogenesis pathways are all deregulated and lend themselves to therapeutic targeting.2 Antiapoptotic proteins MCL-1, BCL-2, and BCL-XL are commonly increased,3 and microenvironment factors, such as interleukin-6 (IL-6), tumor necrosis factor-α (TNF-α), and vascular endothelial growth factor, contribute to oncogenesis via these pathways.4 Conversely, disruption of signaling pathways leading to a decrease in MCL-1/BCL-XL expression is associated with increased apoptosis5,6 via the mitochondrial/intrinsic pathway, emphasizing the pivotal role for these antiapoptotic molecules in myeloma cell survival.7,8
Disruption of normal proliferation and cell-cycle control are additional factors in myeloma cell survival9 with constitutive expression of PI3K/AKT observed in many myeloma cell lines.10-12 AKT activation is enhanced by multiple cytokines within the bone marrow4,13-15 and is associated with cell proliferation,13,15-17 cell survival,11,12,14 adhesion,18 and migration.19 AKT-mediated phosphorylation of forkhead transcription factor and glycogen synthase kinase 3β (GSK3β) leads to their inactivation with subsequent down-regulation of p27Kip1, up-regulation of cyclin D1, and ultimately G1/S phase progression. Inhibition of PI3K reverses this process and leads to G1 cell-cycle arrest.15,16 In addition, the proapoptotic protein BAD is activated by AKT13 and mediates insulin-like growth factor-1 (IGF-1)–associated tumor necrosis factor-related apoptosis-inducing ligand insensitivity. Activation of AKT by IGF-1 stimulates nuclear factor-κB (NF-κB) and subsequently up-regulation of FLIP (caspase-8 inhibitor), XIAP (caspase-9 inhibitor), and survivin (caspase-3 inhibitor),11 resulting in increased apoptosis resistance. Drugs targeting this process reduce myeloma cell proliferation and survival.18
Galectin-3 is expressed in myeloma cells and is 1 of a group of 14 lectins that bind β-galactoside-containing carbohydrates, via a carbohydrate recognition domain.20,21 It is predominantly localized in the cytoplasm where it acts to suppress apoptosis but may translocate to the nucleus22 and/or secrete from the cytoplasm where it then has proapoptotic effects.23 Galectin-3 appears important in several malignancies, including B-cell lymphomas, with a role in angiogenesis and metastases.20,21,23 There is specific sequence homology to the BH-1 domain of BCL-224 within the carbohydrate recognition domain of galectin-3 containing the NWGR motif critical to the formation of BCL-2 dimers.25 Galectin-3/BCL-2 heterodimerization enhances the BCL-2 antiapoptotic effect.26 Little, however, is known about the role of galectin-3 in multiple myeloma. An observational study of bone marrow samples detected galectin-3 expression in 25% of 16 samples studied.21 A second study observed the expression of galectin-3 in 8 cell lines27 and further confirmed this molecule as a potential target for myeloma therapy.
GCS-100, a modified citrus pectin carbohydrate, binds to galectin-3. Activity has been observed in several animal tumor models28-30 and phase 1 studies in solid tumors31 and CLL32,33 with minimal toxicity to normal lymphocytes27 or myelopoiesis.33 Antimyeloma activity for GCS-100 has previously been reported with synergy in combination with dexamethasone, bortezomib, or PK11195.27
This study examines the effects of GCS-100 as a promoter of apoptosis in myeloma cells.
Methods
Reagents
Recombinant human IGF-1, recombinant human IL-6, and recombinant human TNF-α were purchased from PeproTech EC. Z-VAD-fmk was purchased from Promega. GCS-100 was supplied by Prospect Therapeutics. Antibodies to the following proteins were used: galectin 3 (clone 194804) and BID (R&D Systems), caspase-8 (3-1-9), MCL-1, (22) BCL-XL (2H12; all BD Biosciences PharMingen), BAX (2D2), BCL-2, CDK2 (D12), and MCL-1 (S-19; Santa Cruz Biotechnology), PUMA and BAK (Abcam), BIM (Chemicon), NOXA (114C307.1; Alexis Biochemicals), caspase-9 (5B4) and caspase-3 (both Stressgen), BAD, Cyclin D2, Cyclin E2, CDK6 (DCS83), CDK4 (DCS156), p15INK4B, p16INK4A, p21Cip1 (DCS60), p27Kip1, IκBα (112B2), phospho-IκBα (ser32/36; 5A5), IκB kinase α (IKKα), phospho-IKKα (ser180), phospho-NF-κBp65 (ser536; 7F1), phospho-AKT (ser473), and phospho-STAT3 (Tyr705; 3E2; all Cell Signaling), β-actin (clone AC-74; Sigma-Aldrich), and goat anti–mouse–conjugated horseradish peroxidase and goat anti–rabbit–conjugated horseradish peroxidase (both BD Biosciences PharMingen). All other materials were supplied by Sigma-Aldrich unless stated.
Cell culture
Myeloma cell lines U266 and RPMI 8226 were purchased from ECACC. OPM-2 cells were a kind gift from Professor T. Lapin (Belfast, United Kingdom). Cell lines were cultured in RPMI 1640 culture medium supplemented with 10% fetal bovine serum (FBS), 2mM glutamine (all PAA Laboratories), 100 U/mL penicillin, and 0.1 mg/mL streptomycin in a humidified incubator with 5% CO2 at 37°C. For apoptosis assessment, determination of mitochondrial membrane potential, and cell-cycle profiling, RPMI 8226 and U266 cells (5 × 10⁵ cells/mL) were cultured with GCS-100 (0-800 μg/mL) for up to 72 hours and analyzed as described in the appropriate section.
The influence of caspase activation on MCL-1 was assessed by incubating RPMI 8226 cells (5 × 10⁵ cells/mL), with or without the pan caspase inhibitor Z-VAD-fmk (50μM), for 1 hour before exposure to GCS-100 (500 μg/mL) for 24 hours. Protein expression was assessed by Western blot.
To determine the inhibitory effect of GCS-100 on signaling pathways, RPMI 8226 cells (5 × 10⁵ cells/mL) were resuspended in RPMI 1640 with 1% FBS and incubated at 37°C for 1 hour. Cells were treated with GCS-100 (500 μg/mL) or phosphate-buffered saline (PBS) for 2 hours followed by stimulation with IGF-1 (100 ng/mL), TNF-α (5 ng/mL), or IL-6 (10 ng/mL) for 30 minutes.
Cell proliferation
Cell viability was assessed using the Alamar Blue (BioSource International) assay according to the manufacturer's instructions. A total of 200 μL of RPMI 8226, U266, and OPM2 cells was seeded in 96-well plates at a final density of 2.5 × 10⁵ cells/mL in complete medium. GCS-100 was added (0-1500 μg/mL), and plates were incubated at 37°C for 72 hours. A total of 10% vol/vol Alamar Blue was added 6 hours from the end of incubation. The optical density of each well was measured at 570 and 600 nm using a Spectramax 340 spectrophotometer (Molecular Devices Ltd). Cell viability was calculated compared with positive (untreated) control cells.
Apoptosis induction
Apoptosis induction was assessed using annexin V (BD Biosciences) according to the manufacturer's instructions (annexin V–FITC, 1:20; 4′,6-diamidino 2 phenylindole dihydrochloride [DAPI], 200 ng/mL). Cells were analyzed using a BD LSRII flow cytometer (BD Biosciences) and FlowJo, Version 7.2 software (TreeStar).
Mitochondrial membrane potential (Δψm)
Cells were washed with cold PBS, resuspended in complete medium with 40nM 3,3′-dihexyloxacarbocyanide iodide (DiOC6(3)), and incubated at 37°C in the dark for 15 minutes. Cells were then washed with PBS, resuspended in PBS with DAPI (200 ng/mL), and analyzed by flow cytometry (BD LSRII) and FlowJo, Version 7.2 (TreeStar).
Cell-cycle assessment
Cells were harvested, washed in PBS, and resuspended in 70% ethanol. After incubation at 4°C for 60 minutes, cells were washed with PBS and resuspended in propidium iodide (100 μg/mL) and RNAse (400 μg/mL) for 30 minutes at 37°C. Cell cycle was assessed using flow cytometry (BD LSRII) and FlowJo, Version 7.2 (TreeStar).
Western blotting
Cells were harvested (5 × 10⁶), washed with PBS, and lysed in an equal volume of lysis buffer (50mM Tris base, pH 7.4, 250mM NaCl, 1mM ethylenediaminetetraacetic acid, 0.1% Triton X-100, 1% NP40, 1mM sodium orthovanadate, 2mM phenylmethylsulfonyl fluoride, and 2% protease inhibitor cocktail [aprotinin, leupeptin, bestatin, pepstatin-A, E-64, and 4-(2-aminoethyl)benzenesulfonyl fluoride]) on ice for 30 minutes. The solution was cleared by centrifugation at 10 000g for 20 minutes at 4°C. Protein quantitation was determined using the Bradford method (Bio-Rad Dc Protein Assay). Equal protein concentrations were loaded in denaturing sample buffer (125mM Tris-HCl, pH 6.8, glycerol 10%, sodium dodecyl sulfate [SDS] 2%, 2-mercaptoethanol 5%), separated by 10% or 12% SDS-polyacrylamide gel electrophoresis (PAGE), and electrotransferred to Immobilon P polyvinylidene difluoride (PVDF) membrane. The membranes were blocked for 1 hour in 5% dried milk in Tris-buffered saline with Tween-20 (TBST; 20mM Tris base, pH 7.5, 150mM NaCl, 0.5% Tween-20) or 5% bovine serum albumin/TBST (for phosphor-specific antibodies). Membranes were incubated overnight at 4°C, washed for 30 minutes in TBST, followed by incubation for 1 hour with secondary antibody. After a final washing step with TBST for 30 minutes, then TBS (20mM Tris base, pH 7.5, 150mM NaCl) for 20 minutes, bound antibody was visualized using Supersignal West Pico Chemiluminescent ECL (Perbio Science UK). Results shown are representative of a minimum of 2 independent experiments.
Primary cell culture, viability assay, and stromal cell coculture
Primary plasma cells were obtained from bone marrow aspirate samples from patients with relapsed myeloma after ethical approval from Barts and The London School of Medicine and written informed consent. All samples were collected adhering to Good Clinical Practice and the Helsinki Protocol.
Primary samples were collected into ethylenediaminetetraacetic acid, mixed 1:1 with RPMI 1640, and enriched for CD138-positive cells by negative selection (antiglycophorin A, CD2, CD14, CD33, CD41, CD45RA, CD66b) using 50 μL/mL RosetteSep MM-enrichment cocktail (Stem Cell Technologies) at room temperature for 20 minutes following the manufacturer's instructions. Mononuclear cells were separated by Ficoll-Hypaque (Nycomed) and yielded more than 95% plasma cell purity.
Primary plasma cells were cultured in RPMI 1640 with 10% FBS and 1% penicillin/streptomycin at 37°C and humidified 5% CO2.
To assess the effect of GCS-100 on primary cell viability and proliferation, 1 × 10⁵ cells/mL were cultured in 96-well plates for 24 hours and then incubated with GCS-100 (0, 350, 500, or 700 μg/mL) for 48 hours. Cell viability and cell number were assessed using the PCA-96 ViaCount Assay (Guava Technologies) by adding Viacount Flex reagent as per the manufacturer's instructions. A PCA-96 automated cell analyzer with Cytosoft analysis software was used (both Guava Technologies).34 The effect of GCS-100 was also assessed by the ViaCount Assay on U266 cells and the human stromal cell line HS-5.
The influence of coculture with stromal cells on GCS-100 activity was assessed. HS-5 stromal cells were plated to a final density of 2.5 × 10⁴ cells/mL in 96-well plates and allowed to adhere overnight. The following day, 1 × 10⁵ primary myeloma cells/mL were layered over the HS-5 stroma, and recombinant human interleukin-6 (R&D Systems) was added at a final concentration of 10 ng/mL. After a 48-hour culture, GCS-100 effects on cell viability and cell number were measured as described.
Statistical analysis
The Student paired t test was used to compare quantitative changes observed from a minimum of 2 independent experiments. A P value less than or equal to .05 was considered statistically significant.
Results
GCS-100 inhibits myeloma cell growth, induces apoptosis, and is associated with accumulation of cells in sub-G1 with corresponding loss of cells in S and G2/M phase
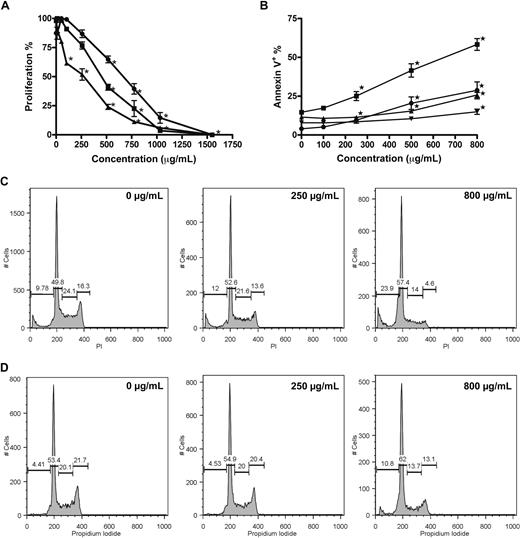
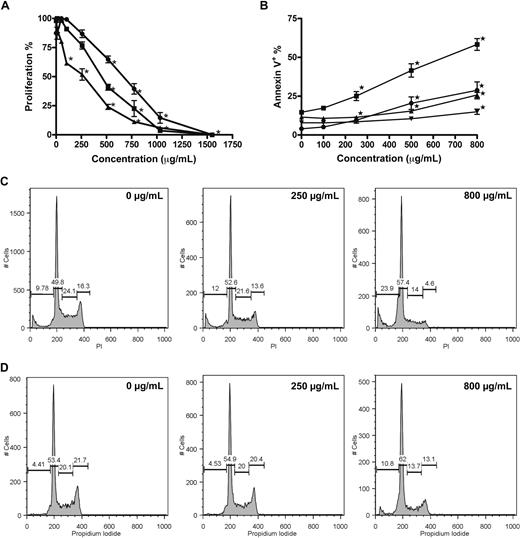
A dose-dependent reduction of proliferation was confirmed for RPMI 8226, U266, and OPM-2 cells incubated with GCS-100 (0-1500 μg/mL) for 48 hours with growth inhibition assessed using the Alamar Blue assay. RPMI 8226 and OPM-2 cells were markedly more sensitive than U266 cells (half-maximal effective concentration: 498, 401, and 737 μg/mL, respectively; Figure 1A). A significant dose-dependent induction of apoptosis occurred in both RPMI 8226 and U266 cells, with the mean proportion of annexin V–positive RPMI 8226 cells increasing from 14% in control cells to 25% (P < .001), 41% and 58% (both P < .001) when incubated with 250 μg/mL, 500 μg/mL, or 800 μg/mL GCS-100, respectively (Figure 1B). U266 cells also underwent apoptosis but required higher concentrations of GCS-100 (annexin V–positive control cells, 11.5%; 500 μg/mL, 15%, P = .006; 800 μg/mL, 26%, P < .001; Figure 1B). In assessment of early apoptosis with RPMI 8226 cells, the percentage of apoptotic cells (annexin V–positive/DAPI-negative) increased from 4% in control cells to 9% (P = .002), 20% (P < .001), and 28% (P < .001) when treated with 250, 500, or 800 μg/mL, respectively. Early apoptosis was again less marked in U266 cells (8%-14% at 800 μg/mL, P = .008; Figure 1B).
GCS-100 inhibits proliferation, induces apoptosis, and modifies cell-cycle profile of myeloma cell lines. (A) Alamar Blue assessment of the effect of GCS-100 on proliferation of RPMI 8226 (■), U266 (●), and OPM-2 (▴) cells. Cells were cultured with GCS-100 (0-1500 μg/mL) for 48 hours and proliferation assessed compared with nonexposed control cells. Results are the mean of 3 independent experiments ± SEM. *Significant difference (P ≤ .01) compared with untreated cells. (B) Apoptosis induction of RPMI 8226 (● indicates RPMI 8226; and ▾ indicates U266) cells by GCS-100 was assessed by flow cytometry. Cells were cultured with GCS-100 (0-800 μg/mL) for 72 hours and then examined for binding of annexin V–FITC and uptake of DAPI. Annexin V–positive/DAPI-negative cells (● indicates RPMI 8226; and ▾ indicates U266) were classified as early apoptotic, whereas annexin V–positive cells (● indicates RPMI 8226; and ▾ indicates U266) were classified as apoptotic/necrotic. The results of 3 independent experiments ± SEM are shown. *Significant difference (P ≤ .01) compared with untreated cells. (C-D) Cell-cycle changes effected by GCS-100. RPMI 8226 (C) and U266 (D) cells were cultured with GCS-100 (0-800 μg/mL) for 48 hours. The cells were then permeabilized and stained with propidium iodide (PI). Cell-cycle profile was assessed by flow cytometry, and the proportion of cells in the sub-G1 fraction, G1 phase, S phase, and G2/M phase was measured. Representative histograms of cells treated with 0, 250, and 800 μg/mL GCS-100 are shown (concentration is displayed in the top right of histogram).
GCS-100 inhibits proliferation, induces apoptosis, and modifies cell-cycle profile of myeloma cell lines. (A) Alamar Blue assessment of the effect of GCS-100 on proliferation of RPMI 8226 (■), U266 (●), and OPM-2 (▴) cells. Cells were cultured with GCS-100 (0-1500 μg/mL) for 48 hours and proliferation assessed compared with nonexposed control cells. Results are the mean of 3 independent experiments ± SEM. *Significant difference (P ≤ .01) compared with untreated cells. (B) Apoptosis induction of RPMI 8226 (● indicates RPMI 8226; and ▾ indicates U266) cells by GCS-100 was assessed by flow cytometry. Cells were cultured with GCS-100 (0-800 μg/mL) for 72 hours and then examined for binding of annexin V–FITC and uptake of DAPI. Annexin V–positive/DAPI-negative cells (● indicates RPMI 8226; and ▾ indicates U266) were classified as early apoptotic, whereas annexin V–positive cells (● indicates RPMI 8226; and ▾ indicates U266) were classified as apoptotic/necrotic. The results of 3 independent experiments ± SEM are shown. *Significant difference (P ≤ .01) compared with untreated cells. (C-D) Cell-cycle changes effected by GCS-100. RPMI 8226 (C) and U266 (D) cells were cultured with GCS-100 (0-800 μg/mL) for 48 hours. The cells were then permeabilized and stained with propidium iodide (PI). Cell-cycle profile was assessed by flow cytometry, and the proportion of cells in the sub-G1 fraction, G1 phase, S phase, and G2/M phase was measured. Representative histograms of cells treated with 0, 250, and 800 μg/mL GCS-100 are shown (concentration is displayed in the top right of histogram).
The effect on cell-cycle profile was examined (Figure 1C-D). Cells treated with GCS-100 (0-800 μg/mL) for 48 hours showed a dose-dependent accumulation of cells in sub-G1 (RPMI 8226 cells; untreated mean 11.1% to 800 μg/mL mean 24.5%, P < .001; U266 cells; untreated mean 6.6% to 800 μg/mL mean 20.3%, P < .001; Figure 1C,D) and G1 phase (RPMI 8226 cells; untreated mean 46.9% to 800 μg/mL mean 52.0%, P < .01; U266 cells; untreated mean 51.7% to 800 μg/mL mean 61.4%, P < .003; Figure 1C,D) with a reduction of cells in S phase (RPMI 8226 cells; untreated mean 22.1% to 800 μg/mL mean 15.4%, P < .004; U266 cells; untreated mean 20.1% to 800 μg/mL mean 11%, P < .001; Figure 1C,D) and G2/M phase (RPMI 8226 cells; untreated mean 19.5% to 800 μg/mL mean 7.8%, P < .001; U266 cells; untreated mean 20.6% to 800 μg/mL mean 11.6%, P < .001; Figure 1C,D). The effects were consistently more marked in RPMI 8226 cells.
Apoptosis induction is associated with loss of mitochondrial membrane potential and activation of caspase-3, -8, and -9
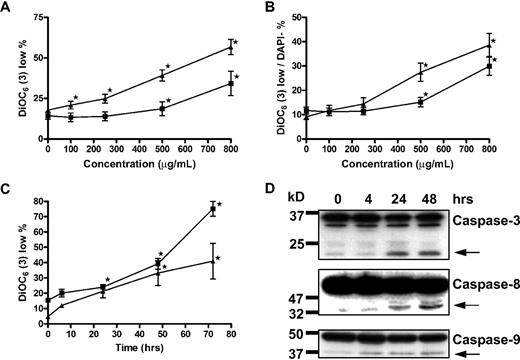
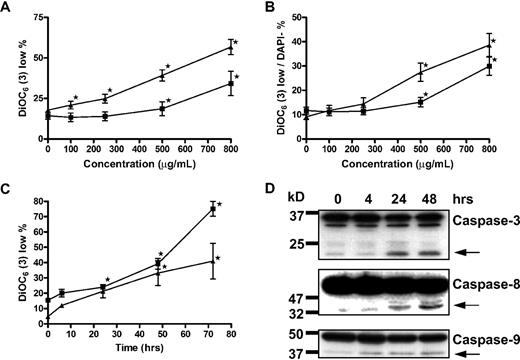
It has been reported that GCS-100–associated apoptosis in myeloma cells is associated with activation of classic extrinsic cell death-signaling pathways caspase-8/caspase-3/poly(ADP-ribose) polymerase rather than caspase-9 signaling.27 However, the putative target of GCS-100, galectin-3, has been observed to augment prosurvival proteins of the BCL-2 family, which protect the integrity of the mitochondrial membrane.26 The effects of GCS-100 on transmembrane mitochondrial potential (Δψm) were determined by the uptake of DiOC6(3).35,36 Incubation of RPMI 8226 with all concentrations of GCS-100 more than 100 μg/mL for 48 hours was associated with a significant increase in the proportion of cells with low DiOC6(3) uptake (loss of Δψm; control mean, 17%, 100 μg/mL, 21%, P = .03; 250 μg/mL, 25%, P < .003; 500 μg/mL, 40%, P < .001; and 800 μg/mL, 57%, P < .001; Figure 2A). The effect on Δψm for U266 cells was less pronounced; however, the proportion of cells with low DiOC6(3) uptake increased from 14% in control cells to 34% in those exposed to 800 μg/mL of GCS-100 (P = .02; Figure 2A). Characterizing the effect of GCS-100 specifically on the mitochondria, the proportion of cells with low DiOC6(3) uptake was examined in cells that excluded the viability dye DAPI, thereby ensuring that only cells with an intact cell membrane were examined. RPMI 8226 cells incubated with 250 μg/mL or greater for 48 hours had a significant fall in Δψm. The proportion of DiOC6(3) low/DAPI-negative cells rose from 9% at baseline to 14% (P = .01), 27% (P < .001), and 39% (P < .001) when exposed to 250 μg/mL, 500 μg/mL, or 800 μg/mL, respectively (Figure 2B). Similarly with U266 cells, there was a significant increase in the proportion of DiOC6(3) low/DAPI-negative cells from 11% at baseline to 15% (P = .02) and 30% (P < .001) when treated with 500 μg/mL and 800 μg/mL GCS-100, respectively (Figure 2B). The effect of GCS-100 on RPMI 8226 and U266 cells was also examined over time (Figure 2C). A significant increase in DiOC6(3) low cells was detected after 24 hours of incubation with 500 μg/mL or 800 μg/mL GCS-100 in RPMI 8226 (P < .001) or U266 (P ≤ .04) cells, respectively (Figure 2C), confirming both a time- and dose-dependent effect on transmembrane mitochondrial potential by GCS-100.
Apoptosis induction by GCS-100 is associated with a time- and dose-dependent loss of mitochondrial transmembrane potential and caspase cleavage. (A-B) RPMI 8226 (▴) and U266 (■) were incubated with GCS-100 (0-800 μg/mL) for 48 hours. Mitochondrial transmembrane potential was assessed by examining uptake of DiOC6(3) by flow cytometry, where low DiOC6(3) indicates loss of transmembrane potential. The proportion of cells with low DiOC6(3) (A) and the fraction of DAPI-negative cells with low DiOC6(3) (B) are displayed. Results are the mean ± SEM of triplicate experiments. *Significant difference compared with nonexposed cells (P ≤ .05). (C) RPMI 8226 (▴) and U266 (■) cells were cultured with 500 μg/mL (RPMI 8226) or 800 μg/mL (U266) GCS-100 for up to 72 hours followed by mitochondrial transmembrane potential assessment using DiOC6(3). Results are the mean ± SEM of 3 independent experiments. *Significant difference compared with nonexposed cells (P ≤ .05). (D) Western blot analysis. RPMI 8226 cells were cultured with 500 μg/mL GCS-100 for up to 48 hours. Whole-cell lysates were prepared, and 50 μg of protein was resolved by 12% SDS-PAGE. Protein was transferred to PVDF membrane and probed with anticaspase-9, anticaspase-8, and anticaspase-3 antibodies that detect unprocessed and cleaved protein (←). Molecular weight markers are shown on the left. Representative results of a minimum of 2 independent experiments are shown.
Apoptosis induction by GCS-100 is associated with a time- and dose-dependent loss of mitochondrial transmembrane potential and caspase cleavage. (A-B) RPMI 8226 (▴) and U266 (■) were incubated with GCS-100 (0-800 μg/mL) for 48 hours. Mitochondrial transmembrane potential was assessed by examining uptake of DiOC6(3) by flow cytometry, where low DiOC6(3) indicates loss of transmembrane potential. The proportion of cells with low DiOC6(3) (A) and the fraction of DAPI-negative cells with low DiOC6(3) (B) are displayed. Results are the mean ± SEM of triplicate experiments. *Significant difference compared with nonexposed cells (P ≤ .05). (C) RPMI 8226 (▴) and U266 (■) cells were cultured with 500 μg/mL (RPMI 8226) or 800 μg/mL (U266) GCS-100 for up to 72 hours followed by mitochondrial transmembrane potential assessment using DiOC6(3). Results are the mean ± SEM of 3 independent experiments. *Significant difference compared with nonexposed cells (P ≤ .05). (D) Western blot analysis. RPMI 8226 cells were cultured with 500 μg/mL GCS-100 for up to 48 hours. Whole-cell lysates were prepared, and 50 μg of protein was resolved by 12% SDS-PAGE. Protein was transferred to PVDF membrane and probed with anticaspase-9, anticaspase-8, and anticaspase-3 antibodies that detect unprocessed and cleaved protein (←). Molecular weight markers are shown on the left. Representative results of a minimum of 2 independent experiments are shown.
Loss of Δψm is associated with mitochondrial/caspase-9 apoptosis. Further characterization of cell death in RPMI 8226 cells by detection of caspase-9, -8, and -3 activation was assessed by Western blot analysis (Figure 2D). Caspase-8 and caspase-9 cleavage was observed after 4 hours of exposure to 500 μg/mL GCS-100, and activation of caspase-3 was observed after 24-hour GCS-100 exposure, suggesting that the intrinsic and extrinsic apoptosis pathways are activated with GCS-100–induced apoptotic cell death.
GCS-100 reduces prosurvival proteins MCL-1 and BCL-XL
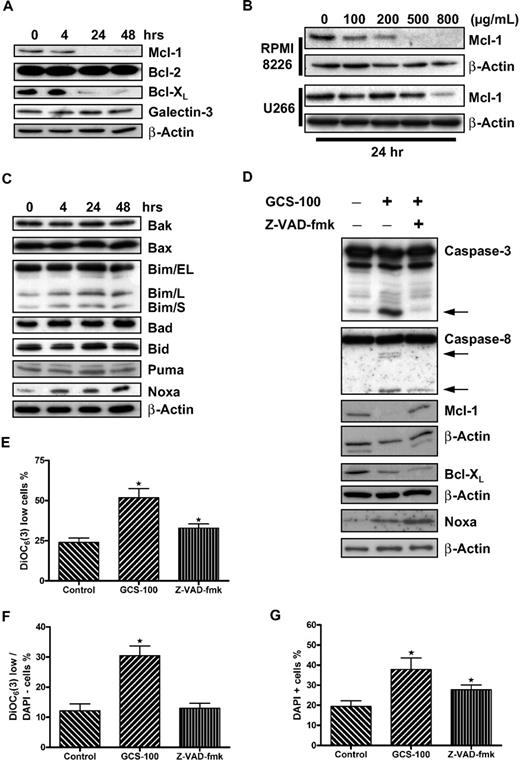
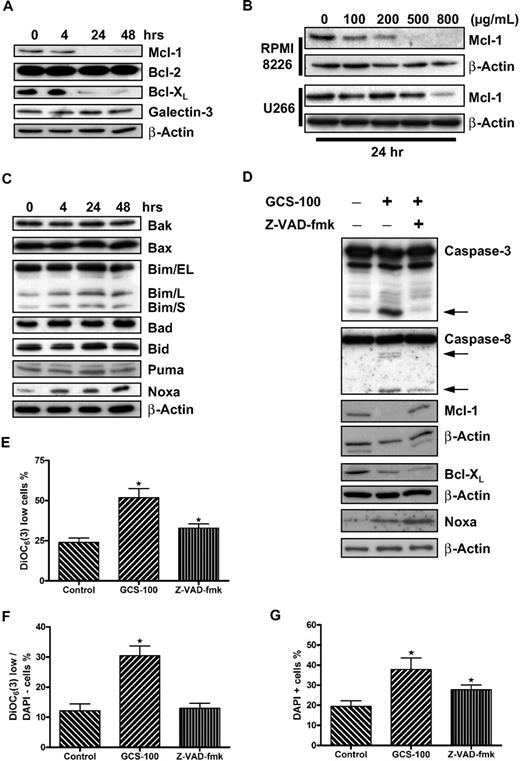
The BCL-2 family protein MCL-1 has been shown to be essential to the survival of myeloma cells.7,8 Western blot analysis of RPMI 8226 cells exposed to GCS-100 (500 μg/mL) demonstrated a reduction of both MCL-1 and BCL-XL levels after 24 hours of exposure (Figure 3A). Levels of BCL-2 and galectin-3 expression, as expected, were not altered. MCL-1 reduction in RPMI 8226 cells was concentration dependent and occurred at all doses greater than 100 μg/mL, whereas reduction of MCL-1 in U266 cells was less pronounced, requiring up to 800 μg/mL GCS-100 (Figure 3B).
GCS-100 is associated with a time- and dose-dependent reduction of critical prosurvival proteins and up-regulation of the proapoptotic protein NOXA. (A) Whole-cell lysates were prepared from RPMI 8226 cells cultured with 500 μg/mL GCS-100 for up to 48 hours, and protein expression was examined by Western blot. A total of 25 μg of protein was separated by 12% SDS-PAGE. Protein was transferred to PVDF membrane and probed with the indicated antibodies to prosurvival BCL-2 family proteins. β-Actin was used to ensure equal loading. (B) RPMI 8226 or U266 cells were exposed to the indicated concentration of GCS-100 for 24 hours. Whole-cell lysates were prepared, and 50 μg of protein was separated by 12% SDS-PAGE, transferred to PVDF membrane, and probed with anti–MCL-1 antibody. β-Actin was used to demonstrate equal protein loading. (C) Whole-cell lysates were prepared from RPMI 8226 cells cultured with 500 μg/mL GCS-100 for up to 48 hours, and protein expression was examined by Western blot. A total of 25 μg of protein was separated by 12% or 15% SDS-PAGE. Protein was transferred to PVDF membrane and probed with the indicated antibodies. β-Actin was used to ensure equal loading. (D) RPMI 8226 cells were incubated with the pan-caspase inhibitor Z-VAD-fmk (50μM) or dimethyl sulfoxide (DMSO) for 1 hour and then were cultured in the presence or absence of GCS-100 (500 μg/mL) for 24 hours. Protein expression was examined by Western blot (25 μg of protein, 12% SDS-PAGE). indicates caspase cleavage products. β-Actin was used as a loading control. (E-G) The effect of caspase inhibition on GCS-100 mediated loss of mitochondrial transmembrane potential. RPMI 8226 cells were incubated for 1 hour with Z-VAD-fmk or DMSO and then cultured with GCS-100 (500 μg/mL) for 48 hours after which uptake of DiOC6(3) was assessed by flow cytometry as previously described. The proportion of DiOC6(3) low cells (E), DAPI-negative/DiOC6(3) low cells (F), and DAPI-positive cells (G) was assessed. GCS-100 on the x-axis indicates preincubation with DMSO (Z-VAD-fmk control), and Z-VAD-fmk on x-axis indicates preincubation with Z-VAD-fmk followed by GCS-100. Results are mean ± SEM of 3 independent experiments. *Significant difference (P ≤ .05) from untreated control. DiOC6(3).
GCS-100 is associated with a time- and dose-dependent reduction of critical prosurvival proteins and up-regulation of the proapoptotic protein NOXA. (A) Whole-cell lysates were prepared from RPMI 8226 cells cultured with 500 μg/mL GCS-100 for up to 48 hours, and protein expression was examined by Western blot. A total of 25 μg of protein was separated by 12% SDS-PAGE. Protein was transferred to PVDF membrane and probed with the indicated antibodies to prosurvival BCL-2 family proteins. β-Actin was used to ensure equal loading. (B) RPMI 8226 or U266 cells were exposed to the indicated concentration of GCS-100 for 24 hours. Whole-cell lysates were prepared, and 50 μg of protein was separated by 12% SDS-PAGE, transferred to PVDF membrane, and probed with anti–MCL-1 antibody. β-Actin was used to demonstrate equal protein loading. (C) Whole-cell lysates were prepared from RPMI 8226 cells cultured with 500 μg/mL GCS-100 for up to 48 hours, and protein expression was examined by Western blot. A total of 25 μg of protein was separated by 12% or 15% SDS-PAGE. Protein was transferred to PVDF membrane and probed with the indicated antibodies. β-Actin was used to ensure equal loading. (D) RPMI 8226 cells were incubated with the pan-caspase inhibitor Z-VAD-fmk (50μM) or dimethyl sulfoxide (DMSO) for 1 hour and then were cultured in the presence or absence of GCS-100 (500 μg/mL) for 24 hours. Protein expression was examined by Western blot (25 μg of protein, 12% SDS-PAGE). indicates caspase cleavage products. β-Actin was used as a loading control. (E-G) The effect of caspase inhibition on GCS-100 mediated loss of mitochondrial transmembrane potential. RPMI 8226 cells were incubated for 1 hour with Z-VAD-fmk or DMSO and then cultured with GCS-100 (500 μg/mL) for 48 hours after which uptake of DiOC6(3) was assessed by flow cytometry as previously described. The proportion of DiOC6(3) low cells (E), DAPI-negative/DiOC6(3) low cells (F), and DAPI-positive cells (G) was assessed. GCS-100 on the x-axis indicates preincubation with DMSO (Z-VAD-fmk control), and Z-VAD-fmk on x-axis indicates preincubation with Z-VAD-fmk followed by GCS-100. Results are mean ± SEM of 3 independent experiments. *Significant difference (P ≤ .05) from untreated control. DiOC6(3).
Apoptosis induction is associated with induction of NOXA expression
Our study suggests crosstalk between the extrinsic and intrinsic apoptosis pathways, an event often mediated by BH3-only proteins. To address this, expression of multidomain and BH3-only proteins with MCL-1/BCL-XL specificity were examined by Western blot analysis. The multidomain proteins BAX and BAK were both expressed in nonexposed cells, and levels remained unchanged after exposure to GCS-100 (Figure 3C). The BH3-only proteins BAD, BID, and PUMA were also unchanged in RPMI 8226 cells after incubation with GCS-100 (500 μg/mL). There was, however, a marked increase in expression of NOXA and a small increase in the long and short forms of BIM (BIM/L and BIM/S; Figure 3C).
Caspase inhibition prevents MCL-1 but not BCL-XL reduction
To further characterize the reduction in MCL-1 and BCL-XL, RPMI 8226 cells were incubated with or without the pan-caspase inhibitor Z-VAD-fmk (50μM) for 1 hour before exposure to GCS-100 (500 μg/mL) for 24 hours (Figure 3D). As predicted, cleavage of caspase-3 and caspase-8 was detected after exposure to GCS-100 accompanied by reduction in levels of MCL-1 and BCL-XL and increased NOXA levels. No caspase cleavage was detected in cells incubated with Z-VAD-fmk before GCS-100 treatment, confirming inhibition of caspase activation (Figure 3D). In these cells, MCL-1 was not reduced after GCS-100 exposure. However, BCL-XL levels were reduced and NOXA levels increased despite caspase inhibition. This suggests that the GCS-100–induced reduction of MCL-1 is a caspase-dependent event, whereas BCL-XL and NOXA changes are independent of caspase activation.
The uptake of DiOC6(3) and DAPI was also examined in caspase-inhibited cells after 48 hours (Figure 3E-G). Examination of Δψm in viable cells (DAPI-negative) revealed a significant rise in the proportion of DiOC6(3) low cells from 12% to 30% (P < .001) when treated with GCS-100 alone with no difference between control cells and cells preincubated with Z-VAD-fmk, suggesting direct caspase-9 involvement. MCL-1 levels remained stable (Figure 3F). In contrast, examination of DAPI-positive or DiOC6(3) low cells, regardless of DAPI, demonstrated a significant increase in necrotic/nonviable cells despite inhibition of caspase activity (Figure 3E,G). The proportion of DAPI-positive cells increased from 19% to 38% when exposed to GCS-100 alone (P = .002) and 28% when preincubated with Z-VAD-fmk before GCS-100 exposure (P = .04; Figure 3G). The difference between caspase inhibitor-exposed and noncaspase inhibitor-exposed cells treated with GCS-100 was not significant (P = .1). The proportion of DiOC6(3) low cells increased from 24% to 52% (P = .001). Preincubation with Z-VAD-fmk was associated with a lower proportion of DiOC6(3) low cells (33%), but this was still significantly greater than control cells (P = .02; Figure 3E). The difference between GCS-100–treated and Z-VAD-fmk/GCS-100–treated cells was also significant (P = .01). Despite caspase inhibition, cell death continues to occur at a reduced level compared with non–caspase-inhibited GCS-100–treated cells. This implies that both caspase-dependent and caspase-independent mechanisms for cell death are involved.
GCS-100 modulates cell-cycle protein expression
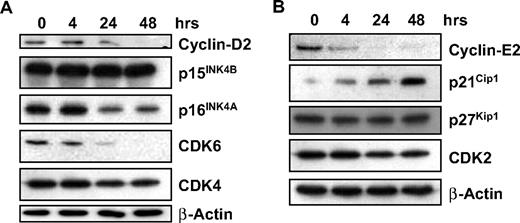
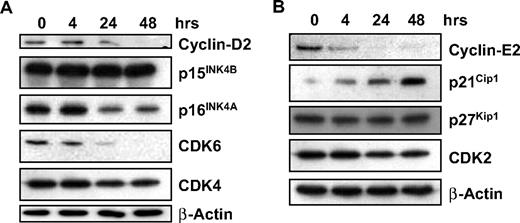
We have shown that GCS-100 leads to accumulation of cells in sub-G1 with a significant increase in cells in G1 and an associated fall in cells in S phase and G2/M, suggesting effects on cell-cycle regulation. Expression of proteins associated with regulation of G1 progression, their associated cyclin-dependent and CDK inhibitors were examined. Treatment with GCS-100 led to a down-regulation of Cyclin D2 after 24 hours with an associated reduction in CDK6 and modest reduction in p16INK4A (Figure 4A). CDK4 and p15INK4B were unaffected (Figure 4A). Similarly, a reduction in Cyclin E2 was observed after 4 hours of exposure to GCS-100 together with a moderate reduction in CDK2 and increased expression of p21CIP1 but no change in p27KIP1 (Figure 4B).
GCS-100 modulates cell-cycle regulatory proteins. (A-B) Western blot analysis of RPMI 8226 cells cultured with 500 μg of GCS-100 for up to 48 hours. Whole-cell lysates were prepared, 25 μg of protein was separated using 12% or 15% SDS-PAGE and after transfer to PVDF membrane was probed with the indicated antibody. β-Actin was used to ensure equal protein loading.
GCS-100 modulates cell-cycle regulatory proteins. (A-B) Western blot analysis of RPMI 8226 cells cultured with 500 μg of GCS-100 for up to 48 hours. Whole-cell lysates were prepared, 25 μg of protein was separated using 12% or 15% SDS-PAGE and after transfer to PVDF membrane was probed with the indicated antibody. β-Actin was used to ensure equal protein loading.
Downstream effects on signal transduction
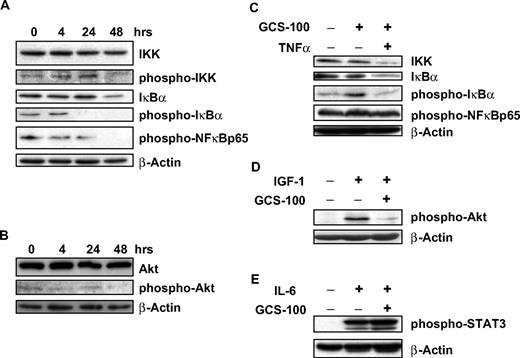
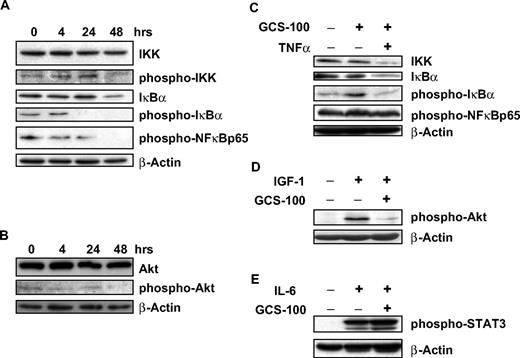
Stimulation of myeloma cells with TNF-α or IL-6 is associated with activation of IKK, IκBα, and NF-κB suggesting induction of signal transduction.18,37 Galectin-3 is also activated by NF-κB, and its expression is associated with NF-κB activation.20 After exposure to GCS-100 for 48 hours, there was a modest reduction of phosphorylated-IκB kinase, whereas nonactivated IKK levels remained stable (Figure 5A). After 24 hours of GCS-100 exposure, a marked reduction in phosphorylated-IκBα (p-IκBα) was observed, accompanied by a moderate reduction in both IκBα levels (Figure 5A) and the downstream p65-NF-κB subunit. AKT is an upstream regulator of the NF-κB canonical pathway and is constitutively activated at low levels of RPMI 8226 cells. GCS-100 incubation (500 μg/mL) led to a modest reduction in p-AKT with no change in AKT levels (Figure 5B).
GCS-100 treatment is associated with modulation of cell-signaling proteins and inhibits IGF-1 and TNF-α pathway stimulation. (A-B) RPMI 8226 cells were exposed to 500 μg/mL GCS-100 for up to 48 hours and after preparation of whole-cell lysates examined by Western blot. A total of 50 μg of protein was separated using 12% SDS-PAGE, transferred to PVDF membrane, and probed using the indicated antibodies. (C-E) RPMI 8226 cells were incubated in serum-free media for 1 hour and then cultured with 500 μg/mL GCS-100 or control media for 2 hours. Cells were then stimulated with TNF-α (5 ng/mL), IGF-1 (100 ng/mL), or IL-6 (10 ng/mL) for 30 minutes. Whole-cell lysates were prepared and 50 μg of protein resolved using 12% gel, transferred to PVDF, and probed with the indicated antibodies. β-Actin was used as a loading control.
GCS-100 treatment is associated with modulation of cell-signaling proteins and inhibits IGF-1 and TNF-α pathway stimulation. (A-B) RPMI 8226 cells were exposed to 500 μg/mL GCS-100 for up to 48 hours and after preparation of whole-cell lysates examined by Western blot. A total of 50 μg of protein was separated using 12% SDS-PAGE, transferred to PVDF membrane, and probed using the indicated antibodies. (C-E) RPMI 8226 cells were incubated in serum-free media for 1 hour and then cultured with 500 μg/mL GCS-100 or control media for 2 hours. Cells were then stimulated with TNF-α (5 ng/mL), IGF-1 (100 ng/mL), or IL-6 (10 ng/mL) for 30 minutes. Whole-cell lysates were prepared and 50 μg of protein resolved using 12% gel, transferred to PVDF, and probed with the indicated antibodies. β-Actin was used as a loading control.
GCS-100 overcomes the protective effect of IGF-1 and TNF-α
To determine the impact of GCS-100 on important signaling pathways in myeloma, cell lines were pretreated with GCS-100 before stimulation with the cytokines TNF-α, IGF-1, and IL-6. TNF-α activates IκBα with associated reduction of IκBα and activation of NF-κB.37 RPMI 8226 cells were preincubated with GCS-100 for 2 hours with stimulation with TNF-α (5 ng/mL) for 30 minutes. Exposure to TNF-α alone led to an increase in p-IκBα with no changes in p-p65NF-κB, IκBα, or IKK levels (Figure 5C). Cells preincubated with GCS-100 (500 μg/mL) did not increase in p-IκBα after TNF-α stimulation. However, the combination of GCS-100 treatment and TNF-α stimulation was associated with a reduction in IKK and IκBα. No change in p-p65NF-κB levels was observed (Figure 5C).
Myeloma cell stimulation by IGF-1 (100 ng/mL) is associated with activation of AKT.13 However, cells incubated with GCS-100 (500 μg/mL) before IGF-1 stimulation already had markedly reduced activation of AKT compared with untreated cells before IGF-1 stimulation (Figure 5D).
RPMI 8226 cells have no constitutively active STAT3; however, after stimulation with IL-6 (10 ng/mL), there is rapid and sustained phosphorylation of STAT3. This activation of STAT3 is not prevented by culturing cells with GCS-100 (500 μg/mL) before IL-6 stimulation (Figure 5E).
GCS-100 reduces primary myeloma cell viability and overcomes the protective effect of stromal cells
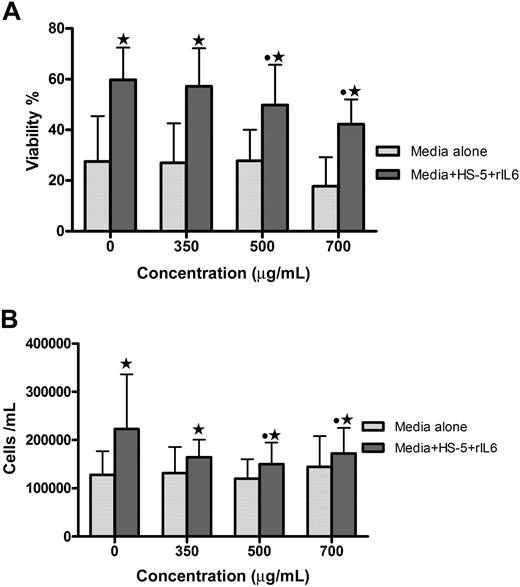
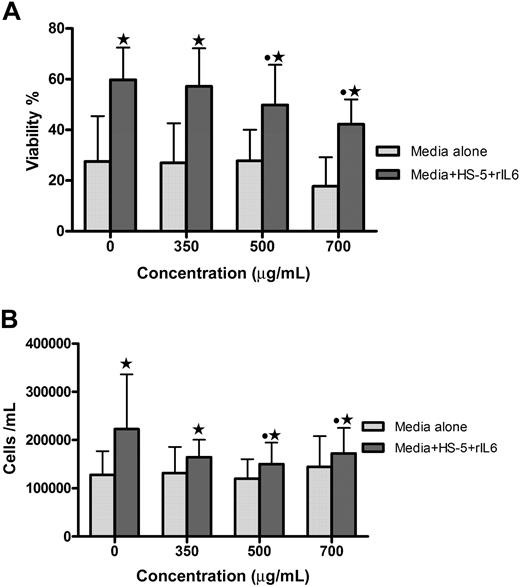
The effect of GCS-100 on primary myeloma cells and human stromal cells was assessed. Coculture for 48 hours with stromal cells increases the viability of primary myeloma cells (Figure 6). To determine whether GCS-100 can disrupt the protective effect of stromal cells, the viability and number of primary cells cocultured with stromal cells were assessed after 48-hour incubation with GCS-100 (0-700 μg/mL). The viability of all 4 primary cell-stromal cell cocultures was significantly reduced in a concentration-dependent manner; and for 3 of 4 samples, this was associated with a reduction in cell number (Figure 6). For 3 of 4 primary samples, a greater proportional GCS-100–induced reduction of viability was observed in the coculture system compared with primary cells cultured alone (Figure 6A). GCS-100 did not significantly reduce the viability or number of stromal cells (data not shown). This confirms that GCS-100 reduces primary cell proliferation and viability and, in this model, is able to overcome the protective effect of coculture with human stromal cells.
GCS-100 reduces viability and number of primary myeloma cells and overcomes stromal cell protection. Primary myeloma cells (1 × 10⁵ cells/mL) were incubated for 48 hours with GCS-100 (0-700 μg/mL) for 48 hours with or without human stromal cells (HS-5)/IL-6 (10 ng/mL). Viability (A) and cell number (B) were measured by PCA-96 ViaCount Assay. Bar graphs show the mean (± SEM) results from 4 different patient primary cell experiments. *Significant difference between cells incubated with or without HS-5 cells at the same concentration of GCS-100. ● represents a significant difference compared with non–GCS-100–exposed cells.
GCS-100 reduces viability and number of primary myeloma cells and overcomes stromal cell protection. Primary myeloma cells (1 × 10⁵ cells/mL) were incubated for 48 hours with GCS-100 (0-700 μg/mL) for 48 hours with or without human stromal cells (HS-5)/IL-6 (10 ng/mL). Viability (A) and cell number (B) were measured by PCA-96 ViaCount Assay. Bar graphs show the mean (± SEM) results from 4 different patient primary cell experiments. *Significant difference between cells incubated with or without HS-5 cells at the same concentration of GCS-100. ● represents a significant difference compared with non–GCS-100–exposed cells.
Discussion
GCS-100 is a first in class galectin-3 inhibitor. It is shown to induce MCL-1/BCL-XL down-regulation with associated NOXA and p21Cip1 up-regulation, resulting in concomitant Cyclin E and Cyclin D2 down-regulation in myeloma cells. In addition, activated NF-κB/AKT is reduced. Overall, this multifactorial response to GCS-100 contributes in a focused manner to positive signals for cell death. Apoptosis is activated via both the extrinsic (caspase-8) and intrinsic (caspase-9) pathways. It may be postulated that carbohydrate binding domains play an important role in myelomagenesis mediated by these antiapoptotic molecules. Targeting these domains with GCS-100 would appear to be an appropriate modality for myeloma therapy, and the good safety profile in a recently reported early clinical trial in chronic lymphocytic leukemia supports its therapeutic potential.
Extending an earlier study,27 this work shows activation of caspase-9 as well as caspase-8, with GCS-100 significantly inducing apoptosis and reducing proliferation concomitant with caspase-9 activation. The bimodal caspase activation could suggest a role for the recently discovered P62 protein. Interestingly, prosurvival BCL-2 family proteins MCL-1 and BCL-XL are the only down-regulated members of the antiapoptosis proteins. A higher concentration of GCS-100 for the resistant U266 cell line was predictably required. MCL-1 is a critical molecule for myeloma cell survival, making GCS-100 a potentially useful therapeutic molecule. The p53-responsive BH3-only protein PUMA and AKT-regulated BAD can both interact with MCL-1 and BCL-XL but were unaltered by GCS-100. However, NOXA, a BH3 only protein that exclusively binds MCL-1 and A1, was rapidly and markedly increased after GCS-100 exposure, suggesting that these proteins are intermediaries for GCS-100 activity. This is consistent with reports that the antimyeloma activity of bortezomib is the result of NOXA up-regulation and MCL-1 cleavage/degradation.38,39 Crosstalk between the extrinsic and intrinsic pathways has been previously reported in interferon-α–treated myeloma cells mediated by activated BID, a BH3-only proapoptotic BCL-2 protein, observed to initiate cytochrome c release from mitochondria, thereby initiating intrinsic apoptosis.40,41 This study did not detect BID activation, and there was no reduction in full-length BID, suggesting an alternate crosstalk route. Similarly, it has been shown that tumor necrosis factor-related apoptosis-inducing ligand-induced extrinsic pathway activation cleaves caspase-8 inducing MCL-1 degradation, allowing BIM to mediate release of apoptogenic proteins from the mitochondria.42 Inhibiting caspase activity with the pan-caspase inhibitor Z-VAD-fmk prevented MCL-1 but not BCL-XL reduction or NOXA induction; and although cell death was observed, this was significantly reduced compared with noncaspase-inhibited GCS-100–treated cells. These findings suggest that NOXA induction alone is insufficient to mediate MCL-1 reduction, and caspase activation is required. BCL-XL is also reduced despite caspase inhibition, suggesting an alternative regulatory mechanism. NF-κB is a recognized regulator of BCL-XL, and its activation is also reduced after GCS-100 exposure. However, the importance of BCL-XL in GCS-100–mediated apoptosis is uncertain as its reduction alone is insufficient to induce mitochondrial depolarization. These data all point to significant induction of apoptosis via both caspase pathways after treatment with GCS-100, but additional noncaspase cell death may also occur.
Deregulation of cell-cycle proteins, particularly the Cyclin D proteins in myeloma, have been suggested to be important in the disease process.9 This study shows an increase in cells in sub-G1 phase with a concomitant decrease in cells in S phase consistent with apoptosis. In GCS-100–treated RPMI 8226 cells, a decrease in levels of Cyclin D2 was observed and accompanied by a reduction in CDK6 expression and the CDK inhibitor protein p16INK4A. Examination of the late G1 proteins revealed a rapid increase in p21CIP1, unaltered p27KIP1, and a rapid reduction of Cyclin E and CDK2 restricting progression through G1 to S phase. Targeting of the cell cycle by GCS-100 appears significant in myeloma cells by increasing p21Cip1 and may be mediated by reduction of signal transduction as suggested by a down-regulatory effect on AKT, IκBα, p65NF-κB, and IKK after 24 hours. The stimulation of myeloma cells with TNF-α leads to strong activation of IκBα with associated NF-κB activation and a reduction of IκB.37 Pretreatment of cells with GCS-100 inhibited this activation of the NF-κB pathway. Interestingly, apoptosis induction with GCS-100 was associated with a reduction of IκB levels in addition to a reduction of activation of IκB, suggesting that the effect on NF-κB may not be associated with proteosome inhibition, which is associated with IκB stabilization.43 This may explain the reported additive effects observed when bortezomib and GCS-100 are used in combination.27 One of the upstream regulators of NF-κB activation is AKT, which is strongly activated in myeloma cells after stimulation with IGF-1.12 GCS-100 pretreatment for 2 hours before IGF-1 stimulation was able to reduce AKT activation, suggesting that the observed effects on the NF-κB pathway may be related to inhibition of AKT.
GCS-100, a galectin-3 antagonist, is a multimodal and beneficial agent against myeloma cells with MCL-1 reduction and cell-cycle inhibition as important therapeutic targets. We provide the logic rationale for clinical testing of GCS-100 for myeloma and other malignancies involving both apoptosis and signal transduction deregulation.
The publication costs of this article were defrayed in part by page charge payment. Therefore, and solely to indicate this fact, this article is hereby marked “advertisement” in accordance with 18 USC section 1734.
Acknowledgments
The authors thank Dr Paul Allen and Dr Rebecca Auer for reviewing the manuscript and for their helpful comments. GCS-100 was provided as a gift by Prospect Therapeutics.
Authorship
Contribution: M.J.S. designed and performed the research, analyzed data, and wrote the paper; F.E.C. designed the research, analyzed the data, and wrote the paper; L.M. and S.J. performed primary cell experiments; and J.G.G. and S.A.S. aided experimental design.
Conflict-of-interest disclosure: The authors declare no competing financial interests.
Correspondence: Finbarr E. Cotter, Medical Oncology, John Vane Science Centre, Bart's & The London School of Medicine, Charterhouse Square, London EC1M 6BQ, United Kingdom; e-mail: f.e.cotter@qmul.ac.uk.

